Our 58-point scientific TradingView lab test, audit, and benchmarking include speed, accuracy, value, and feature depth with data-driven precision.
TradingView earned a AAA 4.75 Composite Lab Performance Score, placing it at the ceiling of my benchmark range and confirming its status as an elite industry leader. Following a rigorous 58-point scientific audit, I evaluated the platform’s speed, accuracy, and feature depth with data-driven precision.
Composite Lab Performance Score
TradingView earned a AAA 4.75 Lab Test Composite Score, which puts it at the top of my benchmark range.
In plain terms, it’s one of the few platforms that feel “complete” across the workflows that actually matter day-to-day: charting, scanning, alerts, community scripts, and multi-asset coverage—without forcing you into a heavy desktop install or a fragmented tool stack.
| Metric | TradingView | High | Median | Low |
|---|---|---|---|---|
| Composite Lab Performance Score (CLPS) | 4.75 | 4.75 | 4.21 | 2.93 |
What pushed TradingView to the ceiling of the category in my scoring isn’t one gimmick feature—it’s the combination of (1) speed, (2) charting depth, (3) automation-ready alerts, and (4) ecosystem scale. The weaknesses are real, but they’re mostly “edge-case” needs (portfolio basket backtesting, vendor-audited signals, terminal-grade breaking news, enterprise-style SLA support).
TradingView Benchmarked Lab Scores
| Test | Tier | Score | Average |
|---|---|---|---|
| Composite Lab Performance Score | AAA | 4.75 | 4.21 |
| Pricing Index: $ per Day | AA | $1.97 | $2.74 |
| Value Score (VP) | AA | 4.37 | 2.82 |
| Speed & Ease of Use | AAA | 5.00 | 4.50 |
| Chart Analysis Depth Index | AAA | 5.00 | 3.17 |
| Chart Pattern Depth & Accuracy | B | 3.98 | 2.73 |
| Scanning Performance | AAA | 4.83 | 3.38 |
| Backtesting Performance | A | 4.19 | 3.38 |
| Trading Bot & Auto-Trading Reliability | B | 3.50 | 2.50 |
| AI & Algo Index | B | 3.00 | 2.00 |
| Alert Speed | AA | 4.67 | 3.67 |
| Trade Signal Quality | C | 2.50 | 0.00 |
| Broker Connectivity & Ecosystem Depth | AAA | 5.00 | 1.55 |
| Portfolio Tool Performance | B | 3.60 | 2.80 |
| Financial News Speed & Depth | B | 3.00 | 2.30 |
| Community Utility Index (CUI) | AAA | 5.00 | 3.25 |
| Support Infrastructure & SLA Audit | B | 3.25 | 3.75 |
In this review, I dissect TradingView’s performance across 17 lab-tested categories—including scanning latency, backtesting fidelity, broker connectivity, and community IP—comparing its results directly against the market median. Use this report to determine whether TradingView provides the operational edge you need for your specific trading and investing workflow.
Verdict
TradingView is the “best overall” platform because it wins the categories that define daily effectiveness—speed, charting depth, scanning, alerts, ecosystem breadth, and community.
The gaps are clear and manageable if you understand them upfront: portfolio-level basket testing, AI-native signal engines, and true terminal-grade news are not TradingView’s mission.
Reasons to Consider TradingView
- You want the best all-around platform for global multi-asset charting, research, and community.
- You care about workflow speed, multi-chart responsiveness, and low-friction daily use.
- You want deep indicators + accessible scripting (Pine) to build your own edge.
- You rely on alerts at scale, including webhook delivery for automation handoff.
- You want broad broker connectivity and the option to trade from charts.
Reasons to Avoid (or Pair With Another Tool)
- You need a native portfolio and basket-level backtesting as a first-class, no-workaround workflow.
- You want vendor-supplied, audited trade signals rather than a build-your-own signals platform.
- Your strategy depends on breaking news latency and institutional-grade news depth.
- You require enterprise-style support channels with guaranteed escalation paths.


Pricing Index
TradingView’s pricing story only becomes “honest” when you price it the way real traders use it. You can start free, but most active users eventually add real-time exchange data and a paid tier, which is why I anchor the benchmark on Effective Monthly Cost (EMC) rather than headline plan price.
| Metric | Calculation | TradingView | High | Median | Low |
|---|---|---|---|---|---|
| Cost-per-day | $/day on an annual plan. Minimum viable plan with real-time exchange data | $1.97 | $9.99 | $2.74 | $0.74 |
| $ per feature | Effective Monthly Cost / Total Features | $3.53 | $28.92 | $4.29 | $0.00 |
| Effective Monthly Cost (EMC) | EMC = (Plan price + required real-time data fees + any required add-ons) / month | $66.44 | $303.87 | $83.82 | $22.50 |
- $ per feature (EMC / total features): $3.53 vs. Median: $4.29 means TradingView has a lower-than-average cost per feature.
- Effective Monthly Cost (EMC): $66.44/mo vs. Median: $83.82, including a real-time data package, making it significantly lower than the median cost.
- Cost-per-day (annual; not scored): $1.97/day vs Median: $2.74/day. TradingView is significantly cheaper than the median cost.
TradingView’s cost per day is under the benchmark median, but it is not a “budget pick.” Where it holds up well is in the cost-per-feature profile: you are paying a low monthly fee for a platform that delivers unusually broad capabilities (charts, alerts, scripting, community). In practice, that tends to be why TradingView can look lower than average on price and still feel like a strong value proposition in day-to-day use—especially if you actually use its multi-feature stack rather than treating it as a single-purpose charting app.
Context: TradingView isn’t always the cheapest once you build a “minimum viable real-time” setup, but it remains competitive because it consolidates multiple tools into one workflow: charts + screening + alerts + a giant library of community-built scripts. For many traders, that consolidation is the real value.
Value Score (VP)
TradingView posted a A 4.20, which is close to the best score in my benchmark (High: 4.37 | Median: 2.82 | Low: 1.7). This category answers a simple question: “Even if the price is fair—how much practical utility do you really get?”
| Metric | Calculation | TradingView | High | Median | Low |
|---|---|---|---|---|---|
| Value Score (VP) | Sum of Feature Quality (60% Weight), Feature Depth (30%), & Device Support Depth (10%) | 4.37 | 4.37 | 2.82 | 1.70 |
| Value Rank | Percentile Ranking | 5.00 | 5.00 | 2.50 | 1.00 |
| Feature Quality | Average of All Feature Quality Ratings | 4.07 | 4.16 | 2.97 | 2.00 |
| Feature Breadth | Feature richness (count of meaningful core features) | 17 | 17 | 12 | 9 |
| Feature Depth | Percentile Ranking | 4.75 | 4.75 | 3.00 | 1.00 |
| Device Support Depth | Web 2 points, (PC, Android/iOS/ 1 Point each) | 5.00 | 5.00 | 2.00 | 1.00 |
Context: This is the “why TradingView” metric. Plenty of platforms have features; TradingView’s advantage is that the features are polished, broadly usable, and accessible across devices—which matters more than raw checkbox counts.
TradingView wins Value Score because it combines high breadth and depth with full device coverage—few platforms hit all three at once. TrendSpider edging Feature Quality is consistent with its heavier “automation-first” feature design, but TradingView’s overall mix (breadth + depth + device reach) is what pushes it to the top.
Speed & Ease of Use
TradingView scored a perfect AAA 5.00 (High: 5.00 | Median: 4.17 | Low: 2.6). This category measures friction: how quickly you can move from “idea” to “chart” to “action,” especially in multi-chart workflows.
| Metric | Calculation | TradingView Score | High | Median | Low |
|---|---|---|---|---|---|
| Speed & Use Index Rating | Average of Time to Chart Performance, Multimonitor Chart Speed & 3 Click Rule: Ease of Use | 5.00 | 5.00 | 4.25 | 2.60 |
| Time to Chart Speed (Seconds) | Seconds from clicking the icon to a fully loaded chart with 200 price bars & 2 indicators | 1.55 | 17.03 | 4.70 | 1.60 |
| Time to Chart Performance | Speed to Chart Points (<5s=5, <10=4.5, <15=4, <20=3) | 5.00 | 5.00 | 4.50 | 3.00 |
| Multi-Chart Latency (ms) | Delay in milliseconds when syncing 4 charts | 20 | 667 | 209 | 10 |
| Multimonitor Chart Speed | Multi-Chart Sync Points (<50ms=5 … >500ms=2, No Multicharts=0) | 5.00 | 5.00 | 3.50 | 0.00 |
| 3-Click Rule Test | Number of clicks to place a trade or launch a scan | 2 | 6 | 3 | 2 |
| 3 Click Rule: Ease of Use | 3 Click Points (each click > 3 = 1 minus point) | 5.00 | 5.00 | 4.50 | 3.30 |
TradingView’s speed profile is elite: a 1.55s “time-to-chart” result and top-tier multi-chart sync align with my audit notes that it “feels local,” which is exactly what traders notice under pressure. TC2000 beats it on raw multi-chart latency (10ms), but TradingView’s balance of fast start + strong multimonitor performance + low-friction workflows keeps it at the top of the overall usability index.
Context: This is one of TradingView’s most underrated advantages. When charting feels slow, people compensate by keeping fewer charts open, checking fewer symbols, and reacting later.
TradingView’s responsiveness supports “wide awareness” trading—multiple layouts, symbols, and timeframes—without turning the platform into a chore.
Chart Analysis Depth Index
TradingView scored AAA 5.00 (High: 5.00 | Median: 3.17 | Low: 0.5). This is the category most people implicitly buy TradingView for: charting depth plus an ecosystem that lets you push far beyond defaults.
| Metric | Calculation | TradingView Score | High | Median | Low |
|---|---|---|---|---|---|
| Chart Analysis Depth Index | Average of Chart Depth, Indicator Depth & Custom Coding Scores | 5.00 | 5.00 | 3.17 | 0.50 |
| Chart Types | Total Count | 21 | 38 | 10 | 1 |
| Chart Depth | Chart Type Score (0.3 points per chart) | 5.00 | 5.00 | 3.00 | 0.30 |
| Indicators | Total Count | 400 | 400 | 116 | 0 |
| Indicator Depth | Indicators Score (0.025 points per indicator) | 5.00 | 5.00 | 2.90 | 0.00 |
| Custom Indicator Coding | Available = 5 Points | 5.00 | 5.00 | 2.50 | 0.00 |
TradingView’s charting depth win is driven by the complete package: a strong variety of charts, a maximum indicator library depth (400), and full custom scripting via Pine. Optuma leads in raw chart-type count, but TradingView’s combination of depth and usability (and a massive ecosystem of shared scripts) makes it the more scalable daily driver for most technical traders.
Context: The headline isn’t “400 indicators.” The real story is that TradingView’s charting is both deep and approachable, and Pine Script is accessible enough that traders actually use it—either to build their own tools or to adapt community scripts into something practical.
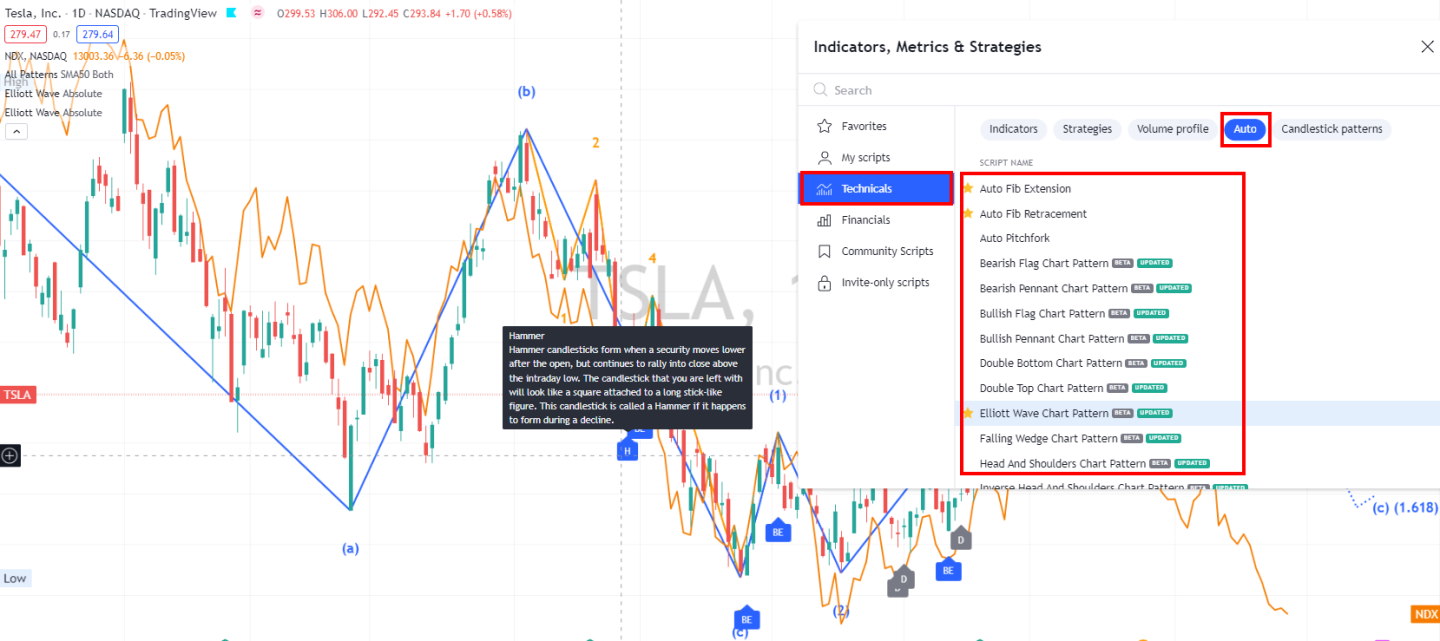
Chart Pattern Depth & Accuracy
TradingView scored B 3.98 (High: 4.88 | Median: 2.73 | Low: 0.0). Pattern recognition is an area where TradingView is strong, but it’s not always the maximum-depth leader versus specialist pattern engines.
TradingView’s pattern recognition is very good, especially the functionality for setting price targets on charts. They are straightforward to use—so while they don’t rely on sheer pattern library size, they perform strongly where it matters: accuracy and usability.
| Metric | Calculation | TradingView Score | High | Median | Low |
|---|---|---|---|---|---|
| Pattern Recognition Efficacy & Accuracy | Average of Pattern Recognition Depth & Accuracy Scores | 3.98 | 4.88 | 2.73 | 0.00 |
| Total Patterns | Count of unique patterns recognized | 97 | 226 | 57.5 | 0 |
| Pattern Recognition Depth | 0.33 points per pattern recognized | 3.20 | 5.00 | 1.90 | 0.00 |
| Candle Patterns Recognized | Count | 44 | 172 | 20 | 0 |
| Chart Price & Trend Patterns Recognized | Count | 53 | 54 | 16 | 0 |
| Accuracy | Percent Accurate | 95% | 95% | 89% | 0% |
| Pattern Recognition Accuracy | Accuracy Points (0.05 points per 1% accurate) | 4.75 | 4.75 | 4.48 | 0.00 |
If automated discovery is the priority, TrendSpider is clearly the benchmark leader, but TradingView remains very competitive for traders who want pattern logic without heavy configuration overhead.
Context: The biggest win for TradingView here is usability. Patterns are presented in a way that fits real chart workflows—clear, visual, and easy to validate—rather than dumping a long list of detected shapes. For most traders, that practical integration matters more than “who has the largest raw count.”
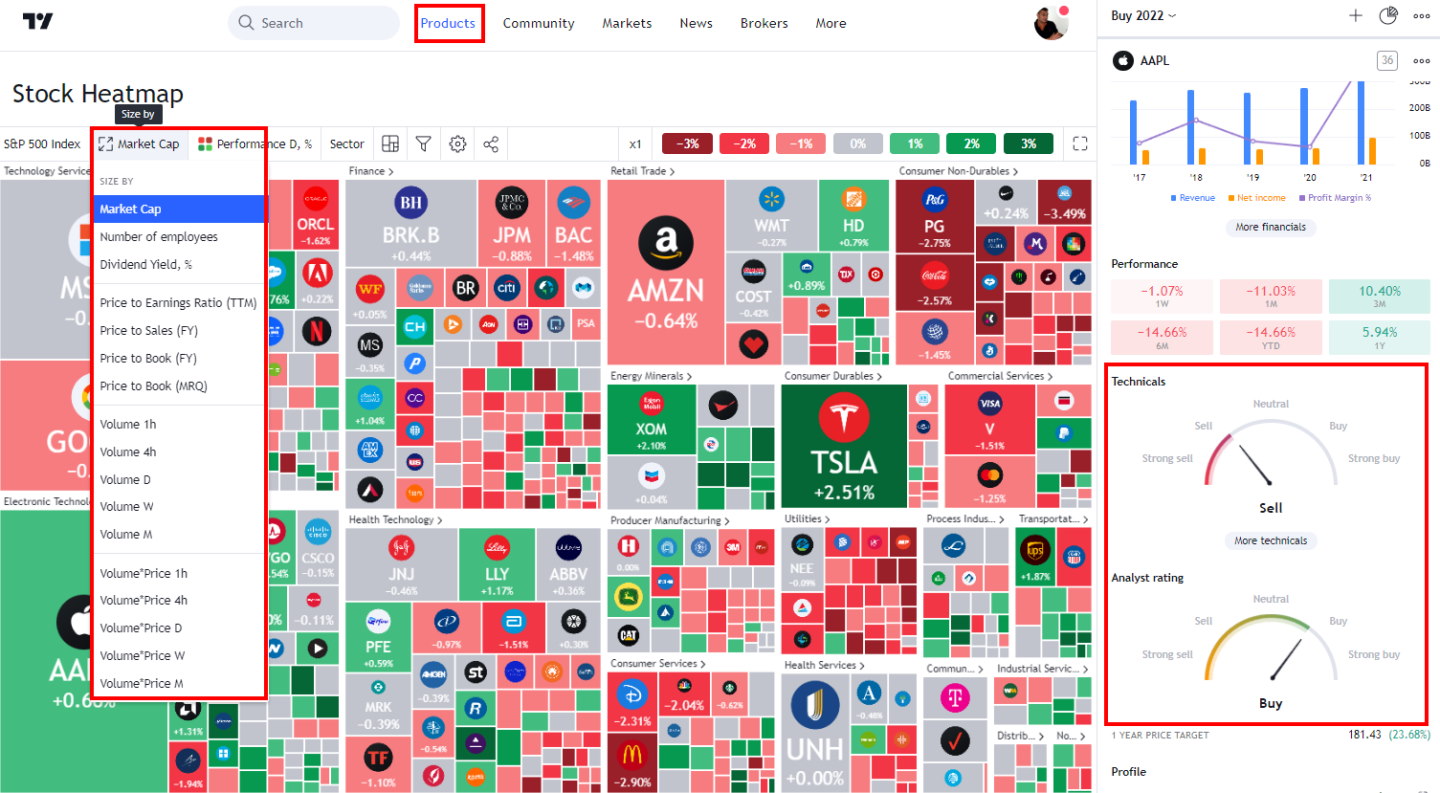
Scanning Performance
TradingView scored AAA 4.83 (High: 5.00 | Median: 3.38 | Low: 0.8), with standout results on speed and strong criteria depth.
| Metric | Calculation | TradingView Score | High | Median | Low |
|---|---|---|---|---|---|
| Market Scanning Latency & Depth | Average of Scanning Speed, Criteria & Custom Code Scores | 4.83 | 5.00 | 3.38 | 0.80 |
| Scanner Performance (ms) | Milliseconds to scan the S&P 500 across 5 criteria | 7 ms | 2500 ms | 300 ms | 7 ms |
| Scanning Speed (ms) | Points (<100ms=5; <200=4.5; <500=4; <1000=3; <2000=2) | 5.00 | 5.00 | 4.00 | 1.00 |
| Scanner Auto-Refresh Rate (seconds) | Auto-refresh speed (not scored) | 10 s | 60 s | 1 s | 0 s |
| Scanning Criteria & Depth | Total criteria count | 360 | 675 | 200 | 30 |
| Scanning Criteria & Depth | Points (0.0125 points per criterion) | 4.50 | 5.00 | 2.50 | 0.80 |
| Custom Code Scanning | Exists = 5 points | 5.00 | 5.00 | 5.00 | 0.00 |
In my audit notes, I call out TradingView’s breadth of scan fields (“360 criteria across Stocks, ETFs, Crypto Coins, Bonds”) and the raw scan speed (7 ms), which explains why it feels so responsive in real-time workflows. Where it doesn’t dominate is criteria breadth versus tools like Stock Rover (which is built around deep fundamental universes and database-style screening).
Context: This is why TradingView works for more than just “chart-first” discretionary traders. It supports a systematic workflow: scan → shortlist → validate → alert. When scans are fast and criteria are deep, the platform can serve as a genuine discovery engine, not just a chart viewer.
Backtesting Performance
TradingView scored A 4.19 (High: 4.90 | Median: 3.38 | Low: 0.0). It’s exceptionally fast and flexible—if you’re willing to operate in Pine. The trade-off is that it is not a no-code portfolio simulation suite.
TradingView has a key backtesting trade-off: it’s exceptionally fast on a single instrument, but basket testing is limited and relies on third-party scripts—hence the 2.5 score compared with platforms that natively support portfolio/basket simulation. If your strategy research is multi-asset and systematic by default, Portfolio123 (and TrendSpider for workflow-driven testing) is the stronger fit.
| Metric | Calculation | TradingView Score | High | Median | Low |
|---|---|---|---|---|---|
| Quantitative Backtesting Fidelity | Avg of Backtesting Speed, No Coding, Flexible Coding, Report Quality, Basket Backtesting | 4.19 | 4.90 | 3.38 | 0.00 |
| Backtesting Speed (ms) | Time to run 10y daily or ~2 months 5-min simulation | 7 ms | 6000 ms | 302 ms | 7 ms |
| Backtesting Speed | Points (<200ms=5; <500=4.5; <10000=4; <20000=3) | 5.00 | 5.00 | 4.25 | 0.00 |
| No Coding Required | Zero-code backtesting (5 points) | 0.00 | 5.00 | 5.00 | 0.00 |
| Flexible Coding Backtesting | Exists = 5 points | 5.00 | 5.00 | 5.00 | 0.00 |
| Backtesting Report Quality | Percent of reporting criteria covered | 85% | 100% | 70% | 0% |
| Backtesting Report Quality | Points (0.05 points per 1%) | 4.25 | 5.00 | 2.25 | 0.00 |
| Multi-Stock Basket Backtesting | If exists = 5 points | 2.50 | 5.00 | 5.00 | 0.00 |
Context: If you want to test ideas quickly on single instruments and iterate on logic, TradingView is outstanding. If you want “portfolio-level basket testing with rich optimization workflows” as a native, first-class experience, that’s where TradingView is less complete and where specialist tools can outperform it.
Trading Bot & Auto-Trading Reliability
TradingView scored B 3.50 (High: 4.50 | Median: 2.50 | Low: 0.0). The correct way to think about TradingView is automation-ready, not “a native bot hosting platform.”
I summarize TradingView’s automation posture as strong “alert → webhook” capability with robust Pine strategies, but with no published SLA commitment—so reliability is good operationally, but not contractually guaranteed. TrendSpider wins this category because it combines execution plumbing with an explicit SLA posture.
| Metric | Calculation | TradingView Score | High | Median | Low |
|---|---|---|---|---|---|
| Automated Execution & Bot Reliability | Sum of Automation Path, Strategy/Bot Sophistication, Operational Assurance | 3.50 | 4.50 | 2.50 | 0.00 |
| Automation Path | 0.5 none; 1.0 alerts; 1.5 webhook/API handoff; 2.0 native/broker-linked execution | 1.50 | 2.00 | 1.00 | 0.00 |
| Strategy/Bot Sophistication | 0.5 simple; 1.0 multi-condition; 1.5 scripting+test; 2.0 bot-platform depth | 2.00 | 2.00 | 1.50 | 0.00 |
| Operational Assurance | 0.5 public status; 1.0 explicit SLA/credits/uptime promise | 0.00 | 1.00 | 0.00 | 0.00 |
- Automation path: 1.50 (webhook/API handoff via alerts)
- Bot sophistication: 2.00 (Pine strategies + logic depth)
- Operational assurance: 0.00 (no explicit public SLA/credits in this rubric)
Context: For many serious traders, TradingView is the “brains + triggers” layer: signals and conditions are defined in Pine, alerts fire server-side, and execution is handled via broker integration or an external automation layer. If you require native, fully managed bot execution with enterprise-style guarantees, you’ll typically pair TradingView with a dedicated execution stack.
AI & Algo Index
TradingView scored B 3.00 (High: 5.00 | Median: 2.00 | Low: 1.0). This category intentionally separates algorithmic capability from AI-native decisioning.
Context: TradingView is an algorithmic sandbox and scripting ecosystem. It’s excellent for building, testing, and refining logic. It is not positioned as a “black box AI that tells you what to buy.”
| Metric | Calculation | TradingView Score | High | Median | Low |
|---|---|---|---|---|---|
| Algorithmic Intelligence & AI Tier Index | Sum of Algo Depth, AI Layer, Transparency Points | 3.00 | 5.00 | 2.00 | 1.00 |
| Algo Depth | 0.5 alerts only; 1.0 rules strategies; 1.5 backtesting+factor; 2.0 advanced quant platform | 2.00 | 2.00 | 1.50 | 0.00 |
| AI Layer | 0.0 none; 1.0 assistive; 1.5 ML signals core; 2.0 AI-native decisioning | 0.00 | 2.00 | 0.00 | 0.00 |
| Transparency | 0.0 black-box; 0.5 some; 1.0 clear methodology + validation | 1.00 | 1.00 | 1.00 | 0.00 |
- Algo depth: 2.00 (strong rules + strategies)
- AI layer: 0.00 (no evidence of an AI-native signal engine in core scoring)
- Transparency: 1.00 (inspectable logic when expressed in Pine)
Alert Speed
TradingView scored AA 4.67 (High: 4.67 | Median: 3.67 | Low: 2.3). Alerts are one of TradingView’s clearest paid-plan justifications because they scale—both in volume and in practical delivery paths.
In my audit notes, I call out TradingView’s combination of high-capacity alerts (2,000) and fast delivery paths (notably webhook and app delivery). The one area where TradingView does not lead is stream richness, compared with TrendSpider, which is built around multi-path, automation-centric alerting.
| Metric | Calculation | TradingView Score | High | Median | Low |
|---|---|---|---|---|---|
| Alert Trigger Latency & Delivery Speed | Avg of Concurrent Alerts, Alert Streams, Alert Speed Rating | 4.67 | 4.67 | 3.67 | 2.30 |
| Concurrent Alerts | 1 point per 50 concurrent (max 5 points) | 5.00 | 5.00 | 5.00 | 5.00 |
| Concurrent Alert Count | Raw alert capacity | 2000 | 2000 | 875 | 400 |
| Alert Streams Richness | Email/webhook/SMS/app etc. 1 point per stream (max 5) | 4.00 | 5.00 | 2.00 | 1.00 |
| Alert Speed Rating | Speed rating points | 5.00 | 5.00 | 3.00 | 1.00 |
- Concurrent alerts: 2,000 (5.00 points)
- Alert streams richness: 4.00 (push/email/webhook)
- Alert speed rating: 5.00
Context: Good alerts reduce “screen addiction.” Server-side alerts with webhook delivery also enable high-quality automation handoffs, which is how many traders turn TradingView into a semi-automated workflow without needing a full bot platform.
Trade Signal Quality
TradingView scored C 2.50 (High: 5.00 | Median: 0.00 | Low: 0.0). This score reflects a key distinction: TradingView is exceptional for building, importing, and sharing signals via scripts, but it’s not primarily a vendor-supplied “audited signal service.”
TradingView’s score reflects that it is primarily a platform for creating and validating signals (via scripts, alerts, strategies), not a curated signal vendor. In my audit notes, I consistently position it as “tooling-first,” whereas Trade Ideas and Tickeron are “signals-forward” by design.
| Metric | Calculation | TradingView Score | High | Median | Low |
|---|---|---|---|---|---|
| Signal Alpha & Predictive Efficacy | 5 points = audited specific trade signals; 2.5 = buy/sell gauges/systemic signals | 2.50 | 5.00 | 0.00 | 0.00 |
- 2.5 points = buy/sell gauges or systemic signals (not a rigorously audited, platform-owned signal product)
Context: If you want signals with a publisher-style evidence trail and accountable methodology, you generally look to specialist signal platforms. If you want the best platform to create, test, and iterate your own signals, TradingView is in its element.
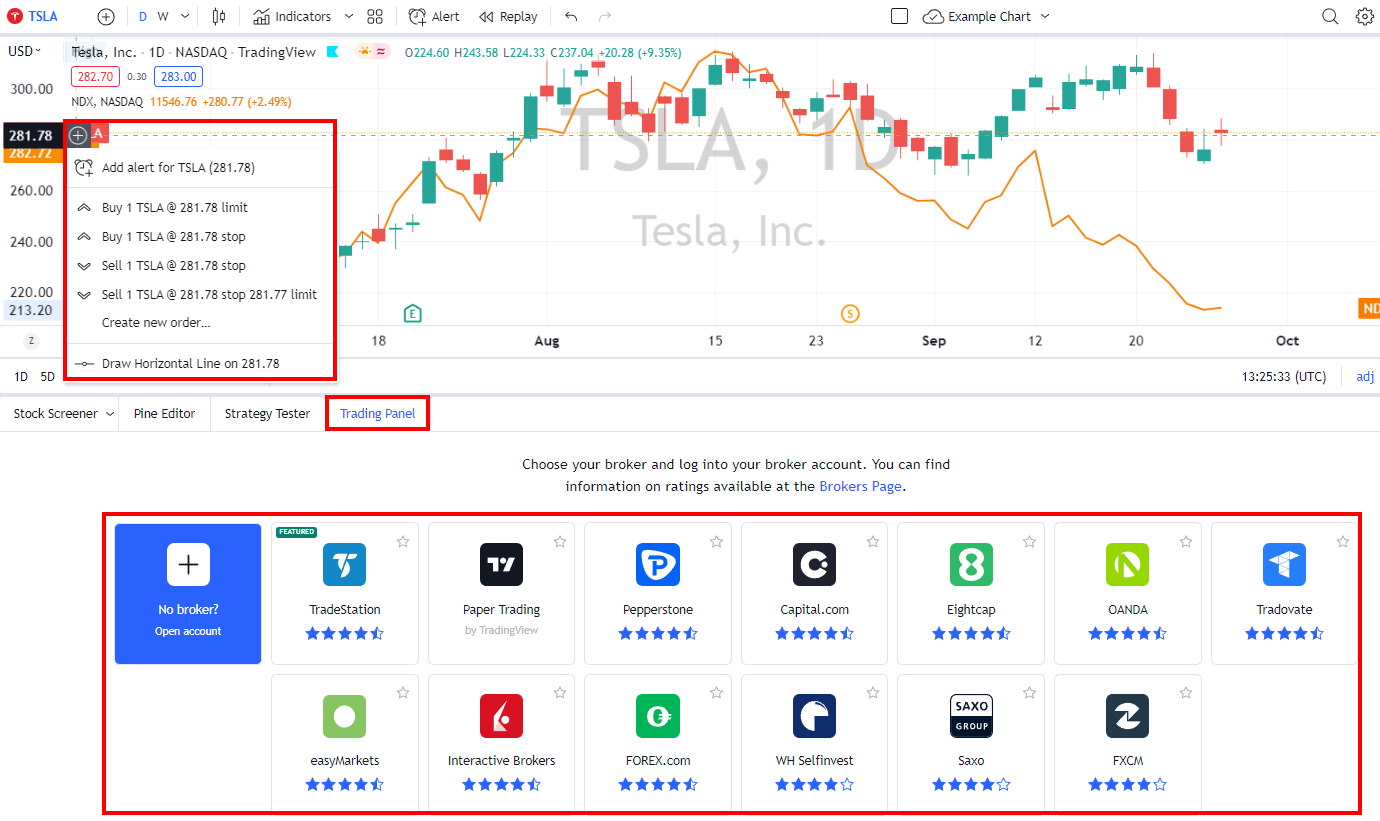
Broker Connectivity & Ecosystem Depth
TradingView scored AAA 5.00 (High: 5.00 | Median: 2.00 | Low: 0.67). This category is a major differentiator because it determines whether TradingView can be the “hub” that connects analysis to execution.
In my audit notes, I note that TradingView markets 100+ integrated brokers and positions the connection at the broker-service level, but without publishing a maximum tested order-latency benchmark. In practice, it’s an ecosystem leader in breadth of connectivity; latency depends on the broker and route rather than on a single vendor-controlled SLA.
| Metric | Calculation | TradingView Score | High | Median | Low |
|---|---|---|---|---|---|
| Asset & Data Coverage Index | Average of Live Trading, Broker Integration, Asset/Data Coverage | 5.00 | 5.00 | 2.00 | 0.67 |
| Live Trading | 5 points | 5.00 | 5.00 | 5.00 | 0.00 |
| Total number of brokers integrated | Raw broker count | 100 | 1200 | 2 | 0 |
| Broker Integration | 0.1 point per broker (max 5 points) | 5.00 | 5.00 | 0.20 | 0.00 |
| Asset & Data Coverage | Stocks, Options, FX, US Exchanges, International Exchanges (1 point each) | 5 | 5 | 2 | 2 |
- Live trading: 5.00
- Integrated brokers (scored): 100 → 5.00 points (capped)
- Asset & data coverage: 5.00 (stocks/options/FX/U.S./international)
Context: TradingView’s ability to connect charts to execution reduces friction and the need to switch tools. The important caveat is that TradingView does not publish a “max tested order latency” figure in the inputs provided here. So latency-sensitive traders should view TradingView as a premium interface layer, not a routing-performance certifier.
Portfolio Tool Performance
TradingView scored B 3.60 (High: 4.80 | Median: 2.80 | Low: 2.0). The portfolio tools are useful and improving, but they aren’t meant to replace dedicated investor-grade analytics platforms.
In my audit notes, I describe TradingView portfolios as solid for benchmarking and key ratios (beta/Sharpe/Sortino and performance views), but not a full “portfolio lab” with Monte Carlo and deep optimization. The data makes that clear: it’s strong for portfolio visibility, while Stock Rover and Portfolio123 are built for portfolio analytics as a primary mission.
| Metric | Calculation | TradingView Score | High | Median | Low | Category Winner |
|---|---|---|---|---|---|---|
| Portfolio Health & Risk Analytics | Composite rating | 3.60 | 4.80 | 2.80 | 2.00 | Stock Rover |
| Health Check & Reporting Depth | % of critical financial metrics covered (risk/dividend/health/correlation) | 52/80 (65.0%) | 76/80 (95.0%) | 36/80 (45.0%) | 20/80 (25.0%) | Stock Rover |
- Critical metrics covered: 52/80 (65%)
Context: For most users, TradingView portfolios deliver good visibility: tracking, allocation views, and helpful risk metrics. Where it falls short is the deeper modeling layer (for example, native Monte Carlo), which is outside TradingView’s core mission.
Financial News Speed & Depth
TradingView scored B 3.00 (High: 5.00 | Median: 2.30 | Low: 0.0). It’s a research-friendly aggregator, not a breaking-news terminal.
I characterize TradingView’s news as “primarily an aggregator of RSS feeds”—useful for research context, but not designed for breaking-news execution where seconds matter. If your workflow depends on catalyst-speed reaction, Benzinga Pro, eSignal, Scanz, and especially MetaStock (with terminal-grade feeds) are structurally advantaged.
| Metric | Calculation | TradingView Score | High | Median | Low |
|---|---|---|---|---|---|
| Financial News Speed & Quality Rating | Weighted rubric (news scanning, chart plots, watchlist news, filtering, providers, alerts, <1m real-time) | 3.00 | 5.00 | 2.30 | 0.00 |
| News Delay vs Primary Wires | Seconds of delay vs Bloomberg/Reuters (range) | 60–300 s | < 1 s | 60–300 s | Hours/Days |
- Measured delay vs primary wires (as noted): ~60–300 seconds
Context: TradingView is fine for context, sentiment, and “what’s moving this symbol” research. If your strategy depends on being first to headlines, you will typically pair it with a dedicated real-time news provider.
Community Utility Index (CUI)
TradingView scored AAA 5.00 (High: 5.00 | Median: 3.25 | Low: 1.8). This is not cosmetic. TradingView’s community is a compounding advantage because it meaningfully expands what the platform can do.
I describe TradingView as the “global standard where a massive social network meets high-level open-source coding (Pine Script).” The scores reflect that it’s not just a big community—it produces reusable, monetizable logic (scripts/indicators/strategies) at scale.
| Metric | Calculation | TradingView Score | High | Median | Low |
|---|---|---|---|---|---|
| Community Utility Index | Average of Active Community Size & Quality of Community Contribution | 5.00 | 5.00 | 3.25 | 1.80 |
| Active Community Size | Rating scale for active users/community density | 5.00 | 5.00 | 3.00 | 2.00 |
| Quality of Community Contribution | Rating scale for quality of shared IP/code/research | 5.00 | 5.00 | 3.50 | 1.50 |
Context: The real value is that the community produces reusable IP: indicators, strategies, scanners, and workflows you can copy, test, and modify. Over time, that ecosystem can outperform “closed” platforms with technically strong features but weaker community momentum.
Support Infrastructure & SLA Audit
TradingView scored B 3.25 (High: 5.00 | Median: 3.75 | Low: 1.0). Support is functional, but not elite by enterprise standards.
I flag TradingView’s support posture as workable but not “SLA-grade”: there is a public status posture, but no explicit SLA/credits commitment, and response timing can be slower than platforms built around brokerage-style service expectations. If time-to-human is mission-critical, TC2000 and TOS are structurally better aligned with that requirement.
| Metric | Calculation | TradingView Score | High | Median | Low |
|---|---|---|---|---|---|
| Support SLA Audit: Time-to-Human Benchmarks | Avg of Support Communication Channels & Support Response Time scores | 3.25 | 5.00 | 3.75 | 1.00 |
| Support Communication Channels | Access scale (phone/chat/email/community) | 3.50 | 5.00 | 3.50 | 1.00 |
| Support Response Times | SLA scale (instant to best-effort) | 3.00 | 5.00 | 4.00 | 1.00 |
| Stated SLA & Tested Outcomes | Reported practical benchmark | 24 Hours | Instant / < 2 mins | Under 8–24 hours | 48–72+ hours |
- Communication channels: 3.50 (ticket-based support is effective, but not multi-channel mastery)
- Response times: 3.00 (noted: ~24 hours)
Context: If you require immediate human escalation (phone/live trading-desk style), TradingView’s model may feel light. For most independent traders, it’s workable—just not a category-leading support experience.