
Portfolio123 is not trying to be another fast charting app or news terminal. It is a systematic investing research platform built around screening, ranking, backtesting, portfolio construction, and portfolio management. In my lab testing, that positioning is clear: Portfolio123 scores 4.16 overall, slightly below the benchmark median of 4.21, but it performs exceptionally well in the categories that matter most to quantitative investors: Scanning Performance, Backtesting Performance, AI & Algo, and Portfolio Tool Performance.
Portfolio123 offers a unique and broad mix of technical and fundamental signals, plus powerful portfolio management tools.
The selection of financial ratios and a 10-year historical database provide ample data for developing your investing strategy, but they also have drawbacks.
Review Ratings & Verdict
My Portfolio123 testing highlights its solid stock screening, financial database, and easy integration for commission-free trading. Charting and usability can be improved, but it is good for dividend and growth investors. Value investors should consider Stock Rover a better alternative.
| Test | Tier | Score | Average |
|---|---|---|---|
| Composite Lab Performance Score (CLPS) | A | 4.16 | 4.21 |
| Pricing Index | $4.11/day | $2.74/day | |
| Value Score (VP) | C | 2.58 | 2.82 |
| Speed & Ease of Use | A | 4.25 | 4.50 |
| Chart Analysis Depth Index | C | 1.53 | 3.17 |
| Chart Pattern Depth & Accuracy | N/A | N/A | 2.73 |
| Scanning Performance | A | 4.00 | 3.38 |
| Backtesting Performance | AA | 4.45 | 3.38 |
| Trading Bot & Auto-Trading Reliability | C | 2.50 | 2.50 |
| AI & Algo Index | A | 4.00 | 2.00 |
| Alert Speed | B | 3.00 | 3.67 |
| Trade Signal Quality | C | 0.00 | 0.00 |
| Broker Connectivity & Ecosystem Depth | C | 1.10 | 2.00 |
| Portfolio Tool Performance | AAA | 4.80 | 2.80 |
| Financial News Speed & Depth | C | 0.00 | 2.80 |
| Community Utility Index (CUI) | B | 3.50 | 3.25 |
| Support Infrastructure & SLA Audit | B | 3.75 | 3.75 |
Portfolio123 covers stocks, fixed income, and ETFs on US and Canadian exchanges, so it is unsuitable for international stock investors. However, you can design a fully automated real-time trading strategy with a broker that will hold the stocks that pass your screen and sell those that don’t.
Tested with Trading Tools Benchmarks v.3 2026
See the 2026 v3 58-point TradingView test and benchmarks.
Pros
✔ 470+ Screening Metrics
✔ 10-Year Backtesting Engine
✔ Unique 10-Year Historical Data
✔ Pre-built Model Screeners
✔ 260 Financial Ratios
✔ Integrated $0 Trading
Cons
✘ No Integrated News
✘ No App for Android or iPhone
✘ Initially, Complex To Use
✘ Missing Fair Value & Margin of Safety Metrics
✘ Technical Analysis Charting Needs Improving
Key Features
| ⚡ Portfolio 123 Features ? | Screening, Research |
| 🏆 Exceptional Features ? | Trading, Backtesting |
| 🎯 Best for | Experienced Investors |
| ♲ Subscription | Monthly, Yearly |
| 💰 Price | $0 | $83 |
| 💻 OS | Web Browser |
| 🎮 Trial | 21 Days for $9 |
| ✂ Discount | None |
| 🌎 Region | USA/Canada |
Compare to Similar Products
Portfolio 123 leads for fundamental portfolio backtesting and management. Stock Rover is better for price, research reports, news, and value investing. While products like TrendSpider and TradingView have investing features, they are more focused on trading features, like AI pattern recognition and technical scanning.
Features? | Portfolio123 | Stock Rover | TrendSpider | MetaStock |
| Rating ? | 4.16 | 4.37 | 4.72 | 4.42 |
| Best for: | Investors | Investors | Traders | Traders |
| Free Plan | ✔ | ✔ | ✘ | ✘ |
| Pricing? | $0 | $83 | $0 | $29 | $49 | $54 | $214 | $75|$100|$265 |
| Financial Screening? | ✔ | ✔ | ✔ | ✔ |
| 10-Year Financials | ✔ | ✔ | ✘ | ✘ |
| Portfolio Management? | ✔ | ✔ | ✘ | ✘ |
| Research Reports | ✘ | ✔ | ✘ | ✘ |
| Chart Pattern Scanning? | ✘ | ✘ | ✔ | ✘ |
| AI Stock Screening? | ✘ | ✘ | ✔ | ✔ |
| Financial News? | ✘ | ✔ | ✔ | ✔ |
| Stocks & ETFs | ✔ | ✔ | ✔ | ✔ |
| FX/Commodity | ✘ | ✘ | ✔ | ✔ |
| USA & Canada | ✔ | ✔ | ✔ | ✔ |
| Global Market Data | ✘ | ✘ | ✘ | ✔ |
Pricing
Portfolio123 pricing starts at $0 for the Free plan, Screener costs $25/mo, and Pro costs $83/mo. You can use Portfolio123 for free; however, the real power of Portfolio123 is unlocked with the Screener and Pro services. Their Screener and Pro service pricing is in line with the competition and competitive considering the benefits on offer.
Free
Portfolio123’s Free plan allows ad-free broker integration for trading with Tradier or Interactive Brokers. It is ideal for investors seeking fundamental charting, an earnings calendar, and a consolidated view of multiple brokerage accounts.
Screener Plan
Portfolio123’s Screener plan costs $25/mo and provides access to the entire financial database and five years of historical company financials. This plan includes screening all stocks and ETFs with 460+ financial, technical, and sentiment metrics.
Pro Plan
Portfolio123 Pro costs $83/mo and provides highly granular system development with specific buy-and-sell rules, rolling backtesting, and 20 years of backtesting data. I would only recommend this for the most hardcore stock strategy developer.
I strongly recommend the Portfolio123 Screener Plan for $25 per month unless you are a demanding trading system developer.
Platform
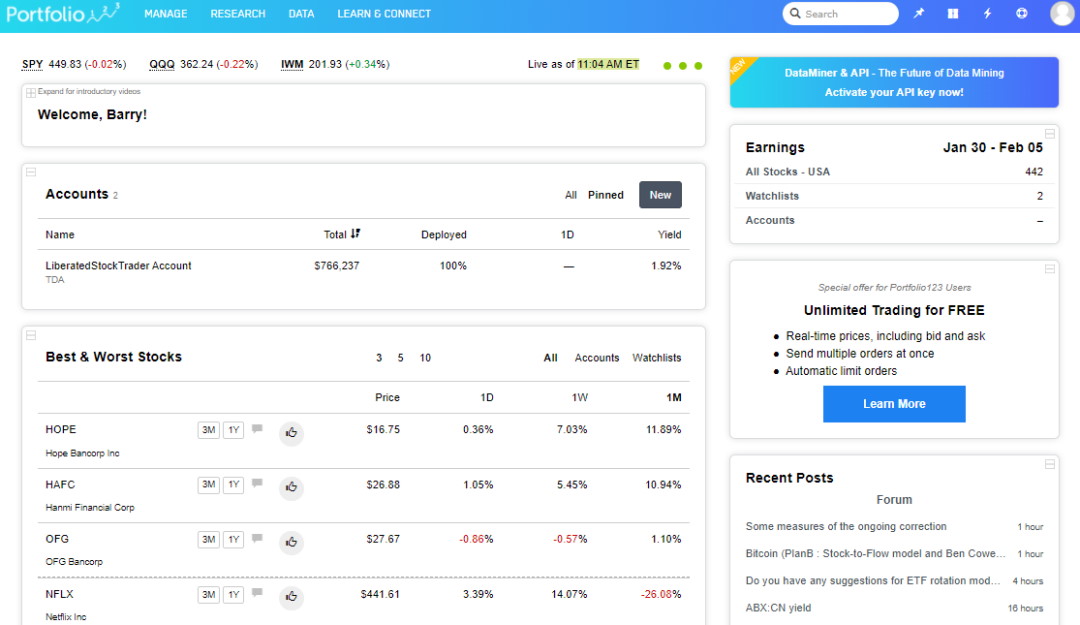
Portfolio123 runs on PCs, Macs, Tablets, and Smartphones and requires zero installation; it simply works. The market data, scoring, ranking, and analysis are only for the USA & Canadian markets. When you register with Portfolio123 and log in, you are greeted with the dashboard, which gives you an instant market performance breakdown but, more importantly, shows you your portfolio performance.
Apps & Downloads
Portfolio123 is a modern cloud-based software architecture, meaning that there is no client software to download and install. All stock exchange data resides on the vendor’s cloud servers. The charting and visualization are also stored and computed in the cloud, and any chart you want to visualize is streamed to your client device.
Currently, Portfolio123 does not have a specific Android or Apple app. It is best accessed on a PC, Mac, or Tablet.
Portfolio Features
With Portfolio123, you get tight broker integration with Tradier and Interactive Brokers. You cannot place trades from charts, but you can automate trading based on rules or execute bulk trades; plus, Portfolio123 will handle profit & loss reporting.
| Portfolio123 Portfolio Features | Portfolio123 |
| Watchlist Tracking | ✓ |
| Research | ✓ |
| Profit & Loss Reporting | ✓ |
| Performance Reporting | ✓ |
| Portfolio Rebalancing | ✓ |
| Portfolio Asset Allocation | ✓ |
| Broker Integration | ✓ |
| Future Dividend Reporting | X |
Screener
The Portfolio123 screener lets you filter 10,000+ stocks and 44,000 ETFs to find investments or trades that match your exact criteria. Portfolio123 also offers ranked screening, which lets you rank stocks that best match your criteria, narrowing a list of hundreds of stocks to a handful. You can also define your custom universes by setting the macro criteria that determine which stocks are included in the sample.
Over 225 data points will cover most of your fundamental ideas. Portfolio123 has 460 criteria, including analyst revisions, estimates, and technical data.
You can also use Portfolio123 to screen stocks on their performance relative to the S&P500 or any other benchmark. You could develop a strategy to select stocks based on their historical performance versus the market.
After decades of testing and comparing software, I have found that Portfolio 123 is the only platform that supports the Sortino and Sharpe ratios. These ratios are key to professional portfolios and investment risk management.
The number of factors available for screening is impressive. You can screen based on reliable information from a company’s financial reports, access technical factors, create your own factors using period and announcement dates, eliminate stocks with high bid-ask spreads, limit your screen to stocks in a certain industry or sector, rank factors against other stocks in an industry or sector, and change your factor balance depending on economic conditions.
Here is a very complex screening strategy I developed using Portfolio123; as you can see, it is extremely powerful and flexible, with almost limitless rules and conditions.
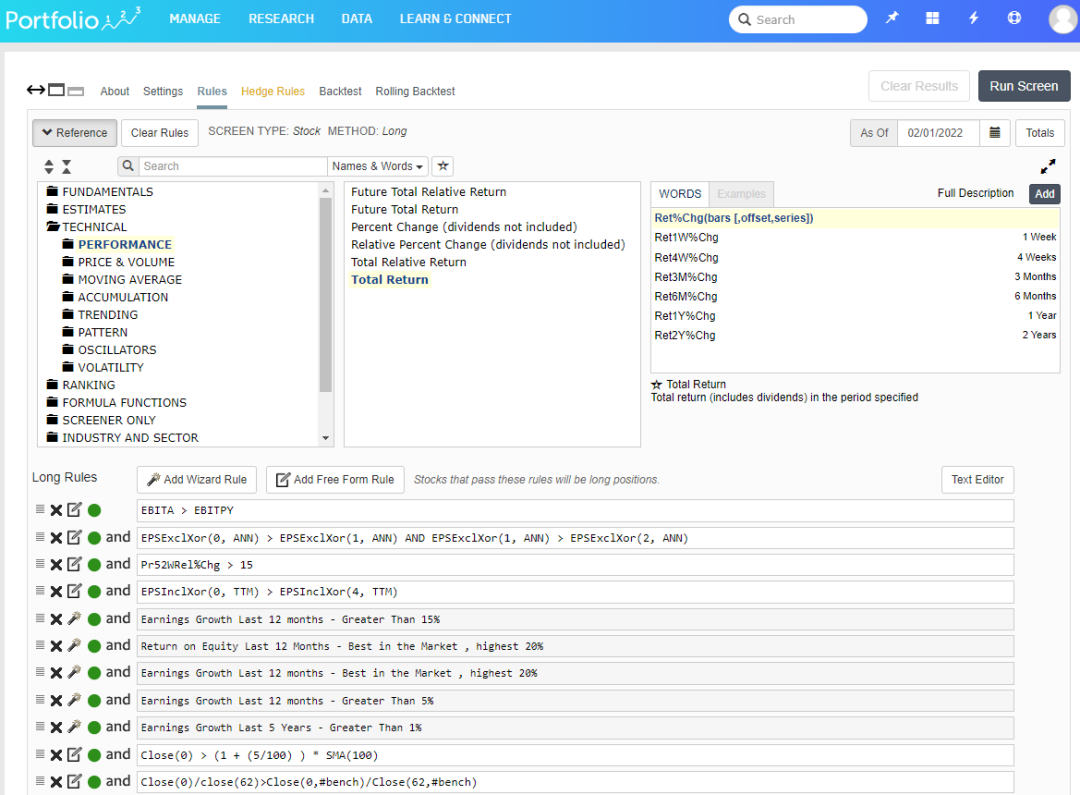
Building your Portfolio123 screener is theoretically easy: select Research -> Screens, and you can start playing. No programming skills are required to build a Portfolio123 screener, but basic coding will certainly help. If you want to create more powerful screening rules, you must study the coding logic and understand the names of the proprietary criteria.
Pre-Built Screeners
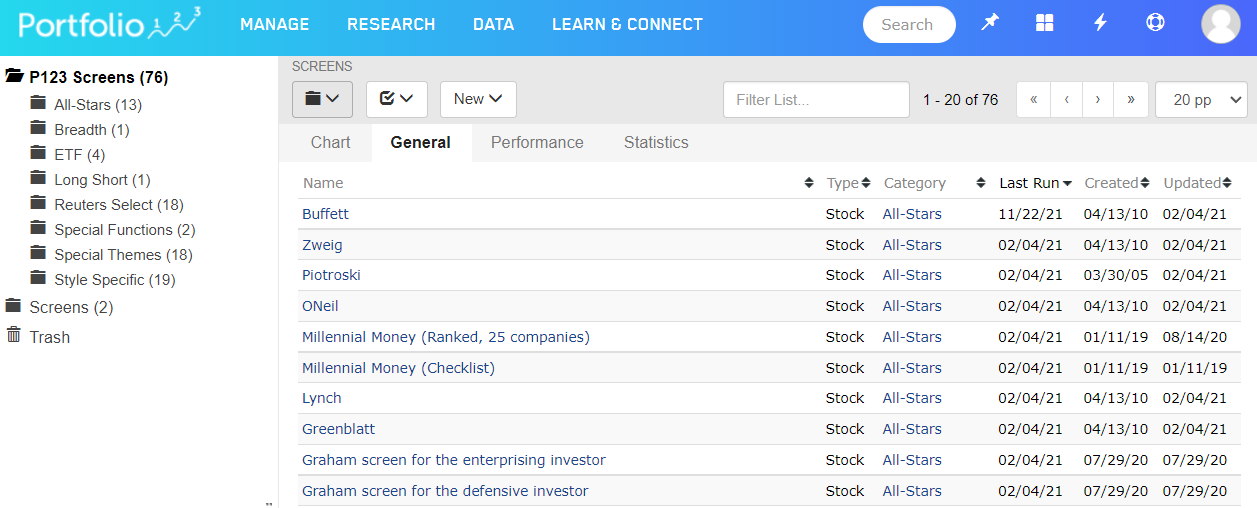
Portfolio123 has over 76 pre-built screeners that you can import and use. To take advantage of this, you need the Screener subscription plan service. I have personally reviewed many of them, and they are very thoughtfully built. One of my favorites is the “Small Cap Winners” screener.
The Small-Cap Winner strategy had a 5-year return of 189% versus the Russell 2000 return of 58%, very impressive.
The Small-Cap Winner strategy “attempts to balance growth, value, quality, and sentiment factors, using ones that have worked well for small-cap stocks. It has high turnover as it relies greatly on the most recent quarterly earnings announcements and, via sentiment ranking, analyst estimates and recommendations”.
Backtesting
Portfolio123’s backtesting engine is where the software shines. Expertly implemented, fast, and extremely configurable, Portfolio123 has the best backtesting service for people serious about testing fundamental strategies.
Portfolio123 enables you to be very granular when setting up your backtest, including entry rules, slippage, weighting, rebalancing frequency, and custom timeframes.
The Portfolio123 screener is built to enable users to test not just pre-built concepts but also all sorts of hypotheses. You can use your own universe, rank with your multi-factor rank, and run backtests or rolling backtests.
The Portfolio123 screener relies on high-quality data, and they have been working hard to overcome pitfalls in financial data, such as N/A values in sparse preliminary reports. Our pre-built factors handle N/A values efficiently and use alternative algorithms to produce the best possible results. Great data isn’t an overnight project; they’ve been working on data since 2004.
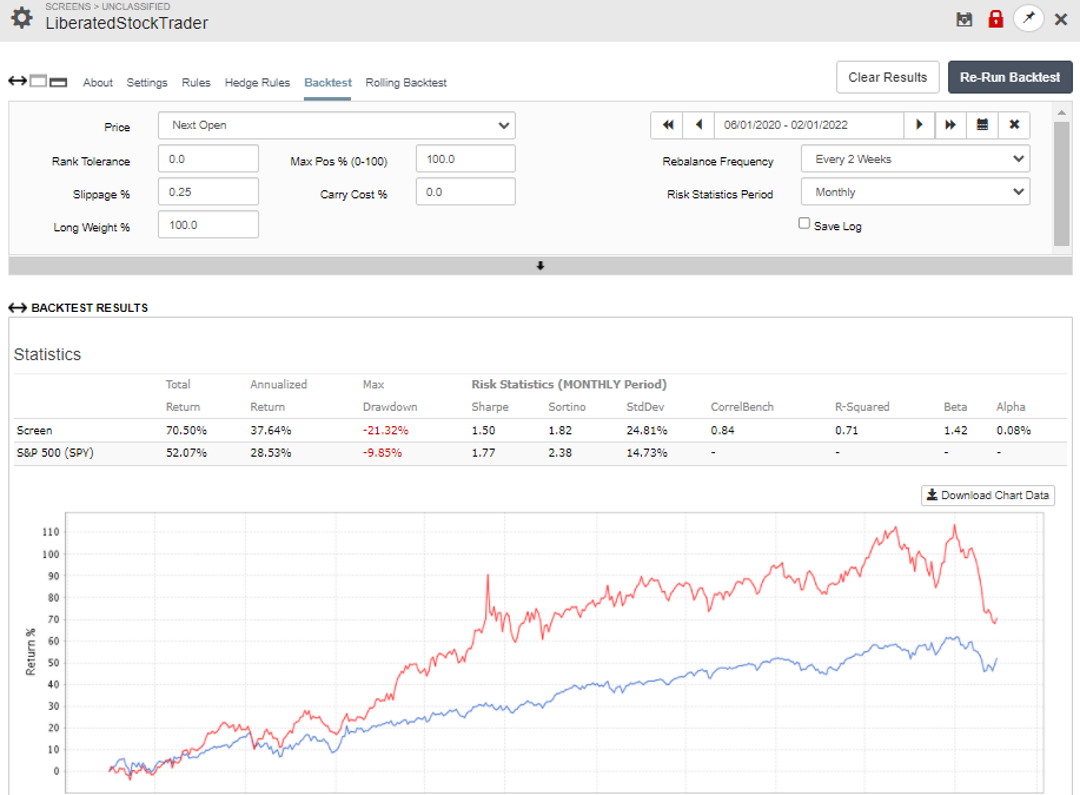
The image below shows the LiberatedStockTrader screener I developed in the previous section. I backtested the screener over two years to assess its historical performance. My screener beat the market over this timeframe, returning 70.5% versus the S&P 500’s 52%.
News & Community
Portfolio123 has a news tab for your watchlist that primarily provides news from Yahoo Finance. While this is nice because the news is filtered on your watchlist constituents, it is not a full news service. In terms of community, there is a basic old-school forum for asking questions and reporting problems, but this is not comparable to TradingView’s powerful social network.
As a long-term investor, real-time news is not a priority. If real-time news is your priority, you can subscribe to Benzinga Pro News separately. Finally, there is no perceivable service within Portfolio123 for social chat and idea sharing.
Stock Charting
Looking at stock charts with Portfolio123, one can see that it differs from all the other software vendors on the market. Whereas MetaStock and TradingView focus on hundreds of technical analysis (price/volume) indicators, Portfolio123 focuses on charting the fundamental financial strength indicators.
With over 160 financial indicators and only two technical analysis indicators, Portfolio123 is not the best technical analysis or frequent-trading charting service. Still, it is the complete package for fundamental income, growth, and value investors. However, Portfolio123 does not allow you to draw trendlines or annotate charts.
The one redeeming factor in Portfolio123’s charting is the Multi Charts, which enable you to plot and compare over 108 economic indicators, such as:
- SP500 Shiller Dividend
- SP500 Shiller Earning
- SP500 Yield
- CPI All Urban Consumers: All Items
- Gold Price in London Bullion Market, USD
- S&P Case-Shiller 20-City Home Price Index
- 3-Month Interbank Rate (CHF)
- BofA Merrill Lynch US Corporate AAA Effective Yield©
- BofA Merrill Lynch US High Yield B Effective Yield©
- Delinquency Rate On Credit Card Loans, All Commercial Banks
- Delinquency Rate On Single-Family Residential Mortgages
- 3-Month Interbank Rate (EUR)
- Effective Federal Funds Rate
Is Portfolio123 Easy to Use?
Portfolio123 is relatively easy to use but not easy to master. You will need time to understand the layout and create powerful screening strategies. While the pre-built screeners help with ease of use, you must invest time to create anything truly customized. Additionally, the charting is limited and unintuitive, slowing you down.
Summary
Portfolio123 is an excellent screening and backtesting platform for swing traders and medium-term growth investors. Its incredible selection of fundamental criteria, 20-year financial database, and powerful financial backtesting engine make it a great choice for experienced stock system developers.
