If you need international real-time financial news, fast data, and technical charts, MetaStock is worth trying.
My MetaStock audit and benchmark testing rate it 4.42 for its powerful charting, backtesting, forecasting, and global real-time financial news.
It has unbeatable charts, indicators, and drawing tools, and with MetaStock 20, it’s even easier to use.
Composite Lab Performance Score
MetaStock scores 4.42, above the Median competitor (4.21) and close to the top of the field. Importantly, MetaStock doesn’t earn that score by being “broadly average.” It earns it by being exceptionally strong in a few high-impact categories—especially chart depth, pattern accuracy, backtesting fidelity, and news speed.
| Metric | What It Measures | Calculation | MetaStock | High | Median | Low |
|---|---|---|---|---|---|---|
| Composite Lab Performance Score (CLPS) | Overall benchmark outcome | Avg of all ratings + 5× superpower boost | 4.42 | 4.75 | 4.21 | 2.93 |
| Composite Lab Performance Score (CLPS) Overall Test Winners | TradingView 4.75 | TrendSpider 4.72 | Trade Ideas 4.52 |
Review Ratings & Verdict
My MetaStock testing highlights it as a robust trading platform. It offers over 300 charts and indicators for global markets, including stocks, ETFs, bonds, and Forex. MetaStock R/T excels with its advanced backtesting and forecasting features, alongside real-time news updates and efficient screening tools.
| Test | Tier | Score | Average |
|---|---|---|---|
| Lab Test Composite Score | AA | 4.42 | 4.21 |
| Pricing Index: $/day | A | $8.71 | $2.74 |
| Value Score (VP) | B | 3.26 | 2.82 |
| Speed & Ease of Use | B | 3.33 | 4.50 |
| Chart Analysis Depth Index | AAA | 4.83 | 3.17 |
| Chart Pattern Depth & Accuracy | B | 3.70 | 2.73 |
| Scanning Performance | B | 3.71 | 3.38 |
| Backtesting Performance | AAA | 4.81 | 3.38 |
| Trading Bot & Auto-Trading Reliability | C | 2.50 | 2.50 |
| AI & Algo Index | C | 2.50 | 2.00 |
| Alert Speed | B | 3.67 | 3.67 |
| Trade Signal Quality | C | 2.50 | 0.00 |
| Broker Connectivity & Ecosystem Depth | C | 1.67 | 2.00 |
| Portfolio Tool Performance | C | 2.60 | 2.80 |
| Financial News Speed & Depth | AAA | 5.00 | 2.30 |
| Community Utility Index (CUI) | B | 3.25 | 3.25 |
| Support Infrastructure & SLA Audit | A | 4.00 | 3.75 |
Tested using benchmarking system v3.
See the 2026 v3 58-point MetaStock test and benchmarks.
Pros
✔ Great Selection of Automated Expert Advisors
✔ Excellent Deep Backtesting
✔ Unique Stock Price Forecasting
✔ Large Library of Add-on Professional Strategies
✔ AAA Charts & Indicators
✔ AAA Institutional Real-Time News
✔ Xenith Add-On Rivals Bloomberg Terminals
✔ Works Online & Offline
Cons
✘ Takes Time To Learn
✘ Old School Windows App Design
✘ Too Many Add-ons

MetaStock is best for traders who need excellent real-time news, exceptional technical analysis, a vast stock systems marketplace with global data coverage, and excellent customer service.
However, the full Metastock suite costs $ 265 per month. It rivals the Bloomberg terminal in functionality but lacks the new AI trading features of TrendSpider and Trade Ideas, such as AI Bot trading and advanced pattern recognition.
Key Features
| ⚡ Features? | Charts, Watchlists, Scanning, Backtesting |
| 🏆 Unique Features? | Algorithmic AI Forecasting, Real-time Global Trading News (Multi-language), Pattern Recognition with Add-ons. |
| 🎯 Best for | Stock, FX & Commodity Traders |
| ♲ Subscription | Monthly, Yearly |
| 💰 Price | $100 | $265 |
| 💻 OS | PC |
| ✂ Discount | 3 for 1 Deal Worth $530 |
| 🌎 Region | Global |


What is MetaStock?
MetaStock is a stock market technical analysis and charting service with over 300 chart types and indicators. MetaStock D/C provides end-of-day exchange data, and MetaStock R/T adds real-time intraday Refinitiv data. The Xenith add-on provides global real-time news and fundamental financial screening.
Pricing Index
MetaStock’s Pricing Index score is $8.71/day, well above the median of $2.74 and close to the maximum of $9.99 of all tools tested. The reason is straightforward: MetaStock’s cost structure reflects its professional-grade positioning and depth of real-time data and newsfeed, which raise the effective monthly cost and cost-per-feature compared to most retail platforms.
| Metric | What It Measures | Calculation | MetaStock | High | Median | Low |
|---|---|---|---|---|---|---|
| Pricing Index | Daily cost baseline | $/day on annual plan (min viable + data) | $8.71 | $9.99 | $2.74 | $0.74 |
| $ per feature | Cost efficiency | Effective Monthly Cost / Total Features | $20.38 | $28.92 | $4.29 | $0.00 |
| Effective Monthly Cost (EMC) | True monthly cost | Plan + data + required add-ons/month | $265.00 | $303.87 | $83.32 | $22.50 |
MetaStock pricing is $59/m for MetaStock D/C daily charts, which provide 15-minute delayed data and full technical analysis services.
MetaStock D/C is a good, cost-effective option for traders performing chart analysis and backtesting. Demanding traders will opt for MetaStock R/T because it is a powerful real-time charting solution.
MetaStock R/T costs $100/m and adds real-time data to charts, but you will need the Xenith add-on, which costs an extra $165/m for real-time news and powerful global fundamental screening. So, the effective monthly cost (EMC) is $265/month for real-time data, news, and fundamentals powered by Refinitiv, the gold standard of international financial data. This option is the closest product to a Bloomberg terminal, yet it costs 1/10th of the price.
Metastock provides a 30-day free trial for new customers, which can save up to $250.
MetaStock is not free, and there is no free service tier for customers. However, a free 30-day trial of MetaStock R/T is possible.
Value Score (VP)
Value Score (VP) answers a different question than price: how structurally good the product is for what it offers. It weighs Feature Quality (60%), Feature Depth (30%), and Device Support (10%). This is important because many platforms have long feature lists, but the value comes from whether those features are reliable, deep, and usable in repeatable workflows.
MetaStock scores 3.26 versus a Median of 2.82. That indicates MetaStock delivers meaningful product value—just not cost efficiency. In other words, it’s a strong tool, but not a “value bargain.”
| Metric | What It Measures | Calculation | MetaStock | High | Median | Low |
|---|---|---|---|---|---|---|
| Value Score (VP) | Overall product value | 60% Quality + 30% Depth + 10% Device | 3.26 | 4.37 | 2.82 | 1.70 |
| Value Rank | Relative standing | Percentile ranking | 3.50 | 5.00 | 2.50 | 1.00 |
| Feature Quality | Reliability and polish | Avg of feature-quality ratings | 3.43 | 4.16 | 2.97 | 2.00 |
| Feature Breadth | Coverage of core features | Count of meaningful core features | 13 | 17 | 12 | 9 |
| Feature Depth | Depth vs competitors | Percentile ranking | 3.00 | 4.75 | 3.00 | 1.00 |
| Device Support Depth | Cross-device usability | Web/PC/iOS/Android points | 3.00 | 5.00 | 2.00 | 1.00 |
| Value Score Test Winners | TradingView 4.37 | TrendSpider 4.20 | Trade Ideas 4.05 |
MetaStock is designed for the PC but can be run on a Mac with PC emulation software. You must download and install MetaStock and configure your specific data feeds for the markets you want to trade. So, the software installation isn’t as slick or quick as competitors’.
Metastock is different from other vendors because its software runs locally on your PC. You can buy one-off licenses and avoid monthly payments. They also operate a marketplace where professional traders sell their stock trading systems and signals as add-ons to MetaStock.
Is MetaStock Worth It?
Yes, MetaStock is worth buying if you need real-time news, the broadest selection of stock charts and indicators, and innovative stock backtesting and forecasting technology for all international markets.
My recommendation for any investor or trader is to go for MetaStock R/T + Xenith. Together, they offer a staggering depth of fundamental research and news, and MetaStock offers industry-leading in-depth analysis, backtesting, and forecasting.
Fear not if $265 per month for the MetaStock R/T Xenith Package is too much. If you want the end-of-day data and all the MetaStock functionality, the price starts at a reasonable $59 per month. You can even buy one-off lifetime licenses if you prefer.
MetaStock is also worth it if you want to develop your own backtested stock system or purchase a tested strategy from the marketplace.
Speed & Ease of Use
Speed & Ease of Use is a trader’s “friction tax” score. It measures how long it takes to open a decision-ready chart, how smoothly multiple charts sync, and whether common tasks stay within a minimal-click workflow. This matters because speed isn’t about comfort—it’s about missed entries, delayed confirmations, and reduced discipline under pressure.
MetaStock scores 3.33, below the Median (4.25). The key driver is startup/time-to-chart, not multi-chart latency. Once running, MetaStock can behave like a serious workstation, but getting to that “ready” state is slower than web-first competitors.
| Metric | What It Measures | Calculation | MetaStock | High | Median | Low |
|---|---|---|---|---|---|---|
| Speed & Use Index Rating | Practical speed/usability | Avg of time-to-chart, multichart, 3-click | 3.33 | 5.00 | 4.25 | 2.60 |
| Time to Chart Speed (Seconds) | Time to usable chart | Click → loaded chart + indicators | 17.03s | 17.03s | 4.70s | 1.60s |
| Time to Chart Performance | Speed points | Threshold scoring | 3.00 | 5.00 | 4.50 | 3.00 |
| Multi-Chart Latency (ms) | Multi-chart sync delay | Delay syncing 4 charts | 667ms | 667ms | 209ms | 10ms |
| Multimonitor Chart Speed | Latency points | Threshold scoring | 2.00 | 5.00 | 3.50 | 0.00 |
| 3-Click Rule Test | Workflow friction | Clicks to trade/launch scan | 3 | 6 | 3 | 2 |
| 3 Click Rule: Ease of Use | Friction score | Penalty beyond 3 clicks | 5.00 | 5.00 | 4.50 | 2.00 |
| Speed & Ease of Use Test Winners | TradingView 5.00 | Stock Rover 5.00 | Seeking Alpha 5.00 |
MetaStock passes the 3-click test, but lags on speed.
Is MetaStock Easy to Use?
No, MetaStock is not easy to use because it feels like a collection of separately developed applications requiring user education to work together. However, the vast selection of automated “expert advisors” you can deploy on the range of stocks in your purview makes MetaStock well worth learning.
Chart Analysis Depth Index
Chart Analysis Depth measures whether the platform can support advanced technical work without forcing compromises: chart variety, indicator depth, and extensibility via custom logic. The reason it matters is simple: your analysis style evolves. A shallow tool eventually forces you to simplify—or switch.
MetaStock scores 4.83, materially above the Median (3.17) and near the ceiling of the benchmark set. This is one of MetaStock’s signature strengths: deep indicator coverage and custom logic support suitable for serious technical workflows.
| Metric | What It Measures | Calculation | MetaStock | High | Median | Low |
|---|---|---|---|---|---|---|
| Chart Analysis Depth Index | Overall charting depth | Avg chart + indicators + coding | 4.83 | 5.00 | 3.17 | 0.50 |
| Chart Types | Chart variety | Total count | 15 | 38 | 10 | 1 |
| Chart Depth | Chart variety score | 0.3 points per chart | 4.50 | 5.00 | 3.00 | 0.30 |
| Indicators | Built-in indicators | Total count | 300 | 400 | 116 | 0 |
| Indicator Depth | Indicator score | 0.025 points per indicator | 5.00 | 5.00 | 2.90 | 0.00 |
| Custom Indicator Coding | Extendability | Available = 5 points | 5.00 | 5.00 | 2.50 | 0.00 |
| Chart Analysis Depth Index Test Winners | TradingView 5.00 | MetaStock 5.00 | Optuma 5.00 |
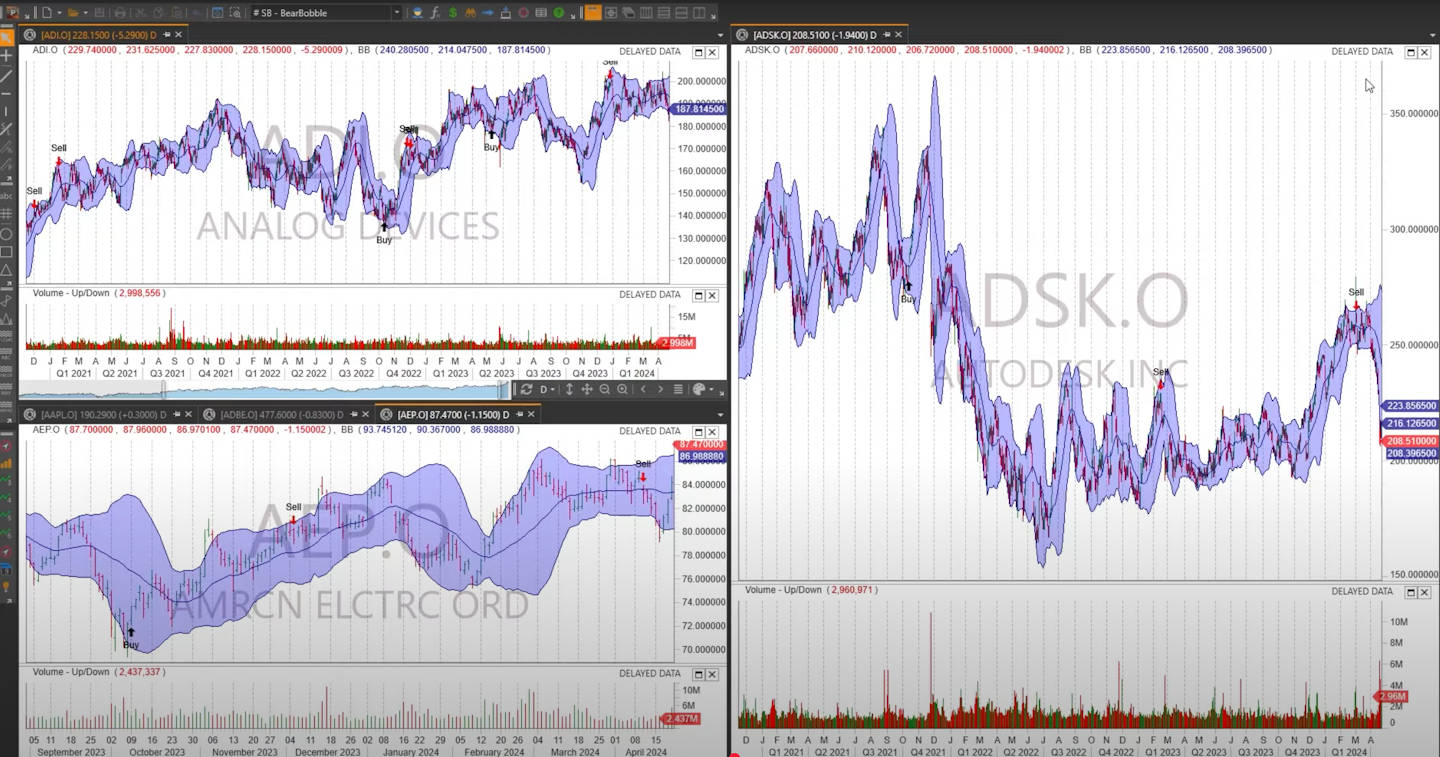
MetaStock is the industry leader in pure technical chart analysis. It has over 300 price and volume indicators, including Darvas Box, Gann, Fibonacci, and Ichimoku Cloud. Charting includes all core chart types, as well as Point & Figure, Equivolume, and Market Profile.
You can develop indicators based on their coding system or ask MetaStock for help. MetaStock is one of the biggest fish in the sea of stock market analysis software. It is partnered with Thomson Reuters/Refinitiv, so you can expect excellent, fast global data coverage.
Chart Pattern Depth & Accuracy
Pattern engines only help if they do two things: (1) cover enough meaningful patterns, and (2) stay accurate enough that traders trust them. Too many platforms either under-deliver on breadth (so the feature is irrelevant) or over-trigger (so it becomes noise).
MetaStock scores 3.70, above the Median (2.73). The balance is what stands out: a meaningful pattern library, strong trend/price pattern coverage, and high accuracy. This is the kind of pattern stack you use to confirm and filter, not just to “hunt.”
| Metric | What It Measures | Calculation | MetaStock | High | Median | Low |
|---|---|---|---|---|---|---|
| Pattern Recognition Efficacy & Accuracy | Pattern automation utility | Avg depth + accuracy points | 3.70 | 4.88 | 2.73 | 0.00 |
| Total Patterns | Pattern breadth | Count of patterns recognized | 80 | 226 | 57.5 | 0 |
| Pattern Recognition Depth | Breadth score | 0.33 points per pattern | 2.64 | 5.00 | 1.90 | 0.00 |
| Candle Patterns Recognized | Candlestick set | Count | 30 | 172 | 20 | 0 |
| Chart Price & Trend Patterns Recognized | Trend/price patterns | Count | 50 | 54 | 16 | 0 |
| Accuracy | Correctness | Percent accurate | 95% | 95% | 89% | 0% |
| Pattern Recognition Accuracy | Accuracy points | 0.05 per % accurate | 4.75 | 4.75 | 4.48 | 0.00 |
| Chart Pattern Recognition & Accuracy Test Winners | TrendSpider 4.88 | Trade Ideas 4.62 | TradingView 3.98 |
MetaStock provides automatic Candlestick recognition from version 20, so you will get the add-on “Greg Morris’ Japanese Candle Recognition” for free. Greg Morris is seen as one of the global authorities on Japanese Candlestick trading and has been published on the topic.
This add-on gives you a sophisticated trading system with full candlestick backtesting, analysis, and signals. It forecasts the direction of the next move in stock price and the probability of the Candlestick signal’s success.
The probability rating of the Candlestick recognition success is absolutely critical, and no other software offers this level of professional Candlestick trading system.
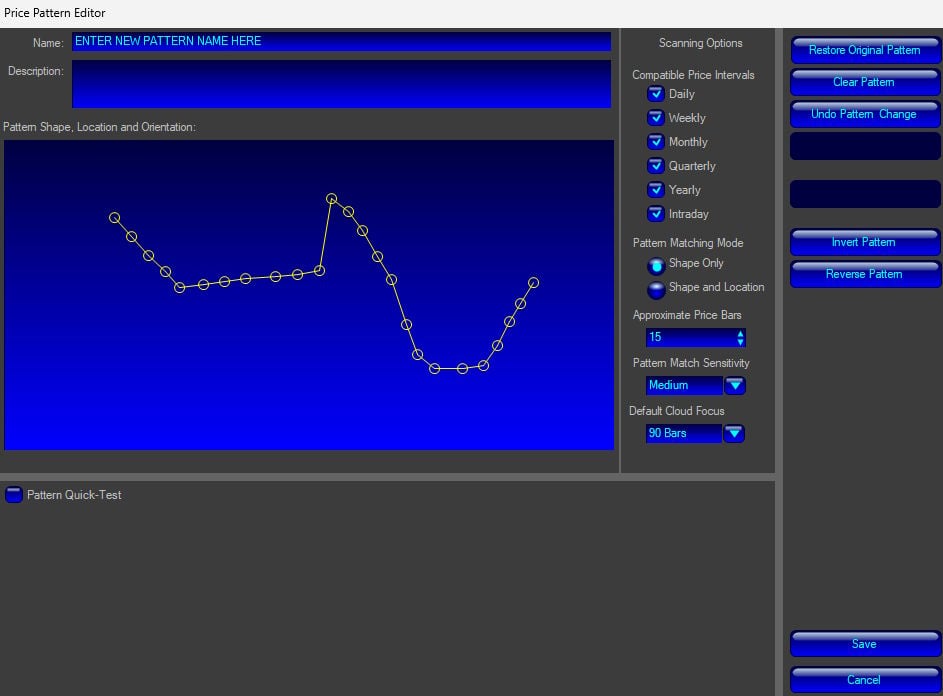
In the image below, this signal (highlighted in yellow) predicts a 77% chance of success.
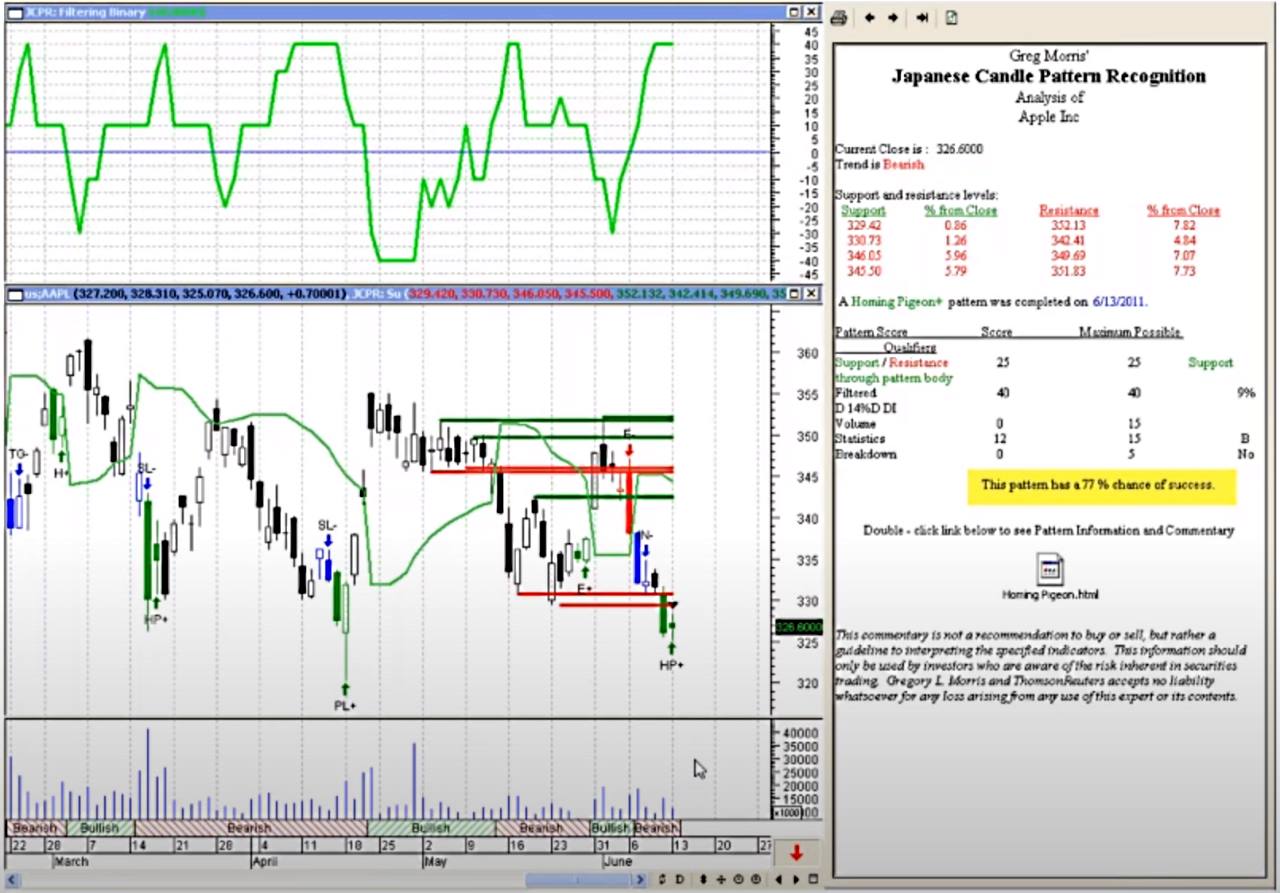
You get forecasting of the direction of the next move in stock price and also the probability of the Candlestick signal being successful
Scanning Performance
Scanning is where many traders either gain leverage or waste time. The benchmark measures raw scan speed, the expressiveness of the scan criteria set, and whether you can code custom scan logic. This matters because the scanner is often your opportunity engine: it determines what you see and how fast you see it.
MetaStock scores 3.71, above the Median (3.38). The nuance is important: scanning can be acceptable, but it depends heavily on the data setup. My audit notes highlight a stark difference between online data (slow) and locally stored data (materially faster).
| Metric | What It Measures | Calculation | MetaStock | High | Median | Low |
|---|---|---|---|---|---|---|
| Market Scanning Latency & Depth | Overall scanning capability | Avg speed + criteria + code | 3.71 | 5.00 | 3.38 | 0.80 |
| Scanner Performance (ms) | Raw scan time | S&P 500 across 5 criteria | 1434ms | 2500ms | 300ms | 7ms |
| Scanning Speed (Points) | Speed score | Threshold scoring | 3.00 | 5.00 | 4.00 | 1.00 |
| Scanning Criteria Count | Strategy expressiveness | Total criteria fields | 251 | 675 | 200 | 30 |
| Scanning Criteria & Depth (Points) | Criteria score | 0.0125 points per criterion | 3.14 | 5.00 | 2.50 | 0.80 |
| Custom Code Scanning | Programmability | Exists = 5 points | 5.00 | 5.00 | 5.00 | 0.00 |
| Scanning Performance Test Winners | Stock Rover 5.00 | TradingView 4.83 | TrendSpider 4.67 |
For the best market scanning and screening, you must have MetaStock R/T, including MetaStock’s Xenith platform. Xenith integrates real-time data from Refinitiv, real-time news from Reuters, and global financials to provide the most powerful scanning and screening available to retail investors.
MetaStock R/T has an incredible database of global fundamental data, covering not just companies but also countries, economies, and industries. The filtering and scanning possibilities are endless.
I want better integration between MetaStock and the Xenith software, which combines fundamentals and technical analysis to enable better charting and technical analysis on fundamentals. However, the wealth of data is first-class.
Using Xenith, you can see an in-depth analysis of company fundamentals, from debt structure to the top ten investors, including level II market liquidity. Watchlists featuring fundamentals and powerful market scanning are outstanding.
Backtesting Performance
Backtesting Performance measures whether a tool can turn strategy ideas into tested evidence: raw speed, zero-code testing availability, coded flexibility, reporting depth, and multi-stock testing. This matters because confidence in a strategy is rarely emotional—it’s usually statistical.
MetaStock scores 4.81, comfortably above the Median (3.38) and close to the top of the field. The standout is speed: MetaStock’s benchmark backtest time is extremely fast, which changes how you work. Faster testing means you iterate more—and iteration is how strategies improve.
| Metric | What It Measures | Calculation | MetaStock | High | Median | Low |
|---|---|---|---|---|---|---|
| Quantitative Backtesting Fidelity | Overall backtesting depth | Avg of 5 sub-scores | 4.81 | 4.90 | 3.38 | 0.00 |
| Backtesting Speed (ms) | Raw simulation speed | 10y daily / 2m 5-min | 51ms | 6000ms | 302ms | 7ms |
| Backtesting Speed (Points) | Speed points | Threshold scoring | 5.00 | 5.00 | 4.25 | 0.00 |
| No Coding Required | No-code testing | 5 points if yes | 0.00 | 5.00 | 5.00 | 0.00 |
| Flexible Coding Backtesting | Coded testing | Exists = 5 points | 5.00 | 5.00 | 5.00 | 0.00 |
| Backtesting Report Quality (Percent) | Reporting completeness | % reporting criteria covered | 85% | 100% | 70% | 0% |
| Backtesting Report Quality (Points) | Reporting depth score | 0.05 points per 1% | 4.25 | 5.00 | 2.25 | 0.00 |
| Multi-Stock Basket Backtesting | Portfolio simulation | Exists = 5 points | 5.00 | 5.00 | 5.00 | 0.00 |
| Backtesting Performance Test Winners | Optuma 4.94 | TrendSpider 4.88 | MetaStock 4.81 |
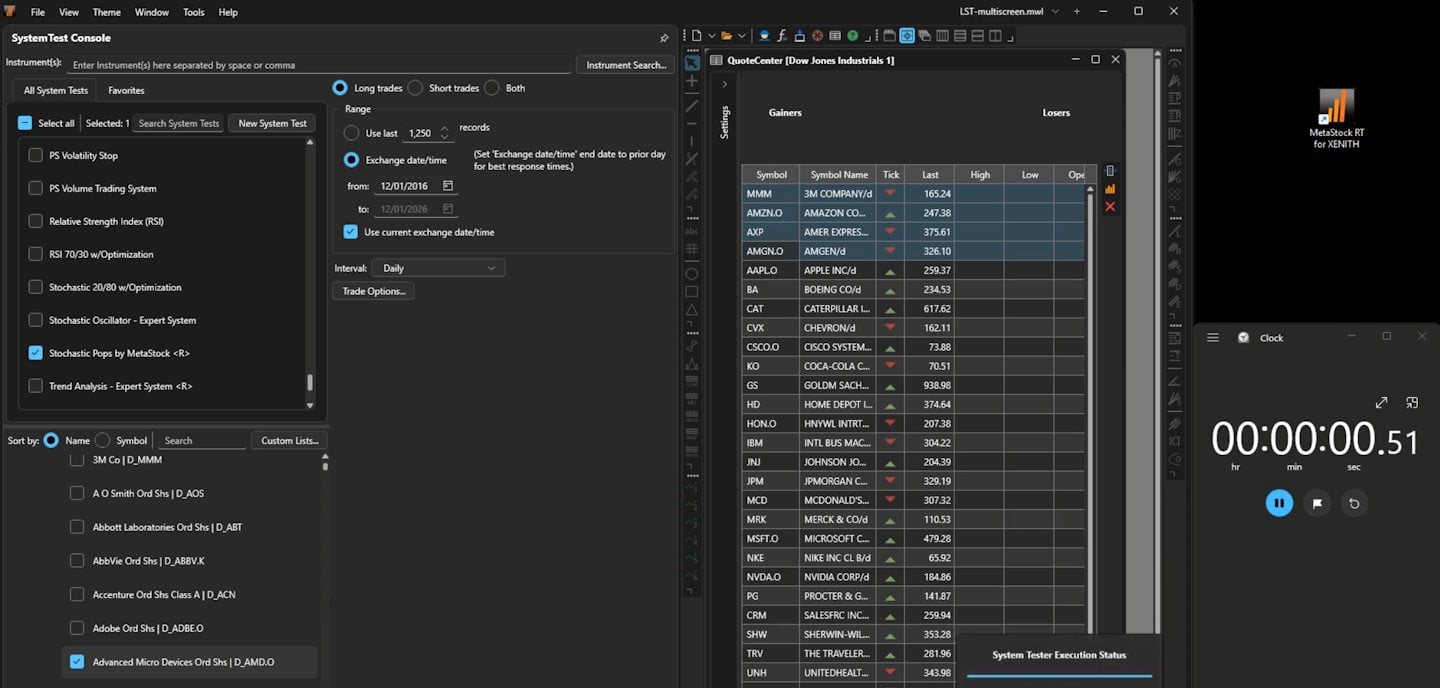
MetaStock harnesses “Expert Advisors,” built-in systems to help you understand and profit from technical analysis patterns and well-researched systems. Expert advisors are stock market trading strategies that generate trading signals.
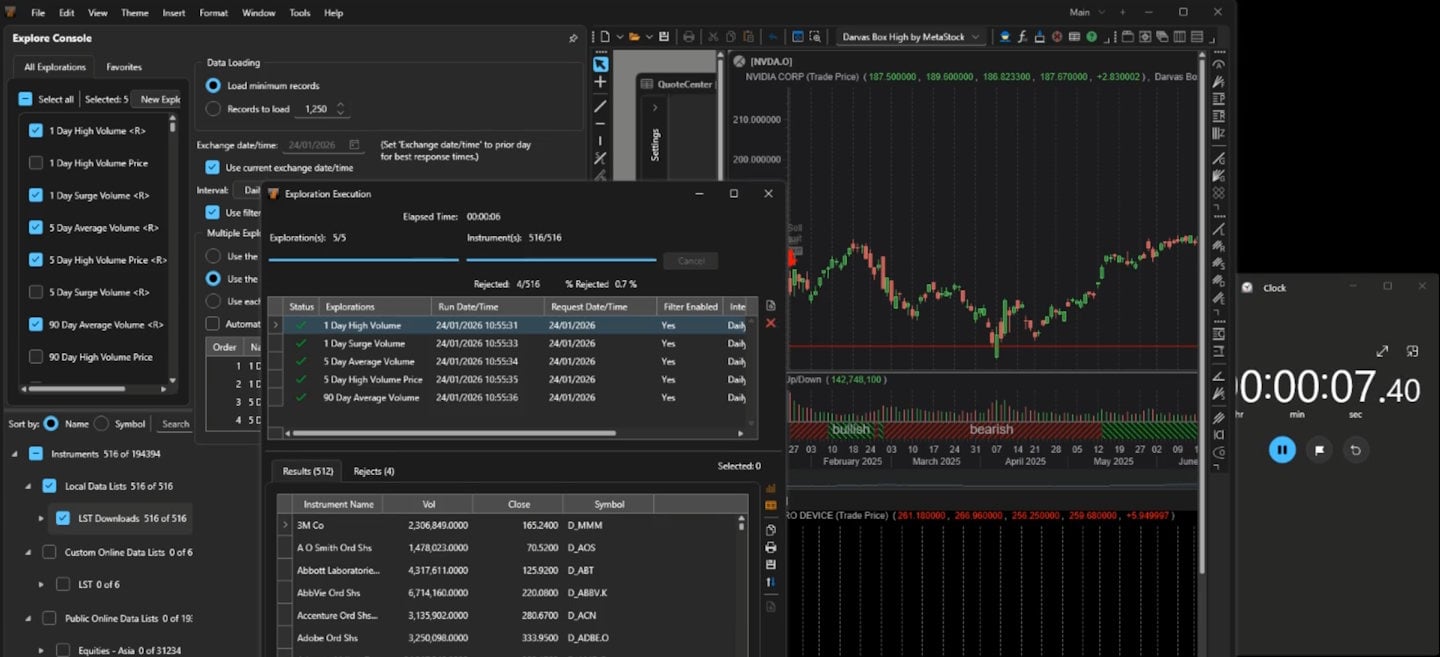
When you launch MetaStock, you will see the power console. Select System Test to access 58 systems you can backtest. In the example below, I selected the MACD Expert System and ran it on the entire Nasdaq 100.
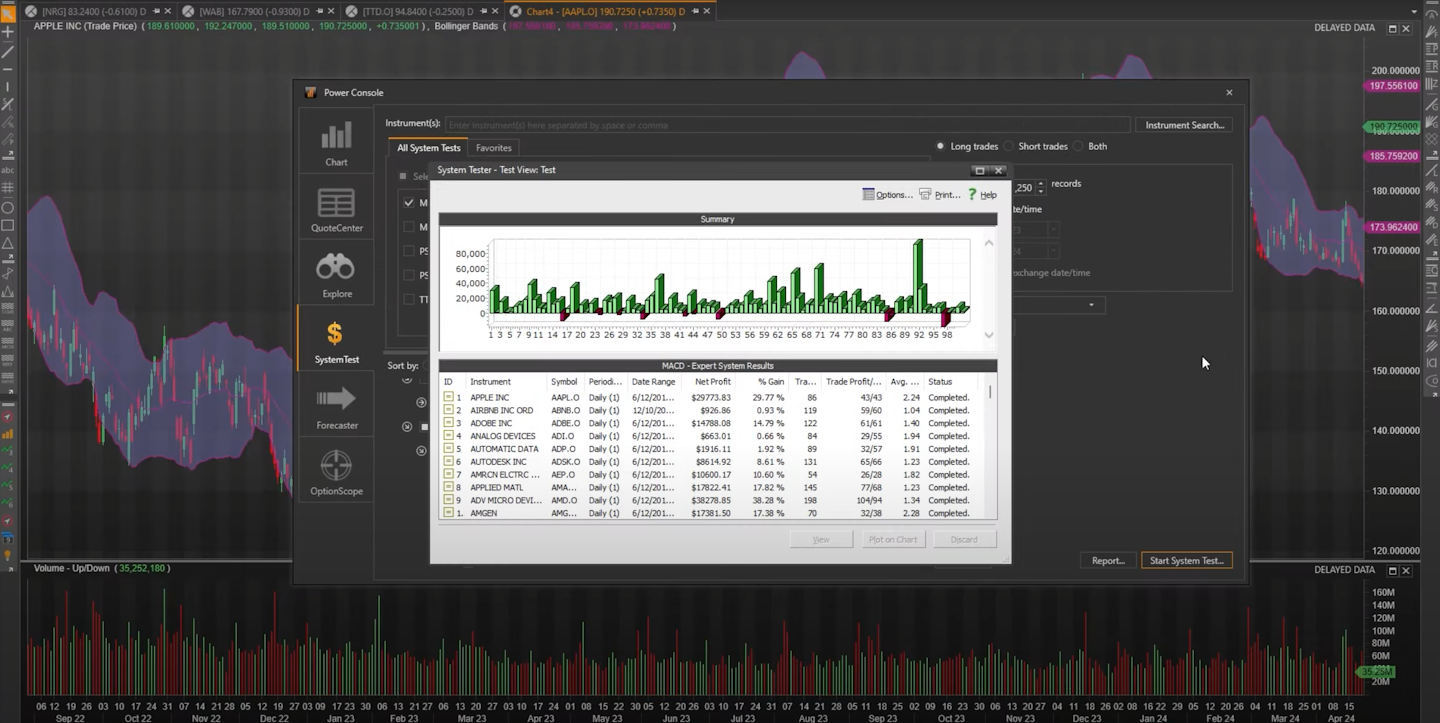
After 60 seconds, the backtest completed and presented me with a list of every buy or sell trade and, of course, the strategy’s capital drawdown. You can click through any trade to see the trade background, size, duration, and profit or loss.
Of course, the inbuilt systems will not make you super-rich; you want to backtest and develop your own winning system to get an edge in the market. With some scripting or programming skills, you will achieve this with MetaStock. If you do not have programming skills, you can ask MetaStock or one of the many MetaStock Partners to assist you in building your system.
Many premium MetaStock stock trading systems are also sold by their partners and are usually backed by training and webinars to support their clients.
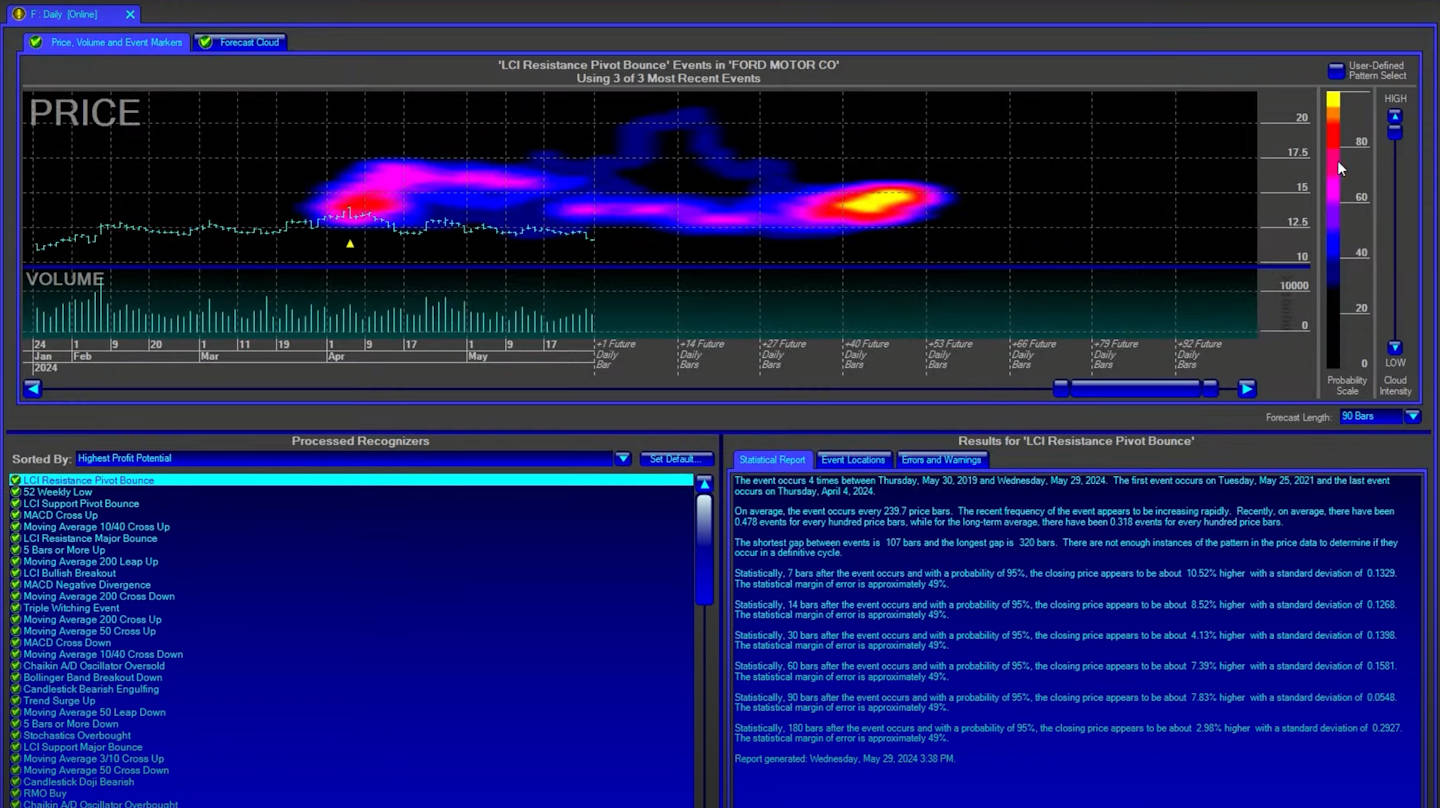
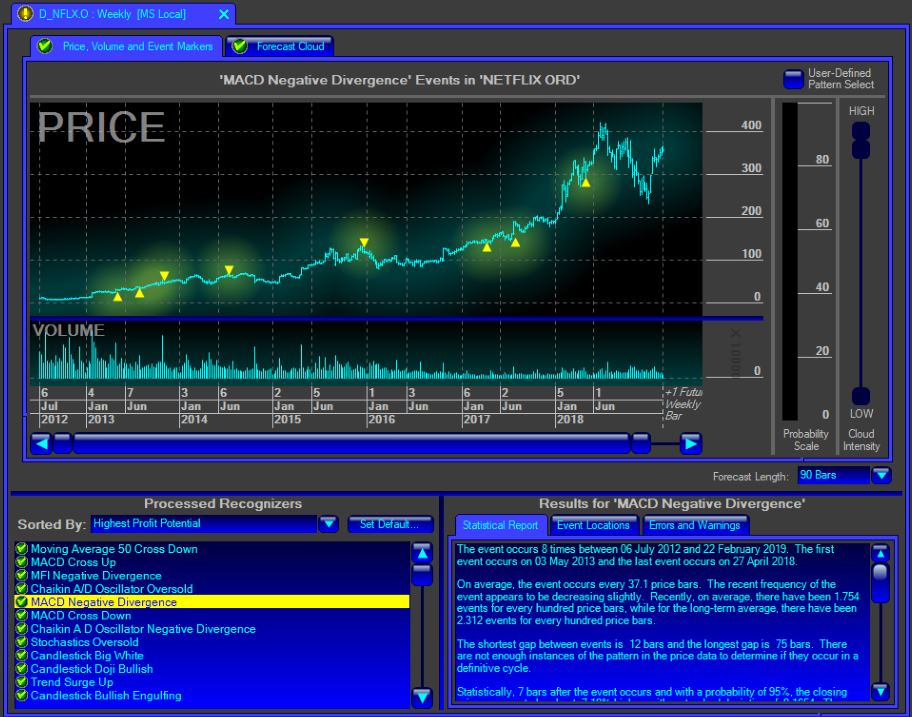
MetaStock Forecaster
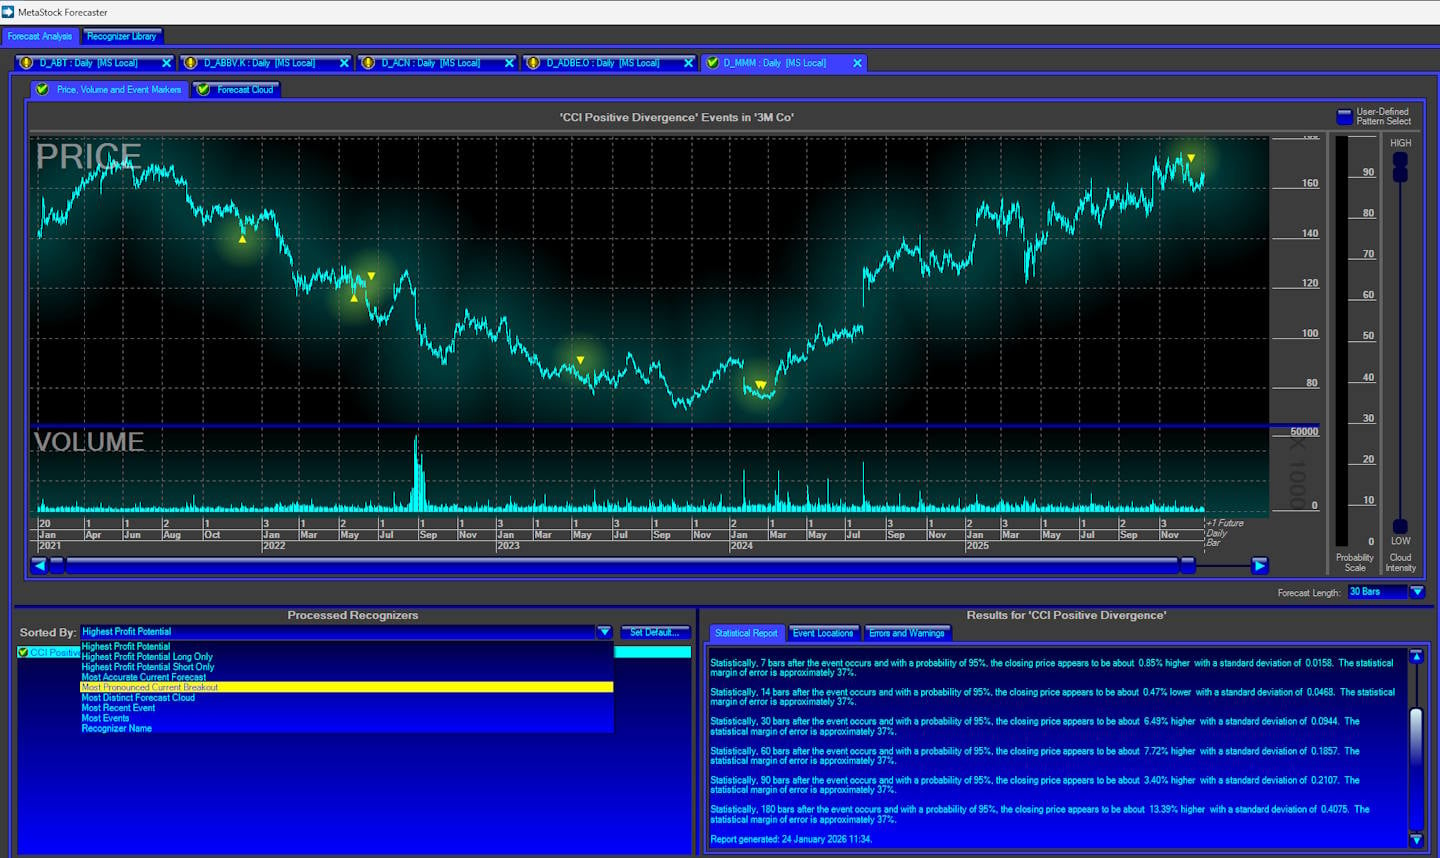
The MetaStock Forecaster is unique in the industry because it lets you use hundreds of strategies to predict future stock prices. The forecaster analyzes past events and their impact on the stock price, and forecasts future events.
The most significant addition to MetaStock’s arsenal is the forecasting functionality, which sets it apart from the competition.
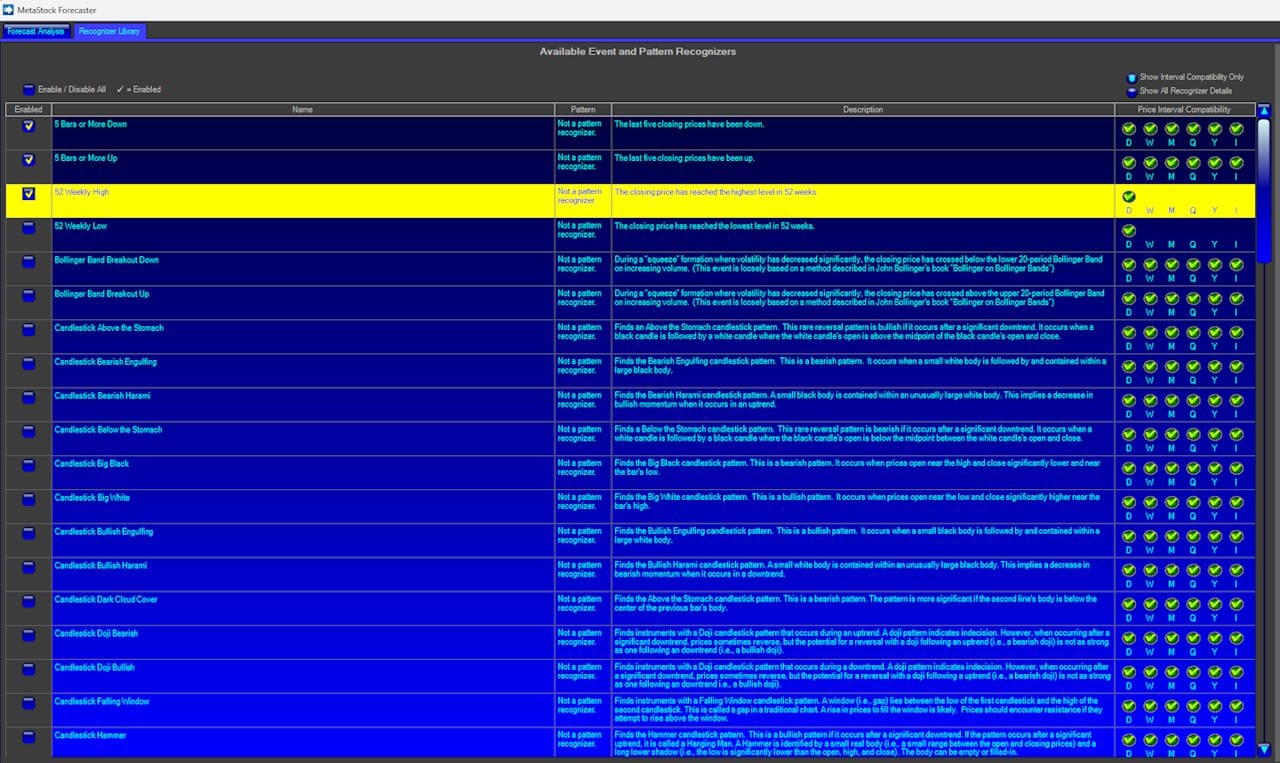
The forecaster strategies are called recognizers, and there are over 70 available. Recognizers are based on common technical chart setups, such as new 52-week highs or lows, candlestick patterns, or MACD crossovers.
You are then presented with an interactive report that lets you scan the many predictive recognizers. These help you plan for realistic outcomes and profits for a particular trade setup. Watch this video to understand the MetaStock Forecaster better.
You can even use artificial intelligence-like functionality to test a set of variables within your backtesting. For example, you could test if the price moves above the moving average of 10, 14, or 20 in a single test to see which moving averages work best with that stock.
MetaStock is one of the few vendors that takes forecasting seriously. System backtesting is excellent because it allows you to test whether a theory, idea, or set of analyses has worked in the past. Forecasting takes it to a whole new level by playing forward the backtesting to see how successful you might be with a strategy under certain circumstances. The configurable nature of the backtesting and forecasting reporting is excellent.
Forex forecasting based on sentiment is an exceptional feature. The forecasting functionality is MetaStock’s most significant advantage, setting it apart from the crowd.
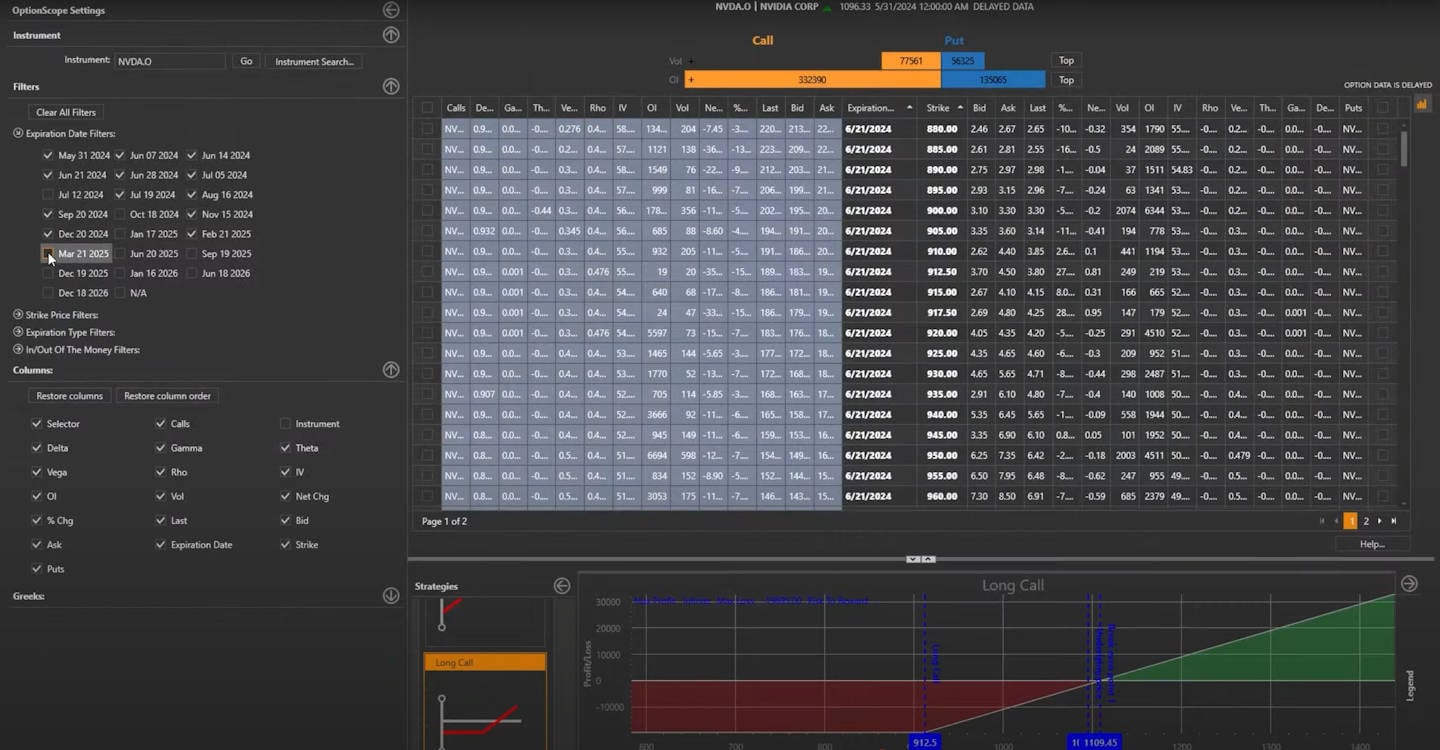
MetaStock’s new version 20 brings upgrades to OptionScope and Power Console, along with two free trading systems and the Greg Morris Candle pattern recognition add-on. It also now includes Performance Systems Plus, the top-selling system, at no cost, as well as the Daryl Guppy ATR indicators.
Trading Bot & Auto-Trading Reliability
This category measures automation reality, not automation hype: how you actually go from signal to execution, how sophisticated the logic layer is, and whether the vendor demonstrates operational assurance (SLA/credits, incident posture). This matters because automation without reliability creates a different kind of risk: execution errors.
MetaStock scores 2.50, right at the Median (2.50). The reason it doesn’t go higher is not lack of logic—it’s the absence of a modern execution pathway (native broker-linked automation, webhook-driven bot stacks, and published operational guarantees).
| Metric | What It Measures | Calculation | MetaStock | High | Median | Low |
|---|---|---|---|---|---|---|
| Automated Execution & Bot Reliability | Automation readiness | Sum of 3 sub-metrics | 2.50 | 4.50 | 2.50 | 0.00 |
| Automation Path | How automation is executed | 0–2 rubric | 1.0 | 2.0 | 1.0 | 0.0 |
| Strategy/Bot Sophistication | Logic depth | 0–2 rubric | 1.5 | 2.0 | 1.5 | 0.0 |
| Operational Assurance | Reliability posture | 0–1 rubric | 0.0 | 1.0 | 0.0 | 0.0 |
| Bot & Auto-Trading Reliability Test Winners | TrendSpider 4.50 | Trade Ideas 4.00 | Tickeron 4.00 |
MetaStock Add-Ons
MetaStock Add-ons are specific trading systems for day, swing, and trend trading of stocks, ETFs, FX, and Options. Over 90 add-ons are designed to help traders make better trading decisions, so whatever your trading style, there is a strategy for you. MetaStock version 18 also includes the powerful Performance Systems Plus, their best-selling system ever, at no extra cost.
AI & Algo Index
AI & Algo Index distinguishes algorithmic depth (rules, models, backtests), the presence of a true AI layer, and transparency. This matters because “AI” claims are common; what traders need is repeatable value and explainability.
MetaStock scores 2.50, above the Median (2.00), largely due to strong algorithmic depth and transparency, while the AI layer itself is not a core feature in the benchmark sense.
| Metric | What It Measures | Calculation | MetaStock | High | Median | Low |
|---|---|---|---|---|---|---|
| Algorithmic Intelligence & AI Tier Index | Overall AI/algo tier | Algo depth + AI + transparency | 2.50 | 5.00 | 2.00 | 1.00 |
| Algo Depth | Strategy/model depth | 0–2 rubric | 1.5 | 2.0 | 1.5 | 1.0 |
| AI Layer | AI presence | 0–2 rubric | 0.0 | 2.0 | 0.0 | 0.0 |
| Transparency | Explainability | 0–1 rubric | 1.0 | 1.0 | 1.0 | 0.0 |
| AI & Algo Index Test Winners | TrendSpider 5.00 | Trade Ideas 4.50 | Tickeron 4.50 |
Alert Speed
Alerts compress attention and reduce screen fatigue. The benchmark evaluates alert capacity, delivery-path richness, and speed posture. This matters most when alerts become your workflow backbone—when you rely on them for entries, exits, and risk management.
MetaStock scores 3.67, matching the Median (3.67). The headline is “capability with ambiguity”: MetaStock has strong alerting potential, but the modern published limits and delivery depth are less standardized than alert-first platforms.
| Metric | What It Measures | Calculation | MetaStock | High | Median | Low |
|---|---|---|---|---|---|---|
| Alert Trigger Latency & Delivery Speed | Overall alert utility | Avg of 3 scores | 3.67 | 4.67 | 3.67 | 2.30 |
| Concurrent Alerts | Capacity score | 1 point per 50 (max 5) | 5.00 | 5.00 | 5.00 | 5.00 |
| Concurrent Alert Count | Raw capacity | Count / Unlimited | Unlimited | 2000 | 875 | 400 |
| Alert Streams Richness | Delivery breadth | 1 point per stream (max 5) | 2.00 | 5.00 | 2.00 | 1.00 |
| Alert Speed Rating | Practical speed | 0–5 rating | 4.00 | 5.00 | 3.00 | 1.00 |
| Alert Speed Test Winners | TradingView 4.67 | TrendSpider 4.33 | Benzinga Pro 4.33 |
Broker Connectivity & Ecosystem Depth
This category measures whether you can execute trades directly, how many brokers are integrated, and how broad the platform’s market/data coverage is. This matters because execution friction is real: even great analysis loses value if it cannot translate into efficient action.
MetaStock scores 1.67, below the Median (2.00). The reason is structural: MetaStock is not positioned as a broker-integrated execution platform. It can still have broad data coverage, but execution remains external.
| Metric | What It Measures | Calculation | MetaStock | High | Median | Low |
|---|---|---|---|---|---|---|
| Asset & Data Coverage Index | Overall connectivity | Avg of live trading, broker integration, coverage | 1.67 | 5.00 | 2.00 | 0.67 |
| Live Trading | Can execute trades | 5 points if yes | 0.00 | 5.00 | 5.00 | 0.00 |
| Total number of brokers integrated | Broker breadth | Raw count | 0 | 1200 | 2 | 0 |
| Broker Integration | Broker depth score | 0.1 point per broker (max 5) | 0.00 | 5.00 | 0.20 | 0.00 |
| Asset & Data Coverage | Market breadth | Stocks/Options/FX/US/Intl | 5.00 | 5.00 | 2.00 | 2.00 |
| Broker Connectivity & Ecosystem Test Winners | TradingView 5.00 | MetaTrader 5.00 | TrendSpider 4.43 |
MetaStock is broker-agnostic, meaning it does not provide broker integration, trade execution from charts, or live, integrated profit-and-loss analysis. You will need to enter your trades into a broker’s platform independently.
Still, the package is powerful because it lets you configure multiple data providers, including your broker.
MetaStock covers all stock exchanges and all asset classes: Stocks, ETFs, Mutual Funds, Options, Futures, Forex, and Bonds.
MetaStock can improve by integrating with brokers. The company excels at developing stock trading systems that generate signals and deliver powerful technical analysis.
Intraday & Real-time Data
The MetaStock R/T (Real-time) software includes intraday data for $150 monthly. If you want real-time news and data, plus fundamental data, you must purchase Xenith, which costs $165 monthly.
MetaStock forex data costs $99 per month, but you can save money with the worldwide futures, commodities, & derivatives data package for $75 per month.
If you do not need real-time data, MetaStock D/C (Delay Charts) software will save you a lot of money, costing only $59 monthly.
Financial News Speed & Depth
News is only “useful” if it arrives fast enough and is filterable enough to act on. The benchmark score rewards real-time alerting, breadth of sources, filtering controls, and practical integration into trading workflows.
MetaStock scores 5.00, far above the Median (2.30) and at the ceiling. This is one of MetaStock’s clearest category wins: it is built to support traders who care about professional news flow.
| Metric | What It Measures | Calculation | MetaStock | High | Median | Low |
|---|---|---|---|---|---|---|
| Financial News Speed & Quality Rating | News trading utility | Weighted rubric | 5.00 | 5.00 | 2.30 | 0.00 |
| Delay vs primary wires | Raw speed range | App vs Bloomberg/Reuters feeds | < 1s | < 1s | 60s–300s | Hours/Days |
| Financial News Speed & Depth Test Winners | MetaStock 5.00 | Benzinga Pro 5.00 | Scanz 5.00 |
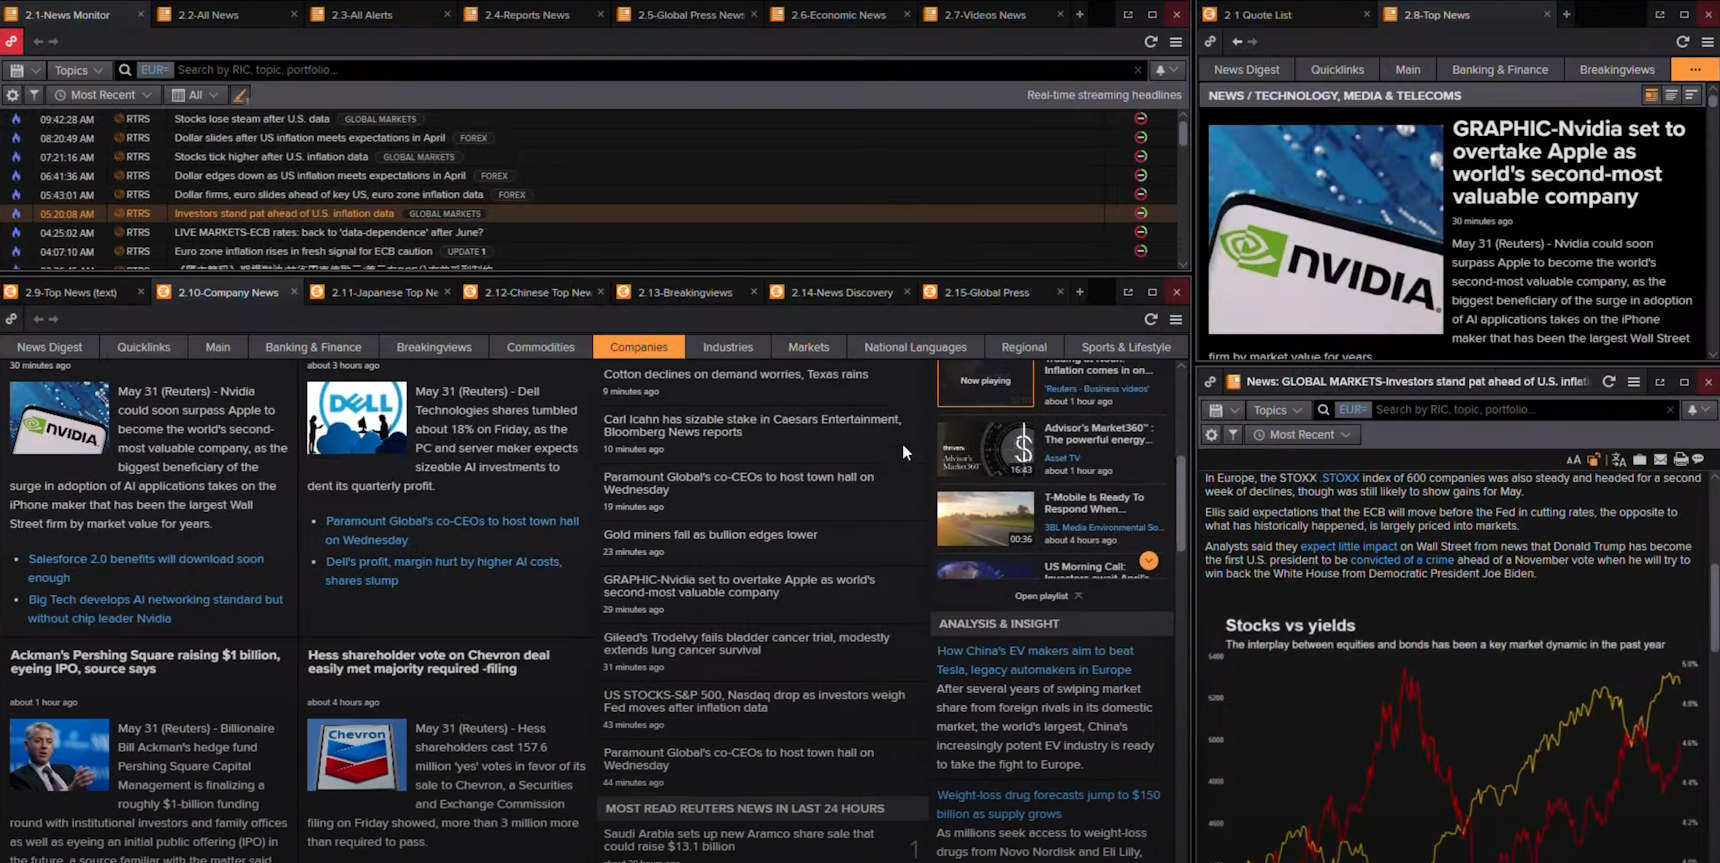
MetaStock R/T + Xenith has full Refinitiv integration, providing institutional-level news, analysis, and outlook. This is the fastest global news service available, including translations into all major languages.
Reuters is also the world’s largest news agency and provides TV news coverage through smartphone and smart TV applications. The package includes Reuters Insider alerts, exclusive content, and research provided by expert analysts on the financial network team.
In the image above, you see Xenith streaming the news screen for Netflix. Look at the screenshot below, the attention to detail, and the amount of original news from the Reuters Network; you will get this news before anyone else.
It includes detailed company financial snapshots, stock quotes, charts, analyst estimates, a full listing of financial details and SEC filings, and upcoming events, so you are prepared for action.
Included are stocks, options, bonds, futures, FX, and macroeconomic news and data—an unparalleled source of information.
Community Utility Index (CUI)
CUI measures whether a community produces usable “alpha” resources: strategies, code, scanners, workflows, and high-signal discussion. This matters because good communities accelerate learning and reduce time-to-competence.
MetaStock scores 3.25, matching the Median (3.25). The community is present and useful, but it is not the kind of massive, always-on ecosystem that social charting or broker megaplatforms produce.
| Metric | What It Measures | Calculation | MetaStock | High | Median | Low |
|---|---|---|---|---|---|---|
| Community Utility Index | Overall community value | Avg size + contribution | 3.25 | 5.00 | 3.25 | 1.80 |
| Active Community Size | Crowd density | 0–5 scale | 3.00 | 5.00 | 3.00 | 2.00 |
| Quality of Community Contribution | Practical IP quality | 0–5 scale | 3.50 | 5.00 | 3.50 | 1.50 |
| Community Utility Index Test Winners | TradingView 5.00 | MetaTrader 5.00 | Trade Ideas 4.75 |
Support Infrastructure & SLA Audit
Support is operational risk management. This benchmark scores how quickly you can reach a human and how strong the communication channels are. This matters most when the platform is part of a daily trading workflow, because downtime or unresolved issues can translate into real trading losses.
MetaStock scores 4.00, above the Median (3.75). It’s not the benchmark leader, but it’s strong and credible—especially for a professional platform.
| Metric | What It Measures | Calculation | MetaStock | High | Median | Low |
|---|---|---|---|---|---|---|
| Support SLA Audit: Time-to-Human Benchmarks | Overall support posture | Avg channels + response | 4.00 | 5.00 | 3.75 | 1.00 |
| Support Communication Channels | Access scale | 0–5 rubric | 4.00 | 5.00 | 3.50 | 1.00 |
| Support Response Times | Time-to-human | 0–5 rubric | 4.00 | 5.00 | 4.00 | 1.00 |
| Stated SLA & Tested Outcomes | Real-world outcome | Raw stated/tested | 5–10 Minutes | – | – | – |
| Support Infrastructure & SLA Audit Winners | TrendSpider 5.00 | TC2000 5.00 | ThinkorSwim 4.75 |
Compare to Similar Products
Comparing MetaStock with TrendSpider, TradingView, and Trade Ideas, our tests show that it ranks fourth, passing 8 of 11 tests. For automated stock chart analysis, backtesting, and automated bot trading, TrendSpider is better.
Stock Rover is better than TradingView for long-term growth, dividends, and value investors. For AI-driven robotic day trading, Trade Ideas is better. For trading real-time news, Benzinga Pro is a better alternative.
| Features? ✔★ = Best-in-class. | TrendSpider | TradingView | Trade Ideas | MetaStock |
| Rating | 4.8 | 4.7 | 4.6 | 4.5 |
| Pricing | $54 | $214 | $0 | $15 | $35 | $70 | $89 | $178 | $100 | $265 |
| Global Market Data | USA | ✔ | USA | ✔ |
| Powerful Charts | ✔★ | ✔★ | ❌ | ✔★ |
| Stocks | ✔ | ✔ | ✔ | ✔ |
| Futures | ✔ | ✔ | ❌ | ✔ |
| Forex | ✔ | ✔ | ❌ | ✔ |
| Cryptocurrency | ✔ | ✔ | ❌ | ✔ |
| Social Community | ❌ | ✔★ | ✔ | ❌ |
| Real-time News | ❌ | ❌ | ❌ | ✔★ |
| Screeners | ✔★ | ✔ | ✔★ | ✔ |
| News Scanning | ✔ | ❌ | ❌ | ✔ |
| Backtesting | ✔★ | ✔ | ✔ | ✔★ |
| Code-Free Backtesting | ✔★ | ❌ | ❌ | ❌ |
| Automated Analysis | ✔★ | ✔ | ✔★ | ✔ |
Hi Kevin, well if you value data control, powerful technical charts, and realtime news, then MetaStock could be a good choice.
i am already interested about the sofware i want to know how to installed the in computer and how to trade it and to know if it this very benefic for me and for the investment
I have been a trader for over 40 years, the only way to trade the market is not to trade the market. Read a Random Walk Down Wallstreet and then invest, not trade ,then dollar cost average into a no load mutual fund. relax enjoy life, and you will beat the “stock market experts’ every time.
Hi Barry,
I just came across your website and was impressed by the way you presented Metastock. I have been distributor and trainer for Metastock since the year 2000. I have recently produced and add-on for Metastock under the name The Elasticity Toolkit. I also run the site http://www.metastockswiss.ch which includes a database of Metastock Indicators, systems and explorations. Please take a look and tell me what you think. Any criticism is welcome.
Best reagrds,
Tim Straiton