On modern markets, milliseconds can separate the winners from the also-rans. Yet some charting suites still deliver 1-minute quotes dressed up as real-time. eSignal, backed by ICE Data Services, flips that script, pumping institutional‑grade depth and lightning‑fast tick data straight to your desktop.
But is raw speed enough?
Our independent audit lab score rates eSignal A 4.12, which sits just under the median benchmark of 4.21. Considering it is the most expensive tool we have tested, is it worth it?
Composite Lab Performance Score (CLPS)
Our CLPS score for eSignal is A 4.12, which sits just under the median benchmark of 4.21—a “strong but not dominant” overall result. The score profile is polarized: eSignal is elite in news and strong in broker connectivity, while it loses ground in modern usability (Speed & Ease) and outright misses native pattern recognition.
This is exactly what I’d expect from a mature professional platform: deep, fast data workflows for specialists, but not optimized for casual or mobile-first trading. In short: high capability, uneven coverage.
| Metric | Calculation | eSignal | High | Median | Low |
|---|---|---|---|---|---|
| Composite Lab Performance Score (CLPS) | Average for all ratings + 5X Superpower Boost for Top 5 killer features | 4.12 | 4.75 | 4.21 | 2.93 |
| Composite Lab Performance Score (CLPS) Overall Test Winners | TradingView 4.75 | TrendSpider 4.72 | Trade Ideas 4.52 |
eSignal’s core identity is a professional workstation built around real-time markets, configurable windows, and modular workflows. It supports an “operator-style” setup: multiple quote windows, alerts, scanning, and trading connectivity—then you bolt on premium market news and advanced tools as needed.
eSignal Test Ratings & Audit Results
The eSignal platform remains expensive at $67/m to $455/m, but for day traders and futures pros, the cost is offset by real-time news, fast data, and unique analytical depth. With real-time Factiva news, a crypto feed, and massively expanded technical libraries, eSignal has addressed its some of its biggest shortcomings while preserving the blazing-fast data and chart precision.
However, as you can see in the listed cons, poor educational material, usability, and costs drag eSignal’s rating down to below average.
| Test | Tier | Score | Average (Median) |
|---|---|---|---|
| Composite Lab Performance Score (CLPS) | A | 4.12 | 4.21 |
| Pricing Index | B | $303.87/m | $83.32/m |
| Value Score (VP) | C | 2.62 | 2.82 |
| Speed & Ease of Use | C | 2.92 | 4.50 |
| Chart Analysis Depth Index | C | 2.71 | 3.17 |
| Chart Pattern Depth & Accuracy | C | 0.00 | 2.73 |
| Scanning Performance | C | 2.75 | 3.38 |
| Backtesting Performance | B | 3.25 | 3.38 |
| Trading Bot & Auto-Trading Reliability | C | 2.50 | 2.50 |
| AI & Algo Index | C | 2.00 | 2.00 |
| Alert Speed | B | 3.67 | 3.67 |
| Trade Signal Quality | C | 0.00 | 0.00 |
| Broker Connectivity & Ecosystem Depth | A | 4.00 | 2.00 |
| Portfolio Tool Performance | C | 2.80 | 2.80 |
| Financial News Speed & Depth | AAA | 5.00 | 2.80 |
| Community Utility Index (CUI) | C | 2.50 | 3.25 |
| Support Infrastructure & SLA Audit | B | 3.75 | 3.75 |
Tested using benchmarking system v3.
See the 2026 v3 58-point eSignal test and benchmarks.
Pros
✔ Fast Tick Data
✔ Good Broker Connectivity
✔ Trading from charts
✔ AAA | Realtime News
✔ Broad Global Asset Coverage
✔ 900 EFS Custom Scripts
✔ 3000 user-generated strategies
✔ Code-Free Backtesting EFS Scripts
Cons
✘ Not for Value or Dividend Investors
✘ Effective Monthly Cost Too High for Retail Investors
✘ Scanning Performance
✘ Speed & Ease of Use
✘ Learning Materials are Poor
✘ YouTube Learning Videos are Hopelessly Out of Date.
Verdict – Is eSignal Worth It?
In my lab audit, eSignal reads like a professional legacy workstation: powerful where it matters (real-time news workflow, broker connectivity, alerting, and deep programmability), but expensive and not built around modern convenience. The strongest upside is the “institutional wire” feel when you add premium news services, which is why Financial News scored at the top of my rubric.
For me, eSignal is not worth the high price, and it falls short of several modern expectations, like native pattern recognition, frictionless workflows, and powerful multi-stock code-free backtesting. For serious day-traders, it’s best as a specialist pro tool, not an all-in-one.
Reasons to Consider
- Institutional-grade news + data workflow when configured with premium feeds (strongest score area).
- Integrated trading ecosystem plus strong alerting and programmable extensibility (best as a “pro cockpit”).
- Best fit for traders who value highly configurable professional tooling over modern web UX and social features.
Reasons to Avoid (or pair with another tool)
- Very expensive in a comparable real-time + premium news configuration (EMC is at the top end).
- No native pattern engine in my test results (pattern depth/accuracy scored 0).
- UX and speed-to-action can feel heavy versus modern web-first platforms (pair with a lightweight charting front-end).
- Mac users must use Parallels or Boot Camp.
- Premium pricing: Exchange fees and add-ons can add up quickly; Elite with real-time US options feeds can top $600/mo.
- No built‑in social community: Unlike TradingView, there’s no idea‑sharing feed; the learning curve can feel lonely.
- Code‑based backtesting: Strategy Analyzer relies on EFS coding – a powerful yet not click-and-run approach, like TrendSpider or MetaStock.
Compare to Similar Products
When comparing eSignal to TrendSpider, TradingView, MetaStock, and Trade Ideas, our tests show that TrendSpider is the best overall stock analysis software, passing 10 out of 12 tests. For automated stock chart analysis, backtesting, and automated bot trading, TrendSpider is our top pick.
TradingView is better for a global trading community. Stock Rover is better than eSignal for long-term growth, dividends, and value investors. For AI-driven robotic day trading, Trade Ideas is better. For trading real-time news, MetaStock is a better alternative.
| Features | eSignal | TrendSpider | TradingView | Trade Ideas | MetaStock |
| Rating | 4.12 | 4.72 | 4.75 | 4.52 | 4.42 |
| Pricing | $67-$466/m | $54 | $214 | $0 | $14 | $28 | $56 | $89 | $178 | $100 | $265 |
| Global Market Data | ✔ | USA | ✔ | USA | ✔ |
| Powerful Charts | ✔ | ✔ | ✔ | ❌ | ✔ |
| Stocks | ✔ | ✔ | ✔ | ✔ | ✔ |
| Futures | ✔ | ✔ | ✔ | ❌ | ✔ |
| Forex | ✔ | ✔ | ✔ | ❌ | ✔ |
| Cryptocurrency | ✔ | ✔ | ✔ | ❌ | ❌ |
| Social Community | ❌ | ❌ | ✔ | ✔ | ❌ |
| Real-time News | ✔ | ❌ | ❌ | ❌ | ✔ |
| Screeners | ✔ | ✔ | ✔ | ✔ | ✔ |
| News Scanning | ✔ | ✔ | ❌ | ❌ | ✔ |
| Backtesting | ✔ | ✔ | ✔ | ✔ | ✔ |
| Backtesting | ✔ | ✔ | ❌ | ❌ | ❌ |
| Automated Analysis | ✔ | ✔ | ✔ | ✔ | ✔ |
If you want software that can scan global stock markets in real time, I strongly recommend it. If you are looking for the best technical analysis software with backtesting, real-time news, and forecasting, I suggest MetaStock R/T. Alternatively, if you’re looking for the best real-time news service, consider investigating Benzinga Pro.
If you’re looking for a great mix of screening, charting, and a strong social trading community, then TradingView is definitely worth checking out.
Key Features
| ⚡ Features? | Charts, Scanning, Watchlists, Realtime News |
| 🏆 Unique Features? | Broker Integration, Advanced Get, Volume Delta, Market Depth |
| 🎯 Best for | US Day Traders |
| ♲ Subscription | Monthly, Yearly |
| 💰 Price | $67-$466/mo |
| 💻 OS | PC, IOS |
| ✂ Discount | None |
| 🌎 Region | Global |
Pricing Index
Pricing is the biggest friction point, its too expensive for what it offers. In my comparable configuration (real-time data + premium news), eSignal’s Effective Monthly Cost (EMC) is $303.87/month, the highest in my benchmarks. That pushes Cost-per-day to $9.99, again at the top end. This is not a platform you pick for value; you pick it when the specific workflow, especially tick data, premium news speed, and filtering, justifies the spend. If you don’t need the professional news stack, your effective cost can fall materially. But configured to compete with news-centric pro tools, it is expensive.
| Metric | Calculation | eSignal | High | Median | Low |
|---|---|---|---|---|---|
| Cost-per-day | $/day on an annual plan (minimum viable plan with real-time exchange data) | $9.99 | $9.99 | $2.74 | $0.74 |
| $ per feature | Effective Monthly Cost / Total Features | $23.37 | $23.37 | $5.95 | $1.94 |
| Effective Monthly Cost (EMC) | (Plan price + required real-time data + key premium add-ons) / month | $303.87 | $303.87 | $83.32 | $22.50 |
The cost structure is modular: the platform is the base, and pro users typically add premium news services and data packages. The official Add-Ons catalog (which further increases the price) includes services like Dow Jones News Service and other premium components, reinforcing that eSignal is built to be “assembled” into a pro environment rather than shipped as a cheap all-in-one.
| Plan | Monthly | Highlights |
| Classic | $67 | Delayed snapshot data, advanced charting, Market Screener Plus, 500 symbols, 40‑add‑on App Store |
| Signature | $228 | Real‑time streaming data, options chains, Market Profile & Volume Delta, News & Research window, back‑testing |
| Elite | $466 | Everything in Signature + Advanced GET suite, extended historical data, Make‑or‑Break, 20 exclusive GET indicators |
| Blockstream Crypto Feed (Extra) | $10 | Coverage: 145 coins aggregated from 31 Tier‑1 venues (Binance, Coinbase, Kraken, etc.) |
Value Score (VP)
Value Score (2.62) is slightly below the median benchmark (2.82). The pattern is clear: eSignal has respectable breadth (13) and decent feature depth (3.00), but it loses points on overall perceived quality-to-cost and on device coverage, which scores only 1.00 in my rubric. This is the classic pro desktop tradeoff: if you want a heavyweight workstation, you accept that “value” is not the core promise.
| Metric | Calculation | eSignal | High | Median | Low |
|---|---|---|---|---|---|
| Value Score | 60% Feature Quality + 30% Feature Depth + 10% Device Support | 2.62 | 4.37 | 2.82 | 1.70 |
| Value Rank | Percentile ranking | 2.25 | 5.00 | 2.50 | 1.00 |
| Feature Quality | Average of quality ratings | 2.70 | 4.16 | 2.97 | 2.00 |
| Feature Breadth | Count of meaningful core features | 13 | 17 | 12 | 9 |
| Feature Depth | Percentile ranking | 3.00 | 4.75 | 3.00 | 1.00 |
| Device Support Depth | Web=2; PC/iOS/Android=1 each | 1.00 | 5.00 | 2.00 | 1.00 |
| Value Score Test Winners | TradingView 4.37 | TrendSpider 4.20 | Trade Ideas 4.05 |
For traders comparing modern web suites that bundle community, scanners, pattern engines, and automation, eSignal will often look overpriced.
Speed & Ease of Use
This is where eSignal underperforms: a 2.92 index score is well below the median 4.50. The raw platform performance isn’t terrible, chart load time scored 4.00, and multi-chart latency is competitive at 114ms—but “speed” in my rubric includes speed-to-action. The 3-click workflow punishes eSignal hard: 5 clicks yield only 0.75 points.
| Metric | Calculation | eSignal | High | Median | Low |
|---|---|---|---|---|---|
| Speed & Use Index Rating | Avg of speed-to-chartmultimonitoror speed, 3-click rule | 2.92 | 5.00 | 4.50 | 3.30 |
| Time to Chart Speed (Seconds) | Click icon → loaded chart | 11.78 | 17.03 | 4.70 | 1.60 |
| Time to Chart Performance | Points from speed thresholds | 4.00 | 5.00 | 4.50 | 3.00 |
| Multi-Chart Latency (ms) | Sync latency | 114.00 | 667.00 | 209.00 | 10.00 |
| Multimonitor Chart Speed | Points from sync thresholds | 4.00 | 5.00 | 3.50 | 0.00 |
| 3-Click Rule Test | Clicks to placa e trade or launca h scan | 5 | 6 | 3 | 2 |
| 3 Click Rule: Ease of Use | Clicks >3 reduce points | 0.75 | 5.00 | 3.00 | 2.00 |
| Speed & Ease of Use Test Winners | TradingView 5.00 | Stock Rover 5.00 | Seeking Alpha 5.00 |
For active traders, that friction matters because it increases execution latency and cognitive load, especially when you’re scanning → validating → acting.
eSignal is optimized for configurable workstation power, not minimal-click UX. That means lots of window types, settings, and professional controls—excellent for experts, heavy for novices. If you run a dedicated trading desk, you can build a very efficient environment once configured.
But out of the box, it’s not the “modern web app” experience. For traders who prioritize fast execution workflows, pair eSignal with a broker-native trading front end (or a lightweight charting tool) while keeping eSignal as the data/news/analysis backbone.
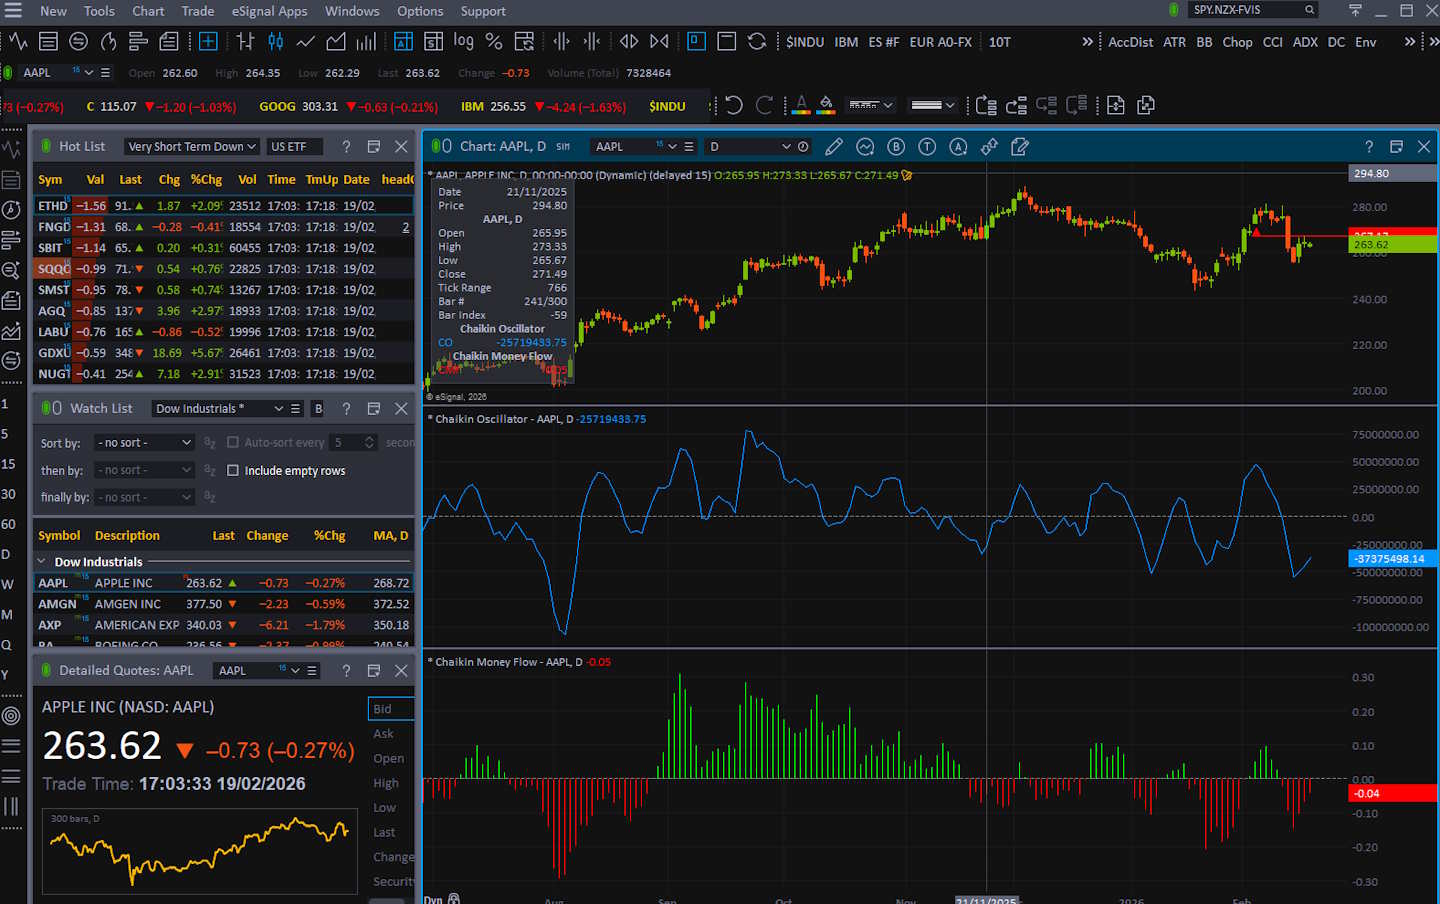
Chart Analysis Depth Index
Chart depth is mixed: the composite is 2.71, below the median of 3.17. The weakness is “native breadth”—only 5 chart types and 65 indicators in my count-based rubric, which drags down chart and indicator depth. But the saving grace is huge: custom indicator coding scored a full 5.00.
| Metric | Calculation | eSignal | High | Median | Low |
|---|---|---|---|---|---|
| Chart Analysis Depth Index | Avg of chart depth + indicator depth + custom coding | 2.71 | 5.00 | 3.17 | 0.50 |
| Chart Types | Total count | 5.00 | 38.00 | 10.00 | 1.00 |
| Chart Depth | 0.3 points per chart type | 1.50 | 5.00 | 3.00 | 0.30 |
| Indicators | Total count | 65.00 | 400.00 | 116.00 | 0.00 |
| Indicator Depth | 0.025 points per indicator | 1.63 | 5.00 | 2.90 | 0.00 |
| Custom Indicator Coding | Available = 5 points | 5.00 | 5.00 | 0.00 | 0.00 |
| Chart Analysis Depth Index Test Winners | TradingView 5.00 | MetaStock 5.00 | Optuma 5.00 |
That’s the eSignal pattern again—less emphasis on massive built-in libraries, more emphasis on letting advanced users build exactly what they want. If you’re a coder or you rely on specialized studies, that matters more than raw indicator count.
This is a platform for traders who want programmable control. Instead of chasing “400 built-in indicators,” the practical win is the ability to implement proprietary logic, custom studies, and workflow automation at the study level.
- Advanced GET delivers proprietary Elliott Wave counts, True Stochastic, PTI, and Gann box tools that are not available elsewhere. First released in 1987, GET has racked up 23 industry awards.
- Volume Delta & Market Profile chart types reveal buyer vs. seller aggression at each price level and the evolving distribution curve.
- Custom Scripting (EFS). JavaScript‑based, with an integrated debugger, strategy analyzer, and free FileShare for hundreds of community scripts.
If you trade specialized methodologies (institutional style analysis, custom filters, legacy technical frameworks), eSignal’s coding extensibility can replace dozens of prebuilt indicators. If you’re a beginner or you want a wide set of plug-and-play studies, a modern charting suite will feel richer. The choice is simple: library-first vs build-your-own-first.
Chart Pattern Depth & Accuracy
This is a hard “no native engine” result: pattern recognition scored 0.00 across the board in my rubric. That doesn’t mean you can’t trade patterns in eSignal—of course you can—but it means eSignal did not present a built-in, audited pattern library that qualifies under my benchmark definition.
| Metric | Calculation | eSignal | High | Median | Low |
|---|---|---|---|---|---|
| Pattern Recognition Efficacy & Accuracy | Avg of pattern depth + accuracy | 0.00 | 4.88 | 2.73 | 0.00 |
| Total Patterns | Count | 0.00 | 226.00 | 57.50 | 0.00 |
| Pattern Recognition Depth | 0.33 points per pattern | 0.00 | 5.00 | 1.90 | 0.00 |
| Candle Patterns Recognized | Count | 0.00 | 172.00 | 22.50 | 0.00 |
| Price & Trend Patterns Recognized | Count | 0.00 | 54.00 | 24.00 | 0.00 |
| Accuracy | % accurate | 0.00 | 95.00 | 89.50 | 0.00 |
| Pattern Recognition Accuracy | 0.05 points per 1% | 0.00 | 4.75 | 4.48 | 0.00 |
| Chart Pattern Recognition & Accuracy Test Winners | TrendSpider 4.88 | Trade Ideas 4.62 | TradingView 3.98 |
Compared to platforms that ship with hundreds of detectable patterns and publish accuracy validation, eSignal isn’t playing that game. If pattern recognition is central to your process, you’ll either pair eSignal with another tool or build custom logic via scripting.
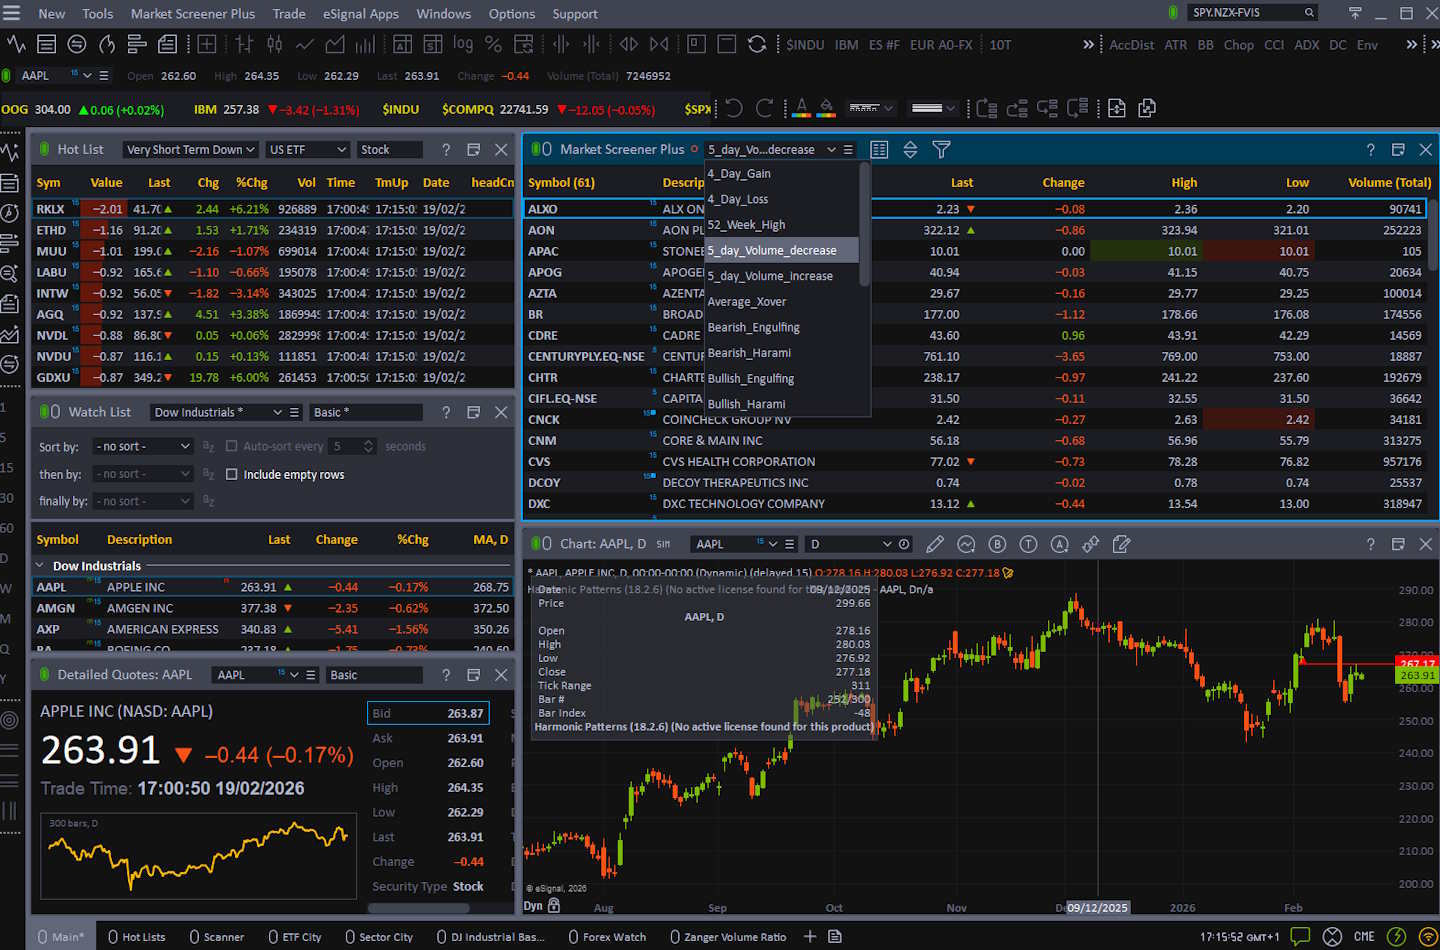
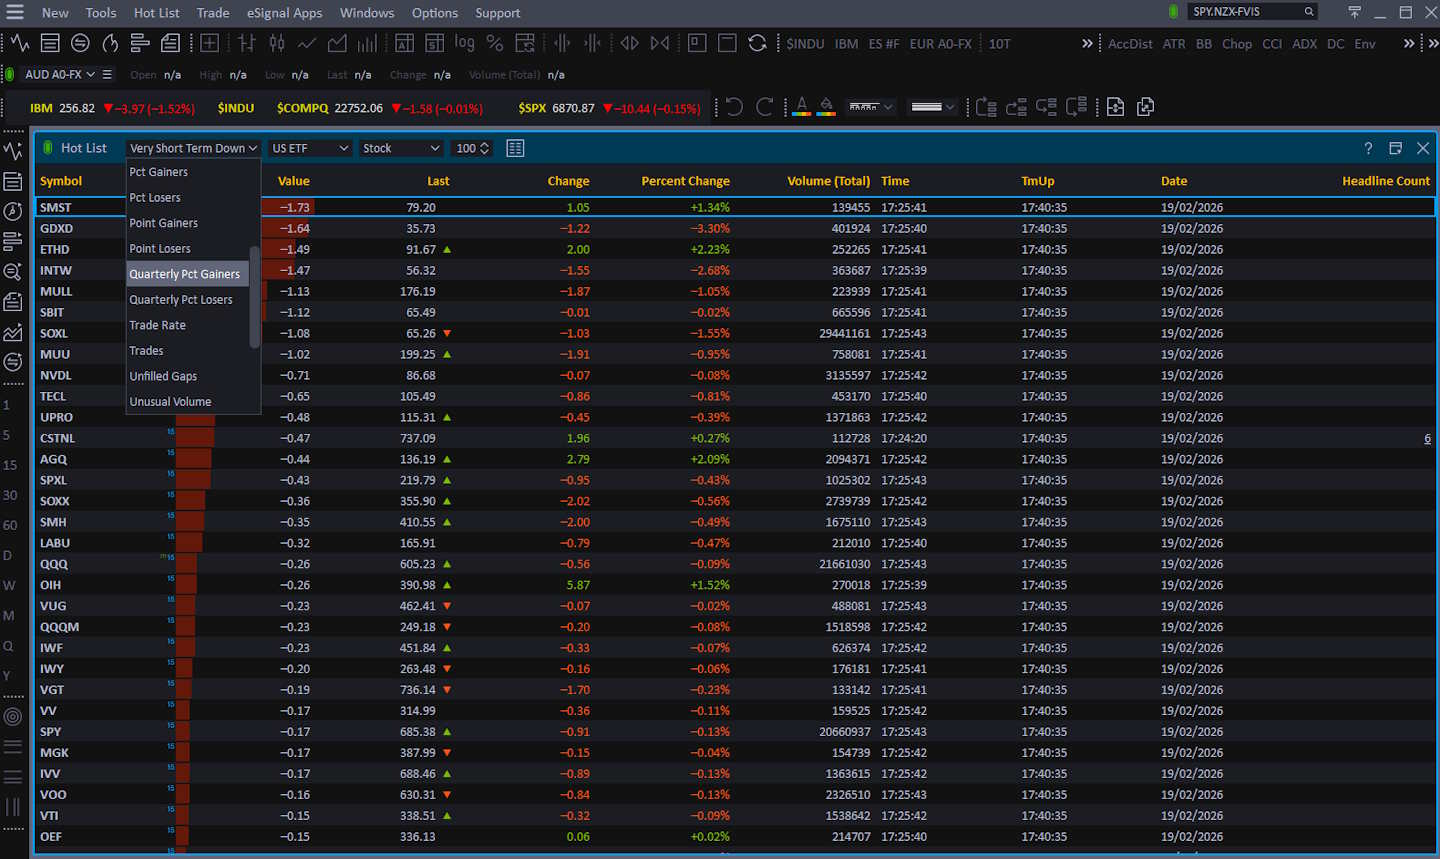
Scanning Performance
Scanning is “fast engine, thin library.” eSignal’s scan latency (564ms) yields 3.00 points—usable but below the median speed score. The real drag is scan depth: only 21 criteria in my count, which collapses the criteria depth points to 0.26.
| Metric | Calculation | eSignal | High | Median | Low |
|---|---|---|---|---|---|
| Market Scanning Latency & Depth | Avg of speed + criteria + custom code | 2.75 | 5.00 | 3.38 | 0.80 |
| Scanner Performance (ms) | S&P 500 scan across 5 criteria | 564.00 | 2500.00 | 300.00 | 7.00 |
| Scanning Speed Points | Points from scan latency | 3.00 | 5.00 | 4.00 | 1.00 |
| Auto-Refresh Rate (sec) | Not scored | 1.00 | 60.00 | 1.00 | 0.00 |
| Criteria Count | Total criteria count | 21.00 | 675.00 | 200.00 | 30.00 |
| Criteria Depth Points | 0.0125 points per criterion | 0.26 | 5.00 | 2.50 | 0.38 |
| Custom Code Scanning | Exists = 5 | 5.00 | 5.00 | 5.00 | 0.00 |
| Scanning Performance Test Winners | Stock Rover 5.00 | TradingView 4.83 | TrendSpider 4.67 |
But the custom code scanning score is 5.00, which signals the intended user: professionals who define their own scan expressions rather than relying on large dropdown libraries. If you need a large prebuilt criteria universe, eSignal won’t satisfy you. If you code your scans, it can.
Market Screener Plus Is Overhauled. Multi‑time‑frame scans, 50+ fundamental fields from FactSet, and 25 technical filters now run in near real-time and export straight to Excel.
- Scan entire exchanges or custom watchlists in seconds.
- Combine 50 fundamental metrics (EPS growth, EBITDA margin, etc.) with 25 technical conditions or your own EFS‑based signals.
- Save scan libraries, export to Excel, or copy results straight into a watchlist for one‑click trade execution.
For advanced users, scanning becomes a programmable problem: define conditions, refresh, and route results into alerts and watchlists. eSignal’s ecosystem supports that style of work—especially if you treat scanning as “code + data feed + workstation layout.”
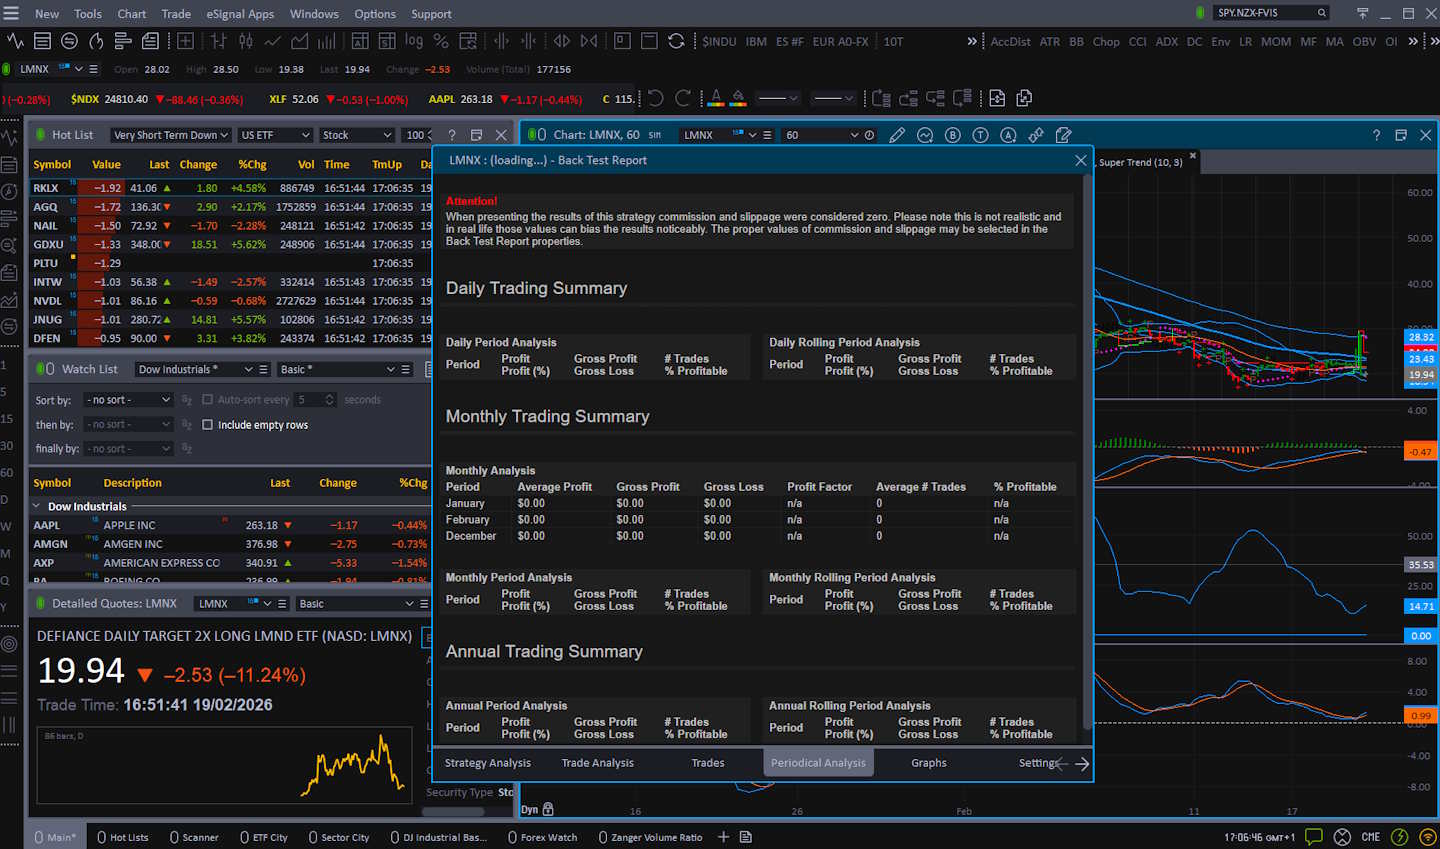
Backtesting Performance
Backtesting is decent overall (3.25) but not competitive with the top tier. The positives: speed is strong (205ms → 4.50 points), and flexible coding backtesting scores a perfect 5.00. The negatives: no zero-code workflow (0.00) and no multi-stock basket backtesting (0.00) under my rubric.
| Metric | Calculation | eSignal | High | Median | Low |
|---|---|---|---|---|---|
| Quantitative Backtesting Fidelity | Avg of speed + no-code + coding + reports + multi-stock | 3.25 | 4.90 | 3.38 | 0.00 |
| Backtesting Speed (ms) | Strategy sim over 10y daily / 2m intraday | 205.00 | 6000.00 | 302.00 | 7.00 |
| Backtesting Speed Points | Points from speed thresholds | 4.50 | 5.00 | 4.25 | 0.00 |
| No Coding Required | Zero-code backtesting | 0.00 | 5.00 | 5.00 | 0.00 |
| Flexible Coding Backtesting | Exists = 5 | 5.00 | 5.00 | 5.00 | 0.00 |
| Report Quality (%) | % of reporting criteria | 70.00 | 100.00 | 70.00 | 0.00 |
| Report Quality Points | 0.05 points per 1% | 3.50 | 5.00 | 2.25 | 0.00 |
| Multi-Stock Basket Backtesting | If exists = 5 | 0.00 | 5.00 | 5.00 | 0.00 |
| Backtesting Performance Test Winners | Optuma 4.94 | TrendSpider 4.88 | MetaStock 4.81 |
Reporting is “acceptable”: 70% coverage equals 3.50 points. So eSignal backtesting is best for coders validating single-instrument strategies quickly, not for portfolio-level research or drag-and-drop retail backtesting.
Think of eSignal backtesting as “engineering-grade strategy validation.” If you can code your logic, you get fast test cycles and reasonable reporting. That matches the platform’s broader DNA: professionals assembling a workstation, not beginners clicking prebuilt strategy templates. If your process requires multi-asset portfolio simulation, optimization, and standardized reports, you’ll likely pair eSignal with a dedicated quant/backtest environment. But if you mainly need to validate coded rules against quality data and iterate quickly, eSignal’s coded backtesting workflows can be a strong fit.
Trading Bot & Auto-Trading Reliability
Automation lands at the median (2.50). eSignal shows a credible path to “external execution” workflows (1.00 automation path) with moderate sophistication (1.50). Still, it does not earn operational assurance points (0.00) due to a lack of an explicit public SLA/credits promise in my benchmark definition.
| Metric | Calculation | eSignal | High | Median | Low |
|---|---|---|---|---|---|
| Automated Execution & Bot Reliability | Automation path + sophistication + operational assurance | 2.50 | 4.50 | 2.50 | 1.50 |
| Automation Path | 0.5 none → 2.0 native/broker-linked execution | 1.00 | 2.00 | 1.00 | 1.00 |
| Strategy/Bot Sophistication | 0.5 simple → 2.0 bot platform depth | 1.50 | 2.00 | 1.50 | 1.00 |
| Operational Assurance | 0.0 none → 1.0 explicit SLA | 0.00 | 1.00 | 0.00 | 0.00 |
| Bot Support Type | Qualitative | External Execution | — | — | — |
| Bot & Auto-Trading Reliability Test Winners | TrendSpider 4.50 | Trade Ideas 4.00 | Tickeron 4.00 |
In practice, this means eSignal can support automated or semi-automated workflows for advanced users. Still, it’s not a modern “bot marketplace” with turnkey deployment, health monitoring, and institutional uptime guarantees. It’s closer to a manual toolkit than a managed bot platform.
For automation-minded traders, eSignal’s strength is its extensibility: build logic, generate alerts/events, and route them for execution (directly or via connected broker paths). That’s powerful, but it assumes you can engineer and maintain your workflow. If you want a plug-and-play automation framework with strategy templates, broker execution rules, and robust operational safety rails, eSignal isn’t positioned as that. Used properly, it becomes a professional automation component: data + logic + alerting + connectivity, with your own execution layer and monitoring on top.
AI & Algo Index
AI & Algo is exactly median at 2.00, and it’s driven by algorithmic depth (1.50) rather than an AI layer (0.00). That’s consistent with an institutional legacy platform: strong rule-based capability and scripting extensibility, but no modern AI-native features in the sense of ML-driven signal engines or LLM-style assistance. Transparency is mid (0.50): there’s enough structure to understand what you built, but not the modern “validated AI artifacts” approach you see in AI-first tools.
| Metric | Calculation | eSignal | High | Median | Low |
|---|---|---|---|---|---|
| Algorithmic Intelligence & AI Tier Index | Algo depth + AI layer + transparency | 2.00 | 5.00 | 2.00 | 1.00 |
| Algo Depth | 0.5 alerts → 2.0 advanced quant platform | 1.50 | 2.00 | 1.50 | 1.00 |
| AI Layer | 0 none → 2 AI-native | 0.00 | 2.00 | 0.00 | 0.00 |
| Transparency | 0 black-box → 1 validated methodology | 0.50 | 1.00 | 1.00 | 0.00 |
| AI & Algo Index Test Winners | TrendSpider 5.00 | Trade Ideas 4.50 | Tickeron 4.50 |
This category is best understood as “engineerable intelligence.” If you can design rules, scans, and alerts—and validate them with backtesting—eSignal gives you the building blocks for sophisticated algorithmic workflows.
What it doesn’t provide is turnkey AI that generates strategies, explains trades with model-based reasoning, or continuously adapts using machine learning. If you want AI-native decisioning, pair eSignal with an AI-first research layer to create a programmable professional environment where you are the intelligence. eSignal fits.
Alert Speed
Alerts are solid: 3.67, exactly at the median benchmark. The standout is concurrency (5.00) with no practical cap found in my evaluation, which matters for professionals running many symbols/conditions. Stream richness is only 2.00, meaning eSignal supports a couple of strong delivery paths but doesn’t present the multi-channel breadth some modern platforms do (webhooks, mobile push ecosystems, etc.).
| Metric | Calculation | eSignal | High | Median | Low |
|---|---|---|---|---|---|
| Alert Trigger Latency & Delivery Speed | Avg of concurrency + streams + speed rating | 3.67 | 4.67 | 3.67 | 2.33 |
| Concurrent Alerts | 1 point/50 alerts (max 5) | 5.00 | 5.00 | 5.00 | 5.00 |
| Concurrent Alert Count | Count | Unlimited | 2000 | 875 | 400 |
| Alert Streams Richness | Streams (email/webhook/SMS/app, etc.) | 2.00 | 5.00 | 2.00 | 1.00 |
| Alert Speed Rating | Qualitative speed rating | 4.00 | 5.00 | 3.00 | 1.00 |
| Alert Speed Test Winners | TradingView 4.67 | TrendSpider 4.33 | Benzinga Pro 4.33 |
Speed rating is strong at 4.00: alerts are responsive to market data updates, which is what matters in real-time trading.
If you need highly engineered routing (webhooks → bots), you need to look elsewhere.
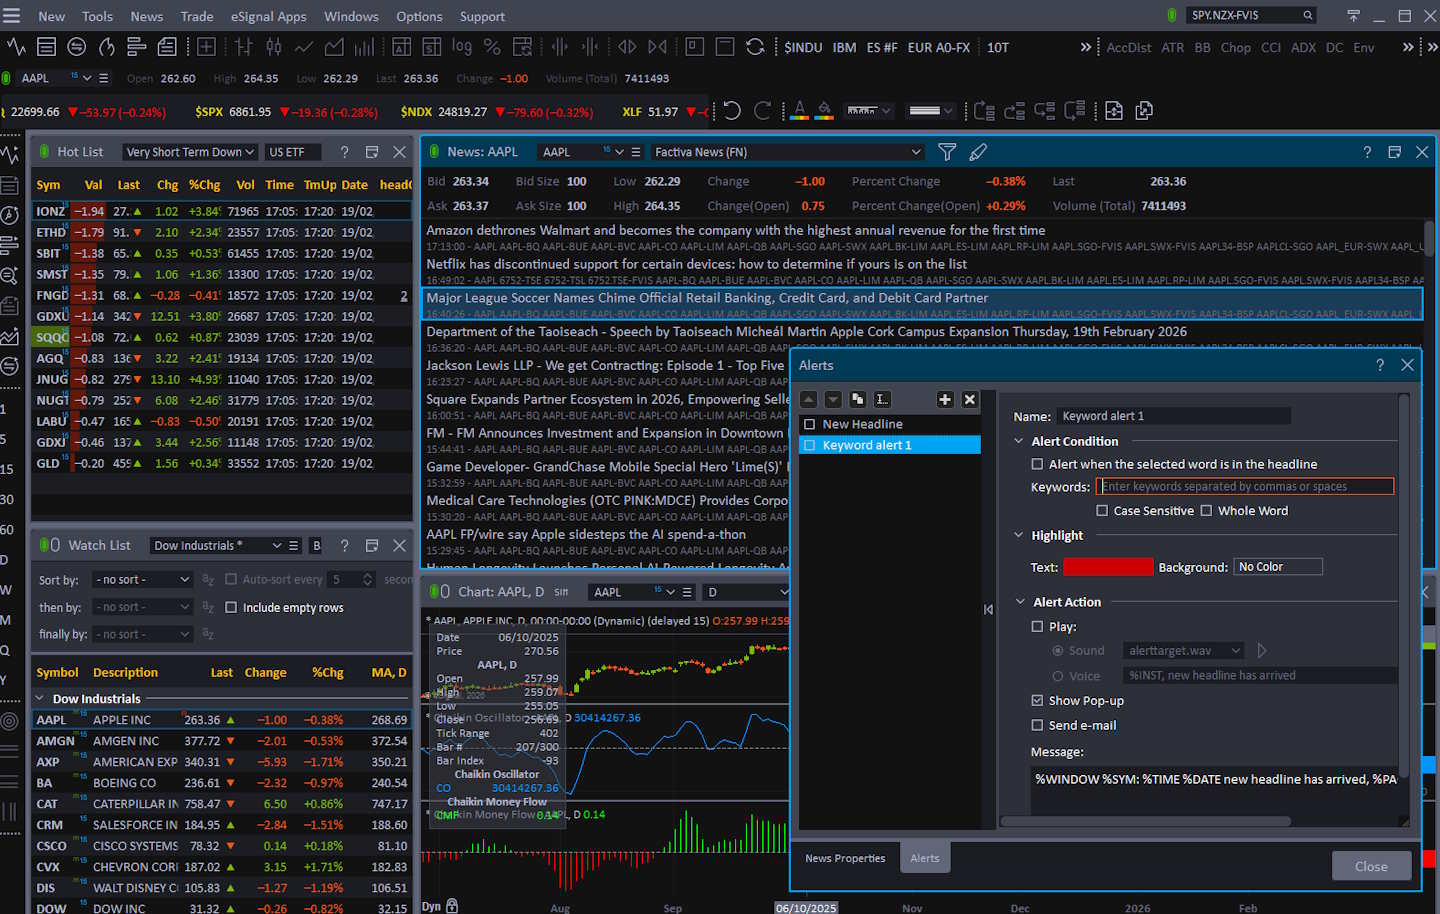
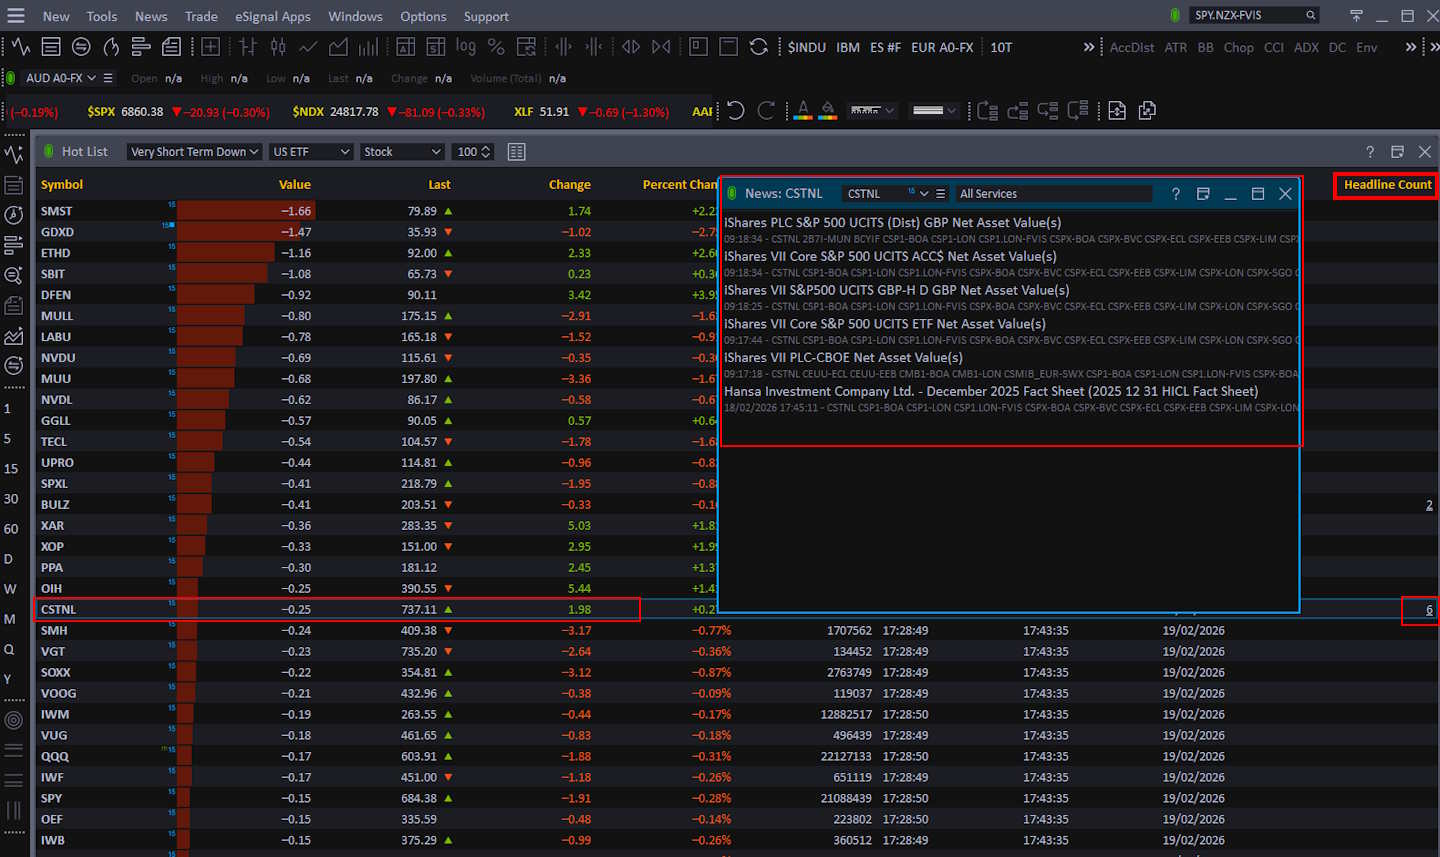
eSignal’s alerting is built into the workstation concept: you can structure quote windows and ticker-style components so “news alerts” and symbol events surface in the interface as part of the flow.
The official KB describes how quote ticker windows can display News Alerts for symbols you’re watching, reinforcing that alerts are not just notifications—they’re part of a professional dashboard workflow.
Trade Signal Quality
Trade Signal Quality is 0.00 in my rubric because eSignal did not present audited, platform-native trade signal generation in the form required by my benchmark definition. This doesn’t mean traders can’t create signals; they can absolutely do so via studies, scans, and alerts. It means the platform isn’t positioned as a “signals product” with published signal methodology, performance, and validation artifacts. If your buying decision depends on built-in predictive signals, eSignal won’t satisfy that requirement.
| Metric | Calculation | eSignal | High | Median | Low |
|---|---|---|---|---|---|
| Signal Alpha & Predictive Efficacy | 5 = audited trade signals; 2.5 = gauges | 0.00 | 5.00 | 0.00 | 0.00 |
| Trade Signal Quality Test Winners | Trade Ideas 5.00 | Seeking Alpha 5.00 | Tickeron 5.00 | Motley Fool 5.00 |
eSignal is better understood as a professional analysis and execution environment, not a signal vendor. You build your own decision framework: indicators, custom studies, scan logic, alerts, and backtesting—then execute via integrated brokers. That is a stronger foundation for serious traders than opaque “buy/sell” prompts, but it demands expertise.
If you want signals, pair eSignal with a vetted signal provider or research service. If you want control, eSignal gives you the tools to construct and validate your own signal logic.
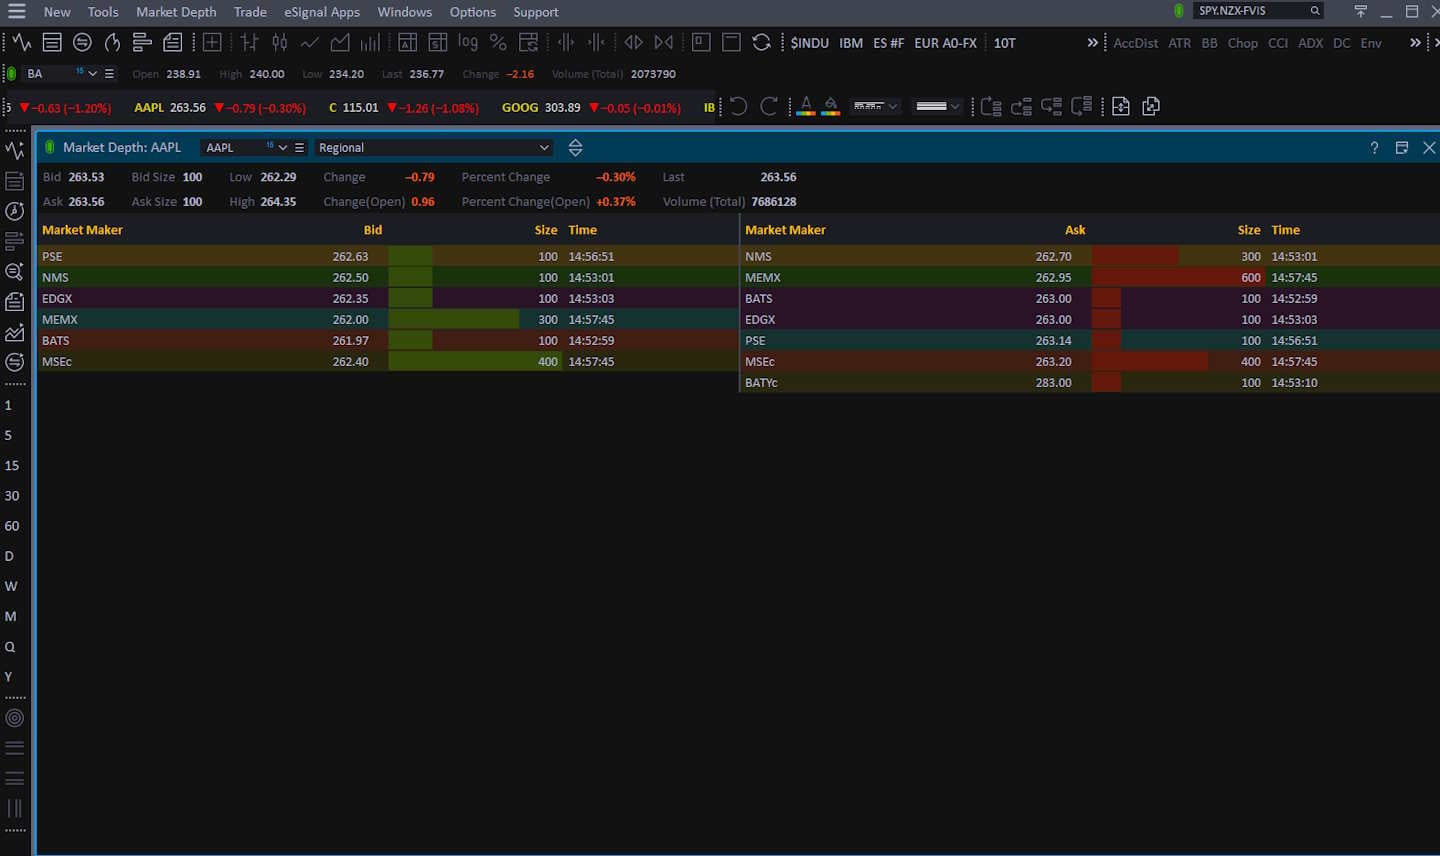
Broker Connectivity & Ecosystem Depth
Broker connectivity is a highlight at 4.00, well above the median 2.00. Live trading is fully present (5.00), and the integrated broker roster in my dataset supports a meaningful broker integration score (3.00). Asset & data coverage also scores high (4.00), indicating broad market support across major asset classes and exchanges under my rubric. In plain terms: eSignal is not just a charting app; it’s built to sit close to execution and professional data feeds, which is why this category performs strongly.
| Metric | Calculation | eSignal | High | Median | Low |
|---|---|---|---|---|---|
| Asset & Data Coverage Index | Avg of live trading + broker integration + asset coverage | 4.00 | 5.00 | 2.00 | 0.67 |
| Live Trading | Exists = 5 | 5.00 | 5.00 | 5.00 | 0.00 |
| Brokers Integrated | Count | 30 | 1200 | 2 | 0 |
| Broker Integration Points | 0.1 per broker (max 5) | 3.00 | 5.00 | 0.20 | 0.00 |
| Asset & Data Coverage | Stocks/options/FX/US/int’l exchanges (1 point each) | 4.00 | 5.00 | 2.00 | 2.00 |
| Broker Connectivity & Ecosystem Test Winners | TradingView 5.00 | MetaTrader 5.00 | TrendSpider 4.43 |
This is a critical distinction from analysis-only platforms: when you connect trading, alerts, and analysis, they become actionable. For serious traders, this connectivity is often the deciding factor—especially if you want one workstation that can analyze, monitor, and execute without constantly switching tools.
If you prefer broker-native execution speed and simplicity, you can still use eSignal as the analysis/news console and route execution elsewhere.
As a division of ICE Data Services, eSignal pipes in 200+ real-time feeds covering equities, futures, FX, and fixed income; few retail platforms offer the same depth‑of‑book view (full market depth, NBBO, & regional tape). Add optional FactSet global fundamentals for institutional‑grade screening.
Integrated Trading & Options Analytics
eSignal routes orders to Interactive Brokers, TradeStation, E*TRADE, and 10+ other brokers. Place trades directly from the chart, manage OCO brackets, and monitor P/L in real time. Elite users also unlock Options Analytix for probability cones, payoff diagrams, and volatility smiles.
Portfolio Tool Performance
Portfolio tooling is middle-of-pack: 2.80, exactly at the median benchmark. Coverage is 35/80 (43.8%), which is essentially the median depth by my rubric. That means eSignal can track holdings and provide practical P/L and monitoring, but it is not a specialized portfolio analytics platform.
| Metric | Calculation | eSignal | High | Median | Low |
|---|---|---|---|---|---|
| Portfolio Health & Risk Analytics | Portfolio index rating | 2.80 | 4.80 | 2.80 | 2.00 |
| Health Check & Reporting Depth | % of critical metrics covered | 35/80 (43.8%) | 76/80 (95.0%) | 36/80 (45.0%) | 20/80 (25.0%) |
| Portfolio Tool Performance Test Winners | Stock Rover 4.80 | Portfolio 123 4.80 | Seeking Alpha 4.30 |
If your workflow needs correlation matrices, factor exposures, risk decomposition, and portfolio optimization, eSignal won’t be your best “home base.” If you mainly need position tracking and basic portfolio visibility inside a trading workstation, it’s adequate.
This is consistent with eSignal’s design: it’s a trading and market intelligence environment first. Portfolio tools exist primarily to support trading workflows—monitor holdings, view performance, and stay connected to execution. For most active traders, that’s enough, because risk analytics often lives in separate tooling (broker analytics, portfolio platforms, or quant suites). The smart setup is: use eSignal for market monitoring, alerts, and execution connectivity; then maintain deeper portfolio analytics in a portfolio-first tool if that’s a priority.
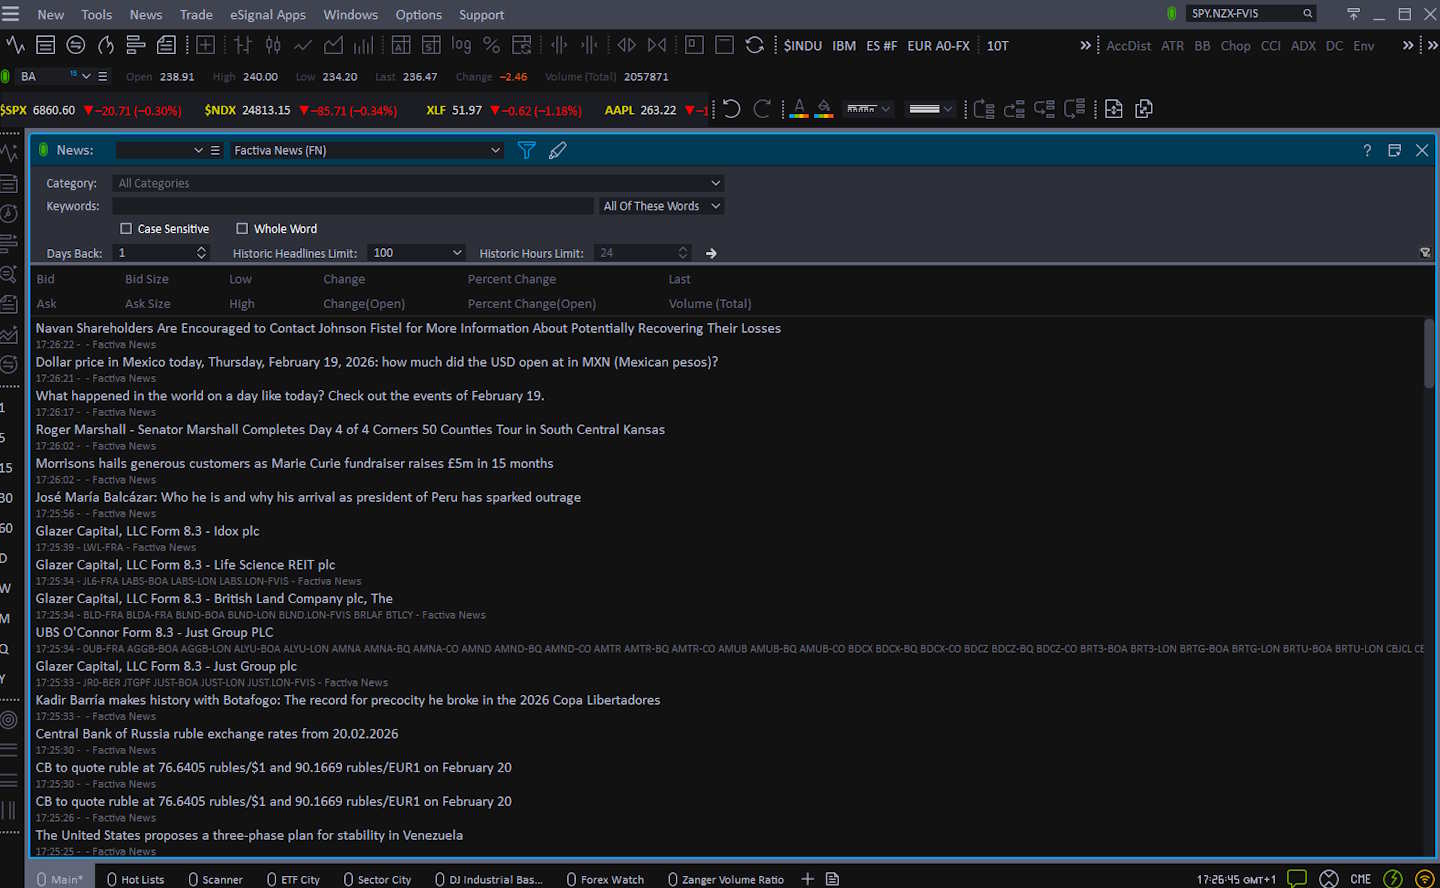
Financial News Speed & Depth
This is eSignal’s signature advantage in my lab test: 5.00, the top possible rating. The measured wire delay (1–5 seconds) is effectively “institutional real-time” in practical trading terms. Compared to most retail platforms—where news is delayed, filtered, or resyndicated—eSignal can be configured to support a true pro news workflow. That’s why it can justify its cost for certain traders: if you are trading catalysts, macro, or global events, news latency and filtering depth are not nice-to-haves; they are the edge.
| Metric | Calculation | eSignal | High | Median | Low |
|---|---|---|---|---|---|
| Financial News Speed & Quality Rating | Weighted rubric | 5.00 | 5.00 | 2.80 | 0.00 |
| Wire Delay | Seconds between primary wire feeds and the app | 1s–5s | <1s | 60–300s | Hours/Days |
| Financial News Speed & Depth Test Winners | MetaStock 5.00 | Benzinga Pro 5.00 | Scanz 5.00 |
eSignal’s ecosystem explicitly supports premium news. Real-time News Built‑In. All plans now include Dow Jones Factiva streaming headlines from 600+ sources. Optional Dow Jones Newswire and MT Newswires remain available à la carte, reflecting its positioning as a professional news + data terminal rather than a retail add-on feed.
- Factiva streaming headlines are now standard – no extra fee – providing you with 600+ curated wires in real-time.
- Add Dow Jones Institutional, CNBC TV, MT Newswires, or The Fly for specialised coverage.
- Symbol-linked news windows maintain context and support keyword alerts.
The practical feature set focuses on workflow: filtering, plotting news/events in your monitoring environment, and turning headlines into action through alerts and execution connectivity. This is also why eSignal remains relevant in 2026 despite intense competition: not because it’s trendy, but because “real-time institutional news inside a trading workstation” is still rare and valuable.
Community Utility Index (CUI)
Community lands at 2.50, below the median 3.25. That’s expected: eSignal is not a social-first platform with public scripts, massive idea streams, and millions of retail creators. Active community size is modest (2.00), but contribution quality is decent (3.00), suggesting a smaller pool with higher technical competence. For a trader, that means you should not buy eSignal expecting a TradingView-style discovery engine. You buy it for professional tooling, then rely on external communities (or your own research process) for idea generation.
| Metric | Calculation | eSignal | High | Median | Low |
|---|---|---|---|---|---|
| Community Utility Index | Avg of community size + contribution quality | 2.50 | 5.00 | 3.25 | 1.75 |
| Active Community Size | Crowd density scale | 2.00 | 5.00 | 3.25 | 1.80 |
| Contribution Quality | Alpha quality scale | 3.00 | 5.00 | 3.50 | 1.50 |
| Community Utility Index Test Winners | TradingView 5.00 | MetaTrader 5.00 | Trade Ideas 4.75 |
Where community does matter for eSignal is in specialist knowledge: power users sharing setups, data configurations, and custom logic. That kind of community is rarely loud or large, but it can be high-value. If you’re the sort of trader who benefits from “one killer workspace layout” and high-fidelity data configuration, you’ll find more value in expert resources than in social feeds.
Still, if community-driven indicators and crowdsourced trade ideas are central to your process, pair eSignal with a community-first platform and keep eSignal as the professional execution/news layer.
Support Infrastructure & SLA Audit
Support is slightly above median at 3.75, with strong communication access (4.00) and acceptable response times (3.50). The practical meaning: you can reach humans through professional channels, but you should not expect “instant chat” speed typical of modern SaaS products with massive support teams. This matches the platform’s market positioning: specialized professionals supported by a more focused team. For serious traders, the key is reliability of resolution quality, getting a correct fix/configuration—not just fast replies.
| Metric | Calculation | eSignal | High | Median | Low |
|---|---|---|---|---|---|
| Support SLA Audit: Time-to-Human Benchmarks | Avg of channels + response time | 3.75 | 5.00 | 3.75 | 1.00 |
| Support Communication Channels | Access scale | 4.00 | 5.00 | 3.50 | 1.00 |
| Support Response Times | SLA scale | 3.50 | 5.00 | 4.00 | 1.00 |
| Support Infrastructure & SLA Audit Winners | TrendSpider 5.00 | TC2000 5.00 | ThinkorSwim 4.75 |
The official knowledge base is extensive and operationally oriented (setup guides, trading connectivity instructions, window/function tutorials). For example, integrated trading setup steps are documented in detail (Rithmic connection workflow), which signals a support model built around “configure a professional workstation correctly.”
If you’re comfortable reading KB docs and setting up technical systems, eSignal support is a good fit. If you need beginner-style handholding and instant live chat for basic questions, you’ll likely prefer a modern retail-first platform.
I have never heard of them, and I must say the IQFEED website looks awful. I would not trust it.
Hi Barry, have you had any experience with IQFEED? I see it’s an option for the software I’m considering