Momentum indicators are technical analysis chart overlays that help traders identify the strength and direction of an asset’s price movement.
To understand momentum indicators, it is essential to grasp the concept of momentum. In physics, momentum is the product of an object’s mass and velocity. In this article, I’ll explain momentum indicators, how to use them, and common mistakes to avoid.
Key Takeaways
- According to my day trading indicator testing, momentum indicators are reliable and profitable when configured correctly.
- Momentum indicators use mathematical calculations to measure the rate of change of a stock’s price over time.
- There are many momentum indicators, each with its unique formula and interpretation.
- By understanding momentum indicators, traders can better understand when to buy or sell an asset.
Top Momentum Indicators
Momentum indicators are technical analysis chart overlays to assist traders in identifying a stock price movement’s strength and direction. They are based on the principle that a trend in motion will continue until something changes. By analyzing the rate of change in a stock’s price, momentum indicators can provide valuable insights into whether a stock is overbought or oversold and whether a trend is likely to continue or reverse.
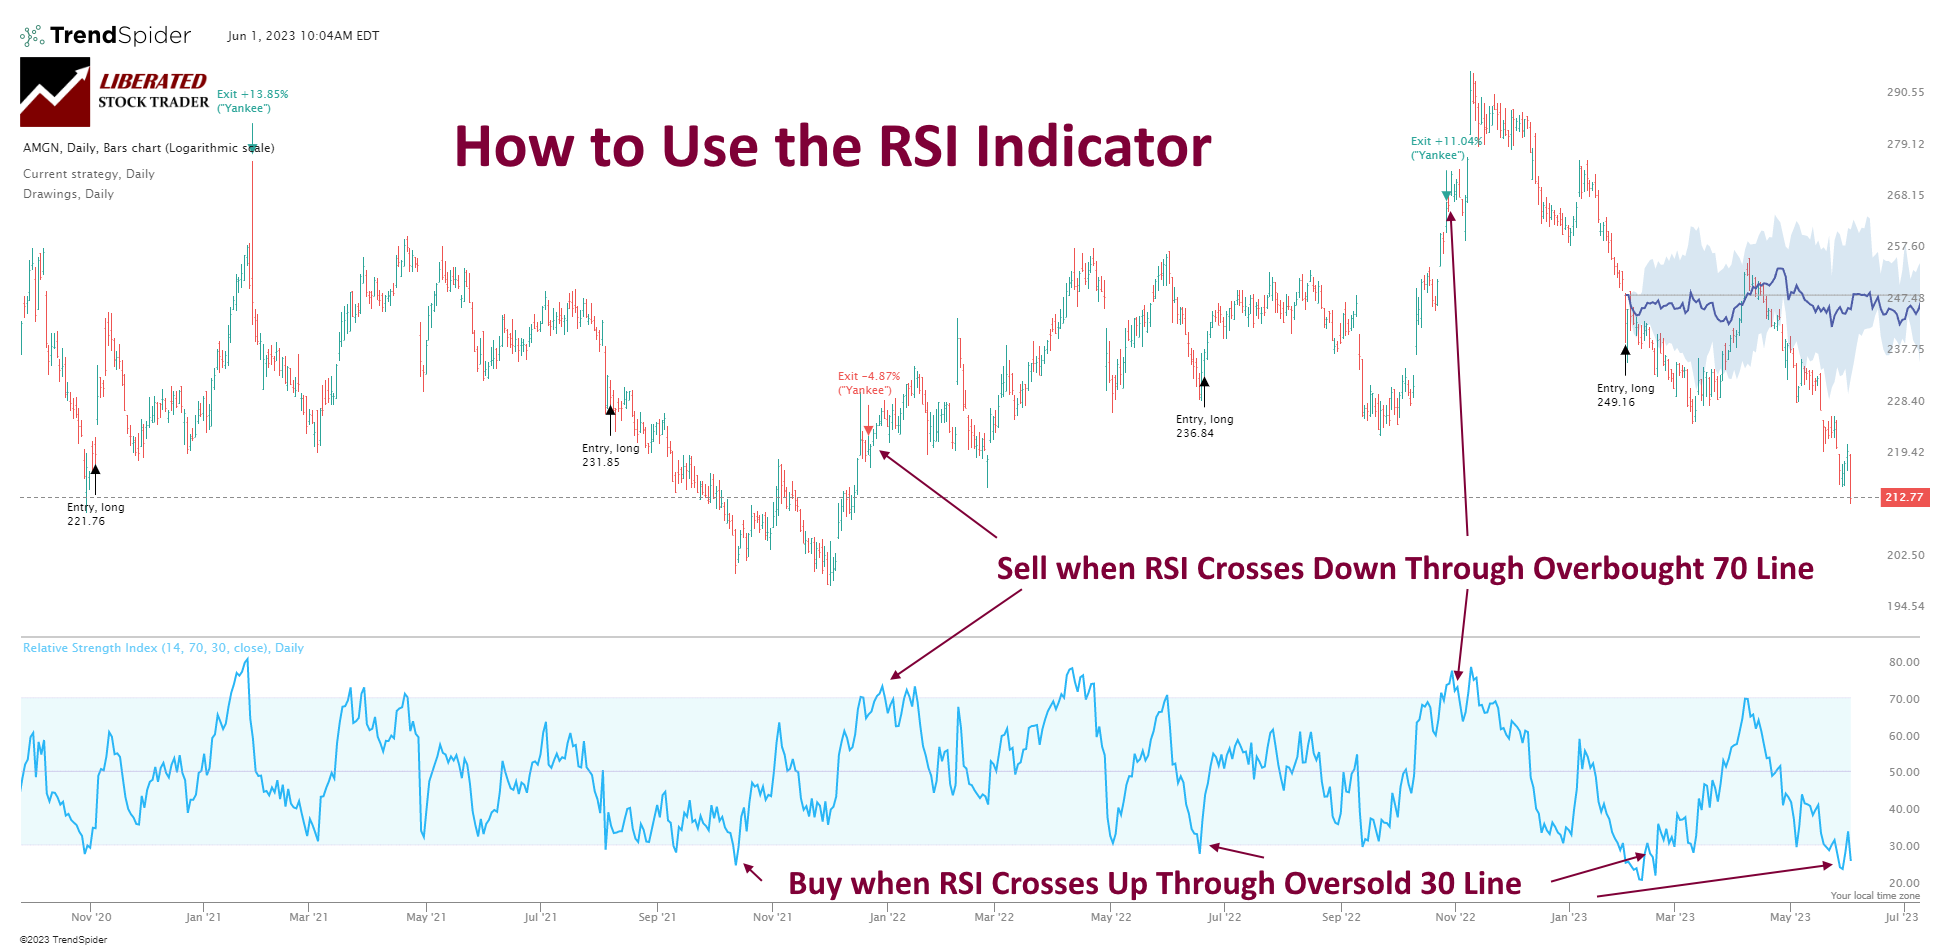
1. Relative Strength Index (RSI)
Relative Strength Index (RSI): The RSI indicator measures the strength of a stock’s price movement over a specified period. It ranges from 0 to 100, with readings above 70 indicating that a stock is overbought and below 30 indicating that it is oversold. Traders use RSI to identify potential trend reversals and confirm a trend’s strength.
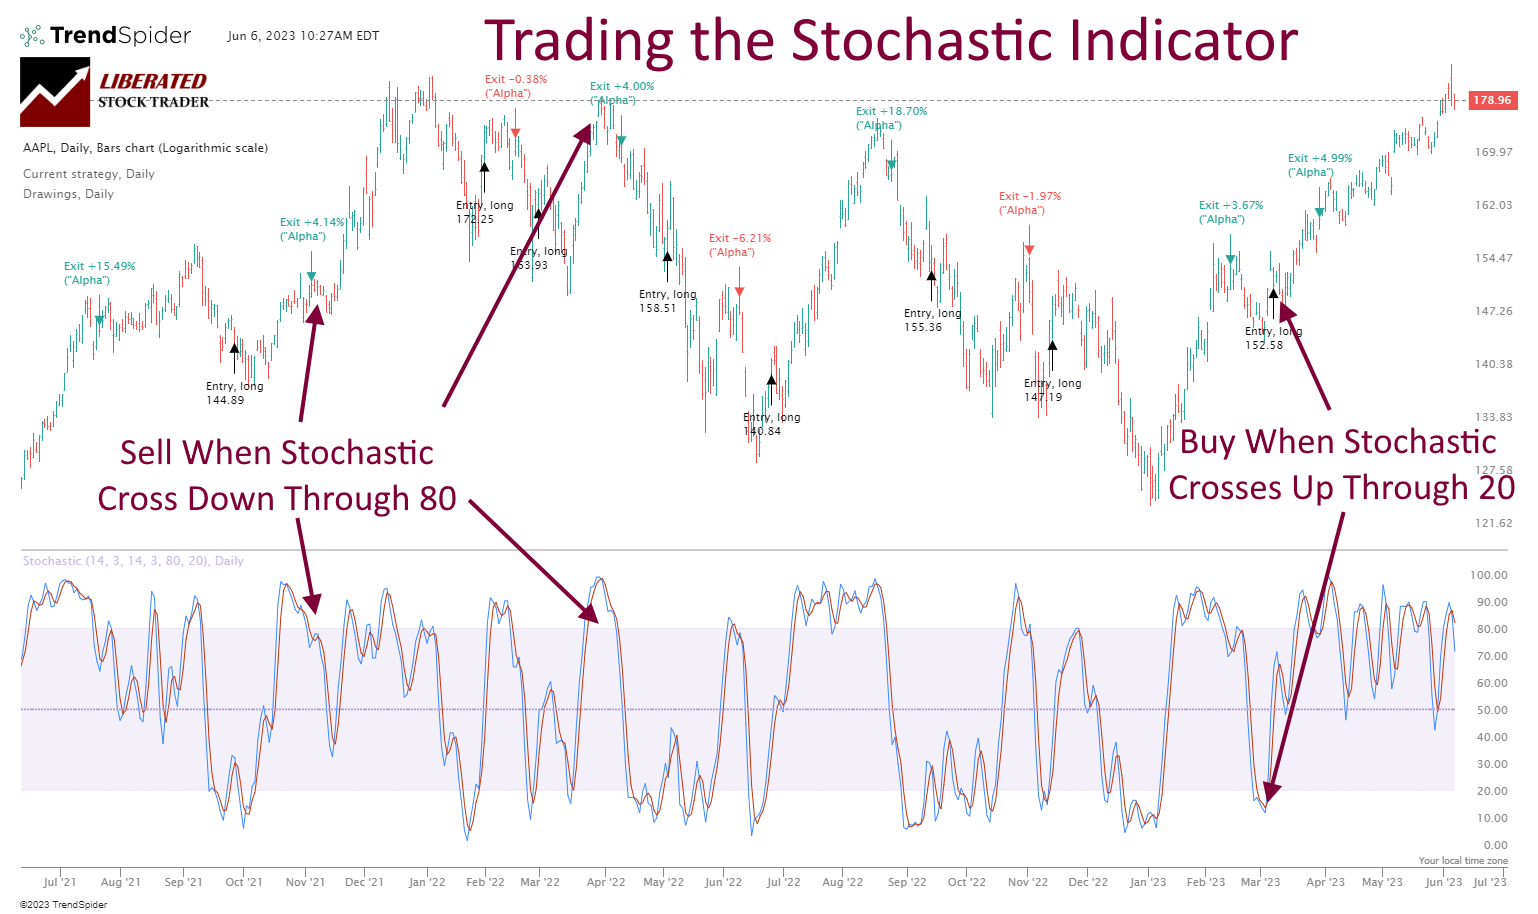
2. Stochastic Oscillator
The stochastic oscillator is a momentum indicator that compares a stock’s closing price to its price range over a specified period. It ranges from 0 to 100, with readings above 80 indicating overbought conditions and below 20 indicating oversold conditions. Traders use the stochastic oscillator to identify potential trend reversals and confirm the strength of a trend.
Using these momentum indicators, you can gain valuable insights into the stock market and make informed trading decisions. Remember that no single indicator is foolproof, and it’s important to use a combination of indicators and other tools to analyze the stock market and identify profitable trading opportunities.
TrendSpider 4.8/5⭐: My Pick for AI-Power & Auto-Trading
I’ve used TrendSpider for 7 years for my research and testing. It auto-detects trendlines, patterns, and candlesticks, backtests ideas, and lets you use AI to create unique strategies and launch trading bots—with no code.

Save 38% on TrendSpider
Our Top Rated 4.72 ⭐ Trading Tool
✅ Leader in AI Trading & Chart Pattern Recognition
✅ Scanning & Auto-Trading
Deal Ends In:
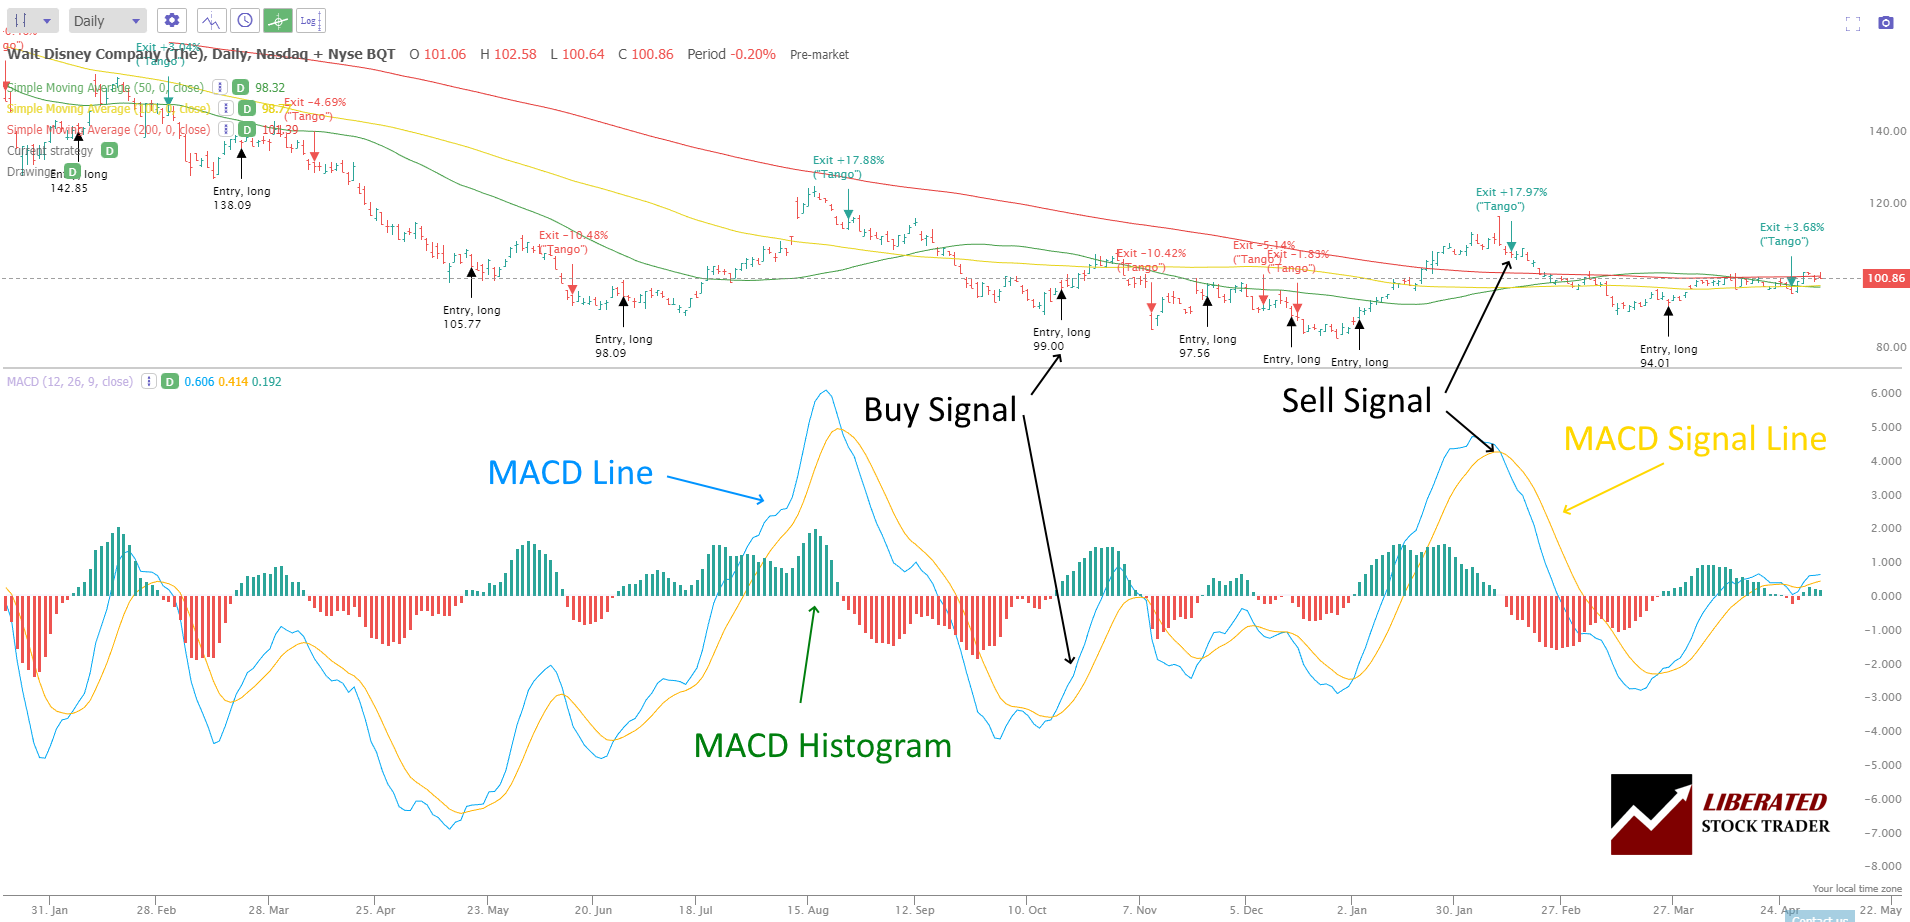
3. Moving Average Convergence Divergence (MACD)
Moving Average Convergence Divergence (MACD) measures the variance between two moving averages of a stock’s price. A positive MACD reading indicates that a stock’s short-term moving average is above its long-term moving average, which is a bullish signal. A negative MACD reading indicates the opposite.
Its a trend-following momentum indicator that uses moving averages to identify changes in stock price trends. It is calculated by subtracting the 26-day exponential moving average (EMA) from the 12-day EMA. A nine-day EMA of the MACD, referred to as the “signal line,” is then plotted on top of the MACD. Traders use the MACD to generate buy and sell signals and to confirm trend reversals.
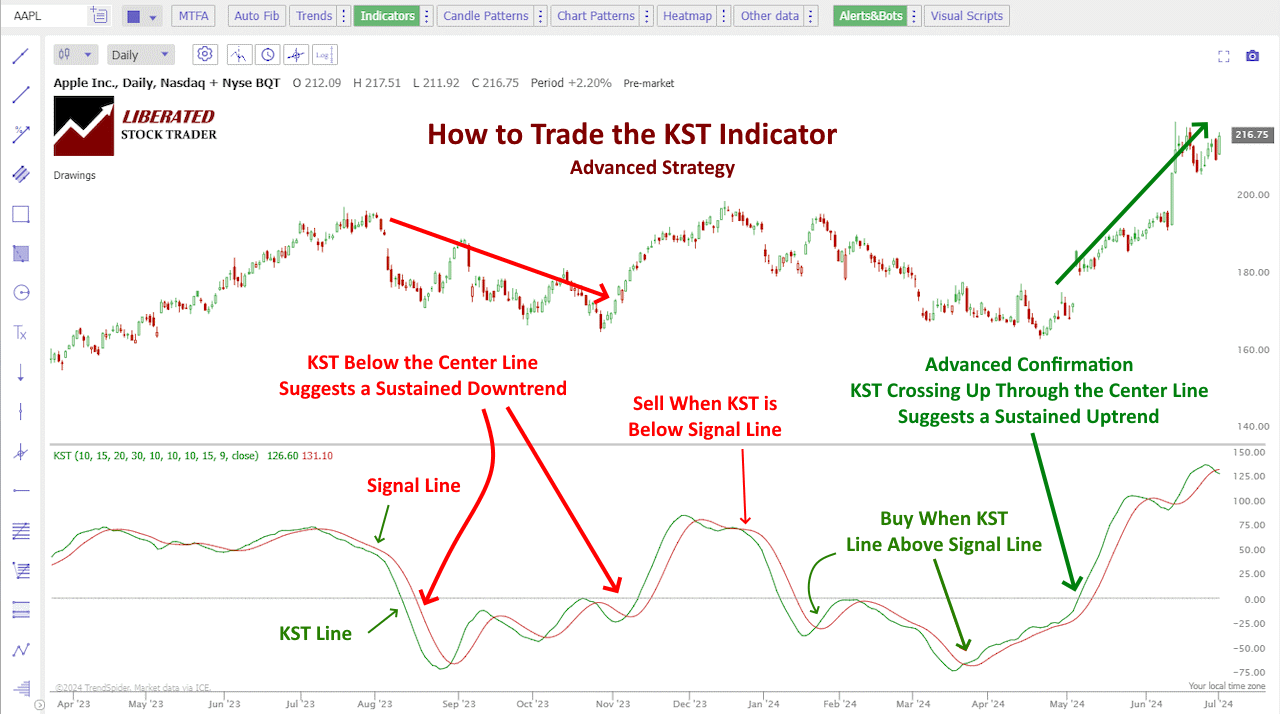
4. Know Sure Thing (KST)
The Know Sure Thing indicator is a composite indicator that combines four different time frames to provide a clearer picture of price momentum and identify buy and sell signals.
Traders utilize the KST oscillator by observing the relationship between the Green KST Line and the Signal Line. When the Green KST Line is above the Signal Line, it is a signal to buy, indicating a bullish trend. Conversely, when the Green KST Line falls below the Signal Line, it is a signal to sell, suggesting a bearish trend. By understanding the fundamentals of the KST oscillator and incorporating it into their trading systems, traders can make more informed decisions and improve their overall trading performance.
KST aggregates multiple rate-of-change calculations, providing a smoothed view of price trends while filtering out market noise.
My research on 2,746 test trades spanning ten years confirms that using the KST indicator’s default settings on daily and weekly charts provides profitable and reliable signals for traders.
By combining four timeframes, the KST effectively highlights the market’s prevailing directional bias.
Momentum Trading Tips
Momentum indicators are powerful tools that help traders identify the strength and direction of a trend. However, interpreting these indicators can be challenging for beginners. In this section, we will explore some key concepts to help you better understand how to interpret momentum indicators.
Overbought and Oversold Conditions
One of the most common ways to interpret momentum indicators is by looking for overbought and oversold conditions. When a stock is overbought, the price has risen too far, too fast, and is due for a pullback. Conversely, when a stock is oversold, the price has fallen too far, too fast, and is due for a rebound.
To identify overbought and oversold conditions, traders often use the relative strength index (RSI) or the stochastic oscillator. These indicators range from 0 to 100, with readings above 70 indicating overbought conditions and below 30 indicating oversold conditions.
Divergence
Another way to interpret momentum indicators is to look for divergence. Divergence occurs when the price of a stock moves in one direction while the momentum indicator moves in the opposite direction. This can signify that the trend is losing momentum and may be due for a reversal.
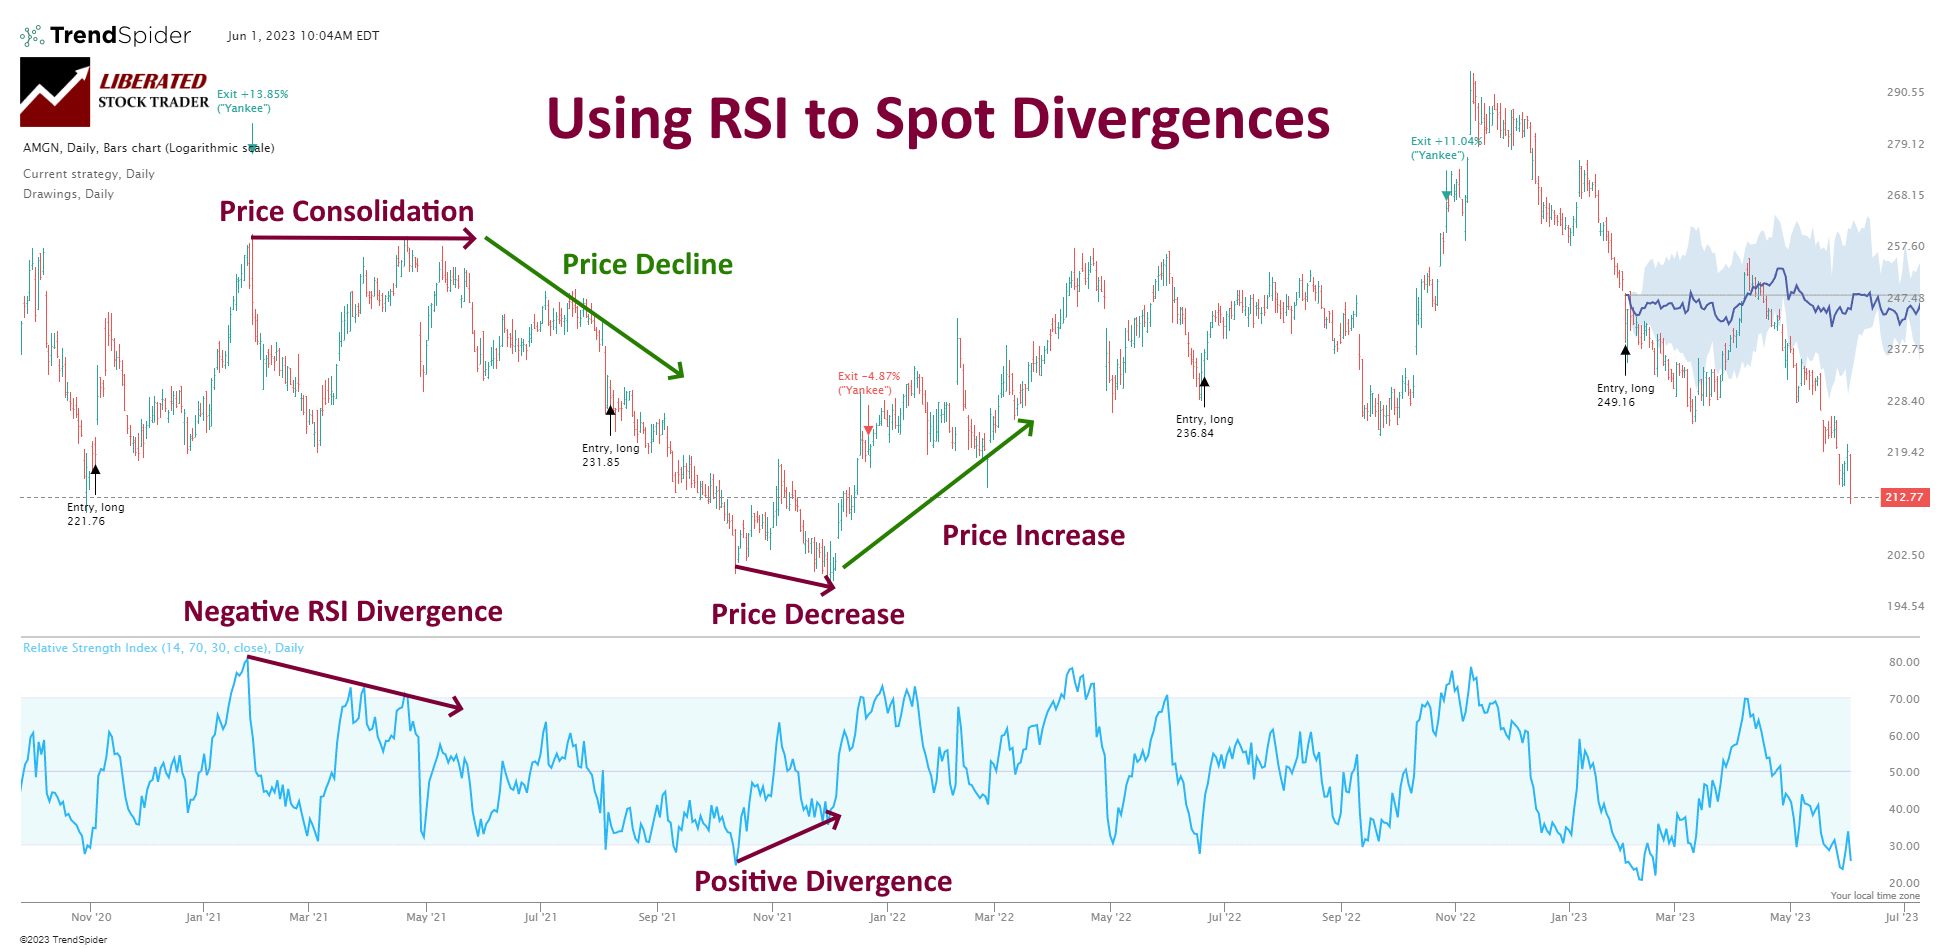
Chart Produced with TrendSpider
To identify divergence, traders often compare a stock’s price to the moving average convergence divergence (MACD) or the relative strength index (RSI). If the price is making higher highs, but the momentum indicator is making lower highs, it may be a sign of bearish divergence. Conversely, if the price is making lower lows, but the momentum indicator is making higher lows, it may be a sign of bullish divergence.
Centerline Crossovers
Finally, traders can interpret momentum indicators by looking for centerline crossovers. Centerline crossovers occur when the momentum indicator crosses above or below its centerline (usually set at 50). This can be a sign that the trend is changing direction.
To identify centerline crossovers, traders often use the moving average convergence divergence (MACD) or the relative strength index (RSI). If the MACD crosses above its centerline, it may signify a bullish trend. Conversely, if the MACD crosses below its centerline, it may signify a bearish trend. Similarly, if the RSI crosses above its centerline, it may signify a bullish trend, while a crossover below its centerline may signify a bearish trend.
In conclusion, momentum indicators can be powerful tools for traders, but interpreting them requires skill and experience. Understanding overbought and oversold conditions, divergence, and centerline crossovers can help you better interpret these indicators and make more informed trading decisions.
Trading Trends & Reversals
There are two main approaches to using momentum indicators in trading strategies: trend following and reversal trading. Both can be effective in different market conditions, and it’s important to understand their strengths and weaknesses.
Trend Following
Trend following is a popular approach that involves identifying the direction of the market trend and then entering trades in the same direction. Momentum indicators can be particularly helpful in identifying trends and determining whether they are strong or weak.
One common strategy is to use a moving average crossover, where you look for the shorter-term moving average to cross above or below the longer-term moving average. When the shorter-term average is above the longer-term average, it’s a bullish signal, indicating the trend is up. Conversely, when the shorter-term average is below the longer-term average, it’s a bearish signal, indicating that the trend is down.
Other momentum indicators that can be useful for trend following include the Relative Strength Index (RSI), the Moving Average Convergence Divergence (MACD), and the Average Directional Index (ADX).
Reversal Trading
Reversal trading is a strategy that involves identifying potential turning points in the market and entering trades in the opposite direction of the prevailing trend. This approach can be more challenging, requiring you to accurately predict when a trend is about to reverse.
Momentum indicators can help identify potential reversals, as they can give you insight into whether the market is overbought or oversold. For example, if the RSI is above 70, it’s a sign that the market may be overbought and due for a pullback. Conversely, if the RSI is below 30, it’s a sign that the market may be oversold and due for a bounce.
Other momentum indicators useful for reversal trading include the Stochastic Oscillator, ADX, the Williams %R, and the Commodity Channel Index (CCI).
In conclusion, momentum indicators can be powerful tools for stock traders, but using them correctly is important. By understanding the strengths and weaknesses of different momentum indicators and incorporating them into your trading strategies, you can increase your chances of success in the stock market.
Common Mistakes
As with any technical analysis tool, traders make common mistakes when using momentum indicators. Here are a couple of the most common mistakes you should avoid:
Ignoring Market Context
One of traders’ biggest mistakes when using momentum indicators is ignoring the market context. The market context includes overall market trends, news, and economic data. If you’re using momentum indicators in a vacuum, you will likely miss important market contexts that could impact your trades.
For example, you might be tempted to buy if you’re trading a stock in a downtrend for months and see a bullish signal on your momentum indicator. However, if there’s negative news about the company or the industry, that bullish signal might not be reliable.
Overreliance on Indicators
Another common mistake traders make is overreliance on indicators. While momentum indicators can be a useful tool, they’re not infallible. If you rely too heavily on indicators, you may miss important signals from other sources.
For example, if you only look at your momentum indicator and do not pay attention to price action or volume, you might miss important signals that could impact your trades. It is important to use momentum indicators in conjunction with other technical analysis tools and market context.
Avoiding these common mistakes can help you use momentum indicators effectively in your trading strategy. Always consider the bigger picture and use indicators as just one tool.
Benefits
Momentum indicators are powerful tools that can help you make better trading decisions. Here are some of the benefits of using momentum indicators:
- Identifying Trends: Momentum indicators can help you identify market trends. By analyzing the rate of change in prices, you can determine whether a trend is gaining or losing momentum. This can help you make more accurate predictions about future price movements.
- Timing Your Trades: Momentum indicators can help you time your trades more effectively. You can enter or exit a trade by identifying overbought or oversold conditions. This can help you maximize your profits and minimize your losses.
- Confirming Price Movements: Momentum indicators can confirm price movements in the market. If the price of a stock is going up and the momentum indicator is also going up, this confirms that the trend is strong. If the price is going up, but the momentum indicator is going down, this could be a sign that the trend is losing momentum and may soon reverse.
- Diversifying Your Portfolio: Momentum indicators can also help you diversify your portfolio. Using different momentum indicators, you can analyze the momentum of different stocks or assets. This can help you identify opportunities for diversification and reduce your overall risk.
Overall, momentum indicators are powerful tools to help you make better trading decisions. Using these indicators, you can identify trends, time your trades, confirm price movements, and diversify your portfolio.Limitations
Momentum indicators are useful tools for traders to identify potential market trends. However, traders should be aware of some limitations.
Conclusion
Momentum indicators are powerful tools in stock trading. They can help you identify trends and potential buying or selling opportunities. By analyzing price and volume data, you can gain insight into a stock’s price movement’s strength or weakness.
When using momentum indicators, it’s important to remember that they are just one piece of the puzzle. They should be used with other technical and fundamental analysis tools to make informed trading decisions.
Remember always to use caution and manage your risk when trading. No indicator or strategy is foolproof, and the market can be unpredictable. However, incorporating momentum indicators into your trading strategy can increase your chances of success and help you make more informed decisions.
Overall, momentum indicators can be valuable to any trader’s toolkit. With practice and experience, you can learn to interpret and use these indicators effectively to improve your trading performance.
FAQ
What are popular momentum indicators in stock trading?
There are many types of momentum indicators used in stock trading. Still, the most common ones include the Relative Strength Index (RSI), Moving Average Convergence Divergence (MACD), and Stochastic Oscillator. These indicators help traders identify the strength and direction of a stock's price movement.
How can you identify momentum stocks for intraday trading?
You can use technical analysis tools like volume, moving averages, and trend lines to identify momentum stocks for intraday trading. You can also look for stocks with high relative strength and positive momentum indicators.
What is the formula for calculating momentum indicators?
The formula for calculating momentum indicators varies depending on the specific indicator used. For example, the RSI is calculated by dividing the average gain of the stock by the average loss over a specific period and then converting the result into a value between 0 and 100.
How is momentum used in trading?
Momentum is used in trading to identify stocks with strong price movements and profit potential. Some best practices for using momentum in trading include using multiple indicators to confirm trends, setting stop-loss orders to limit losses, and avoiding trading solely based on momentum indicators.
What is the squeeze momentum indicator?
The squeeze momentum indicator helps traders identify periods of low volatility and predict potential breakouts in a stock's price movement. Traders can use this indicator to enter or exit trades based on the stock's momentum and volatility levels.
What types of momentum indicators are available for traders?
There are several types of momentum indicators, including the Relative Strength Index (RSI), the Moving Average Convergence Divergence (MACD), the Average Directional Index (ADX), the Commodity Channel Index (CCI), and the Stochastic Oscillator.
How can momentum indicators help traders identify key trends?
Answer: Momentum indicators can help traders identify key trends by assessing the strength of a stock’s price movements over a period of time. By looking at the velocity of a stock’s price changes, traders can make informed decisions about when to enter or exit a trade.
Are there risks associated with using momentum indicators?
Yes, momentum indicators can help traders identify potential trends, but they are not usually more than 60% accurate, according to our indicator research. As such, traders should always use caution when using momentum indicators and should factor in other indicators and market conditions to help them make the best decisions.