
TradingView is the better overall platform, scoring 4.75/5 versus TC2000’s 4.30/5 in my 58-point lab test.
Choose TradingView if you want global markets, better charting depth, Pine Script, backtesting, broker choice, community, and broader asset coverage.
Choose TC2000 if you mainly trade US stocks and options and prioritize fast scanning, desktop workflows, options execution, and customer support.
TC2000 vs TradingView: Lab Verdict
TradingView wins my head-to-head lab test against TC2000, scoring a higher Lab Performance Score of 4.75. My lab results show TradingView is the stronger choice for international trading, charting, community, backtesting, and pattern recognition.
TC2000’s 4.30 still places it above the median of all tools tested; its biggest strengths are US market scanning, options trading, and broker integration.
Both platforms are easy to use, but TradingView offers the deeper ecosystem, better price-to-feature balance, and stronger tools for building and testing trading strategies.
Which Should You Choose?
| If you need… | Winner |
|---|---|
| Best overall platform | TradingView |
| Global markets | TradingView |
| Charting | TradingView |
| Backtesting | TradingView |
| Trading community | TradingView |
| Broker choice | TradingView |
| US stock scanning | TC2000 |
| Options workflow | TC2000 |
| Desktop multimonitor use | TC2000 |
| Customer support | TC2000 |
| Lowest-cost entry | TradingView |
TradingView vs TC2000: Category Winners
TradingView wins the overall comparison because it offers broader market coverage, deeper charting, stronger backtesting, more broker integrations, and a much larger scripting and community ecosystem. TC2000 still wins several important specialist categories, particularly US stock scanning, options workflows, desktop trading, and customer support.
| Category | Winner | Why |
|---|---|---|
| Overall Platform | TradingView | Higher overall lab score of 4.75 vs. TC2000 4.30, with broader capabilities and market coverage. |
| Charting & Technical Analysis | TradingView | Wins 5.00 vs. 3.78 with deeper charting, Pine Script, more chart types, and stronger customization. |
| Scanning & Screening | TradingView | Wins the overall scanning benchmark 4.83 vs. 4.32, with broader technical and fundamental screening across more markets. |
| US Stock Scanning | TC2000 | TC2000 is exceptionally fast and flexible for US technical stock scans, watchlists, and PCF-based conditions. |
| Backtesting | TradingView | Wins decisively 4.19 vs. 0.00 because TradingView includes a true rules-based strategy testing environment. |
| AI, Algos & Bots | TradingView | Wins 4.00 vs. 1.50 with Pine Script, alerts, webhooks, automation, and a broader algorithmic ecosystem. |
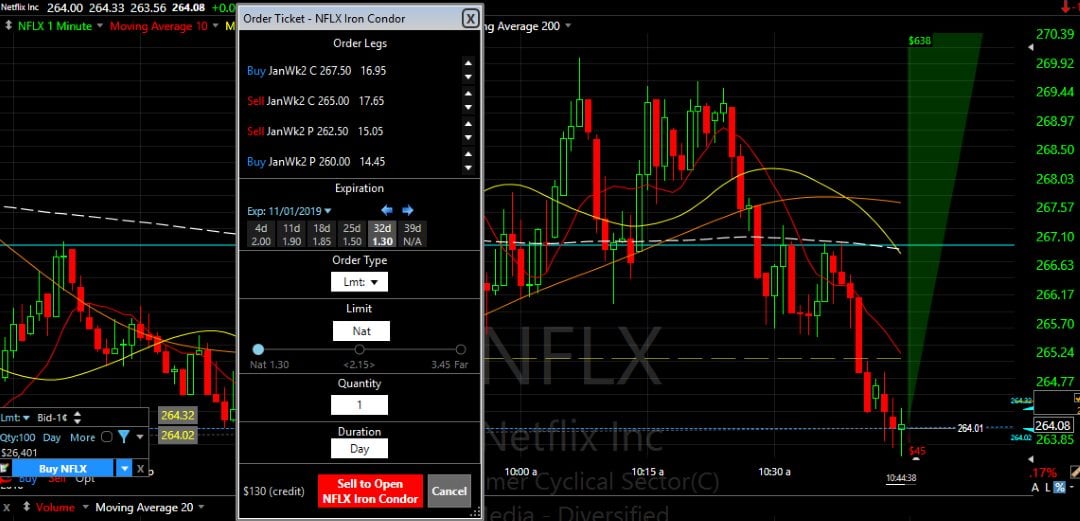
| Options Trading | TC2000 | TC2000 provides the more specialized US options workflow, including strategy charting and tightly integrated brokerage execution. |
| Global Markets | TradingView | TradingView supports stocks, forex, futures, crypto, and exchanges worldwide, while TC2000 is primarily focused on US markets. |
| Broker Connectivity | TradingView | Wins 5.00 vs. 2.73 with a much broader range of integrated brokers and asset classes. |
| Speed & Ease of Use | TradingView | Narrowly wins 5.00 vs. 4.83, although both platforms performed exceptionally well. |
| Community | TradingView | Wins 5.00 vs. 3.50 with shared indicators, strategies, charts, scripts, and trade ideas. |
| Customer Support | TC2000 | Wins 5.00 vs. TradingView 3.25, with stronger access to responsive human support. |
| Financial News | TC2000 | Narrowly wins 3.50 vs. TradingView 3.00 in my lab testing. |
| Value for Money | TradingView | TradingView combines a lower entry price with more markets, backtesting, scripting, community features, and broker integrations. |
| Day Trading | TC2000 for US stocks; TradingView overall | TC2000 is excellent for dedicated US stock and options traders, while TradingView is more versatile across markets, brokers, scripting, and testing. |
| Swing Trading | TradingView | Better overall for multi-day setups because of stronger charting, alerts, backtesting, Pine Script, and broader screening. |
Overall Lab Results
The biggest separation is feature breadth. TradingView supports stocks, ETFs, forex, futures, crypto, global exchanges, Pine Script, community scripts, strategy testing, and integrated broker connections.
TC2000 is more focused: it offers excellent US stock and options charting, fast scans, and practical trade execution, but it does not match TradingView’s global ecosystem or the depth of strategy development. In my testing, TradingView is the better all-round platform, while TC2000 is best for traders who want a focused US market scanner and options-capable trading workstation.
This comparison is based on my independent 58-point benchmark tests of both platforms, not vendor feature lists.
The decision is therefore not simply that TradingView is better at everything. TradingView is the stronger all-round platform, while TC2000 remains highly competitive for traders focused specifically on US stocks, options, rapid scanning, desktop workflows, and customer support.
TradingView Lab Results
TradingView is the world’s premier trading platform, trusted by over 20 million active traders. It offers a seamless blend of powerful charting tools, advanced screening features, and in-depth analysis, covering a wide range of assets, including stocks, indices, ETFs, and cryptocurrencies.
| Test | Tier | Score | Average |
|---|---|---|---|
| Composite Lab Performance Score | AAA | 4.75 | 4.21 |
| Pricing Index: $ per Day | AA | $1.97 | $2.74 |
| Value Score (VP) | AA | 4.37 | 2.82 |
| Speed & Ease of Use | AAA | 5.00 | 4.50 |
| Chart Analysis Depth Index | AAA | 5.00 | 3.17 |
| Chart Pattern Depth & Accuracy | B | 3.98 | 2.73 |
| Scanning Performance | AAA | 4.83 | 3.38 |
| Backtesting Performance | A | 4.19 | 3.38 |
| Trading Bot & Auto-Trading Reliability | B | 3.50 | 2.50 |
| AI & Algo Index | A | 4.00 | 2.00 |
| Alert Speed | AA | 4.67 | 3.67 |
| Trade Signal Quality | C | 2.50 | 0.00 |
| Broker Connectivity & Ecosystem Depth | AAA | 5.00 | 1.55 |
| Portfolio Tool Performance | B | 3.60 | 2.80 |
| Financial News Speed & Depth | B | 3.00 | 2.30 |
| Community Utility Index (CUI) | AAA | 5.00 | 3.25 |
| Support Infrastructure & SLA Audit | B | 3.25 | 3.75 |
Tested using benchmarking system v3.
See the 2026 v3 58-point TradingView test and benchmarks.
Pros
✔ 20 million users sharing ideas
✔ AAA Speed & ease of use
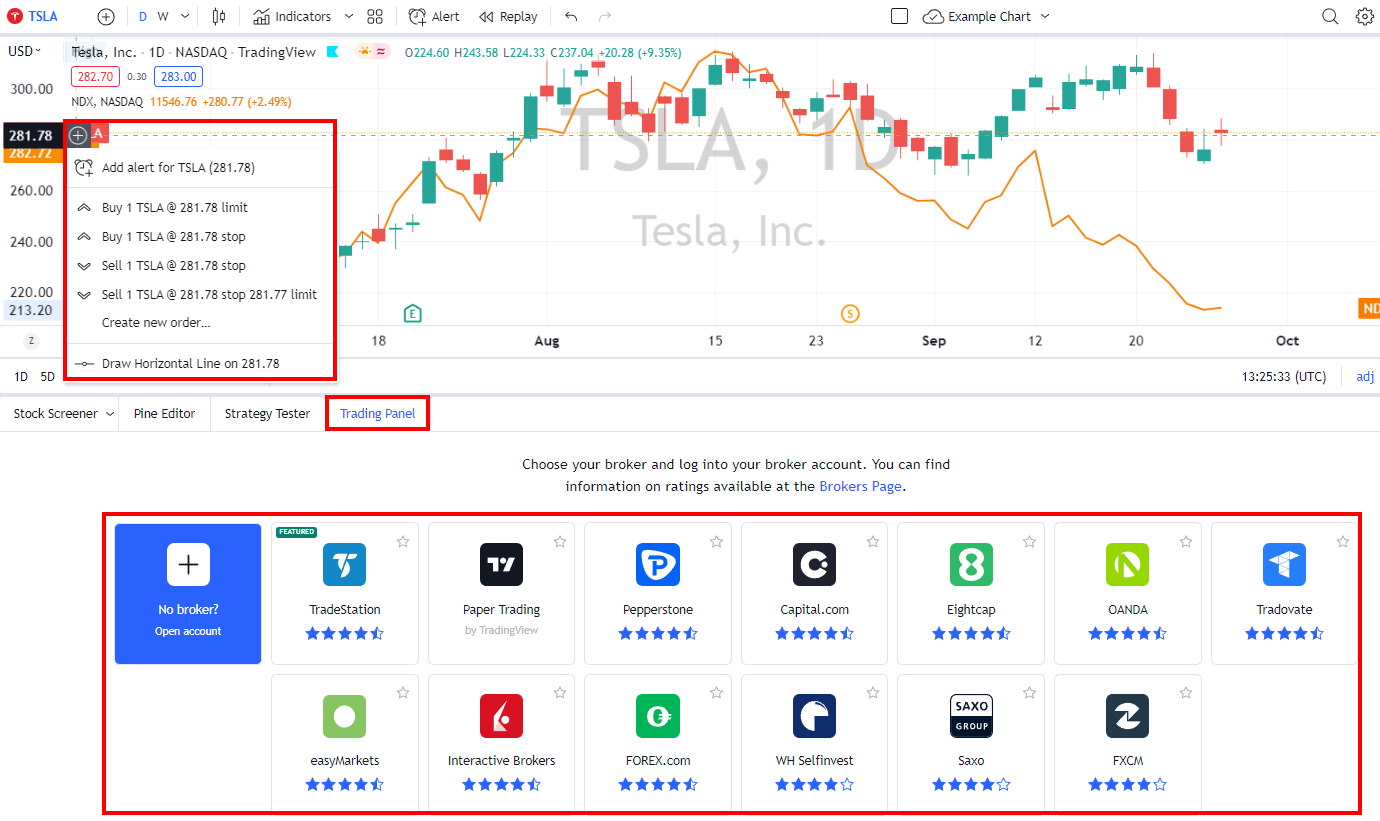
✔ Trading from charts
✔ Powerful screening and technical analysis
✔ All stock exchanges globally
✔ AAA Broker connectivity and asset coverage
✔ 100,000+ user-generated strategies
✔ Free and low-cost plans
✔ Flexible backtesting with Pine Script
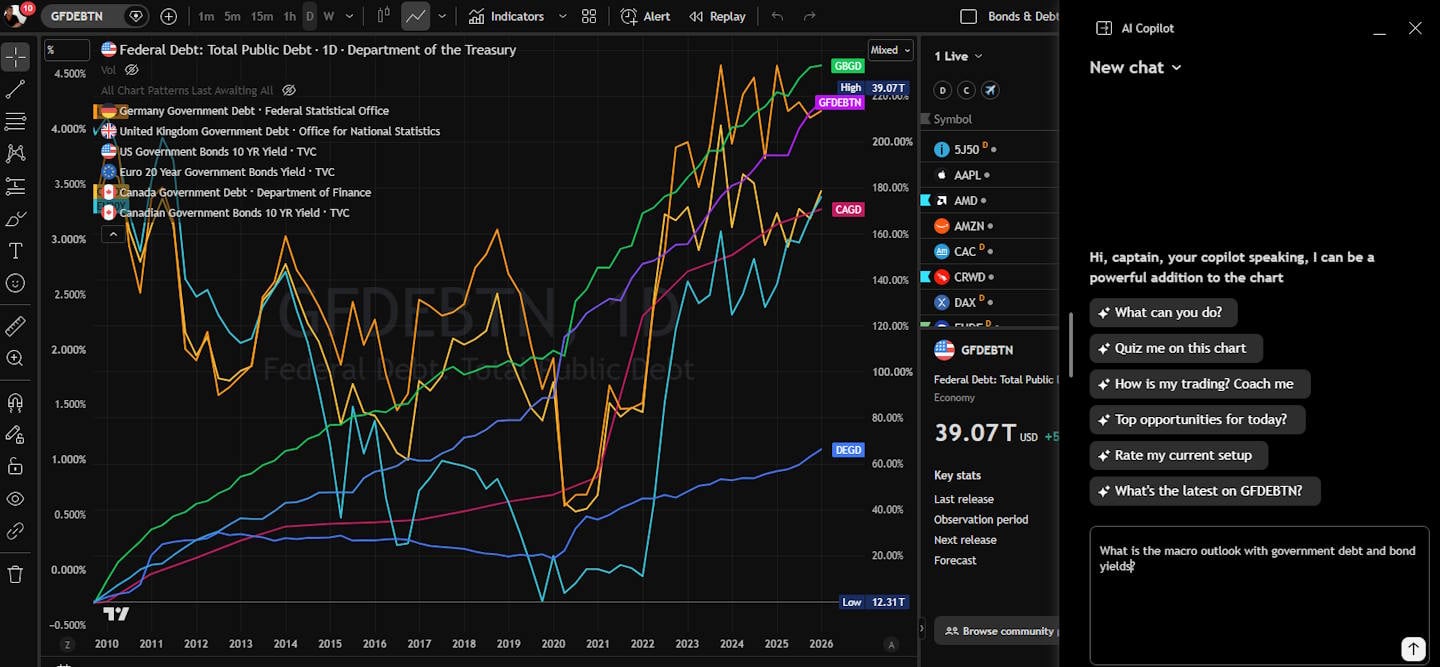
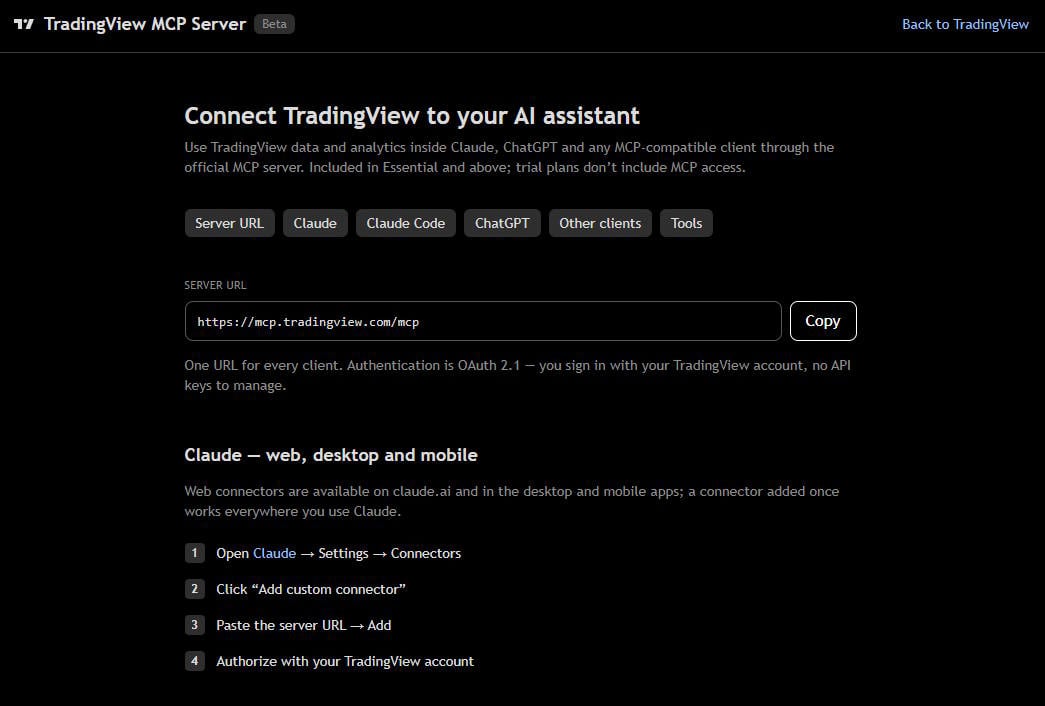
✔ New ChatBot & AI MCP Servers
Cons
✘ Not ideal for value or dividend investors
✘ Coding skills required for backtesting and custom indicators
✘ Average portfolio tools

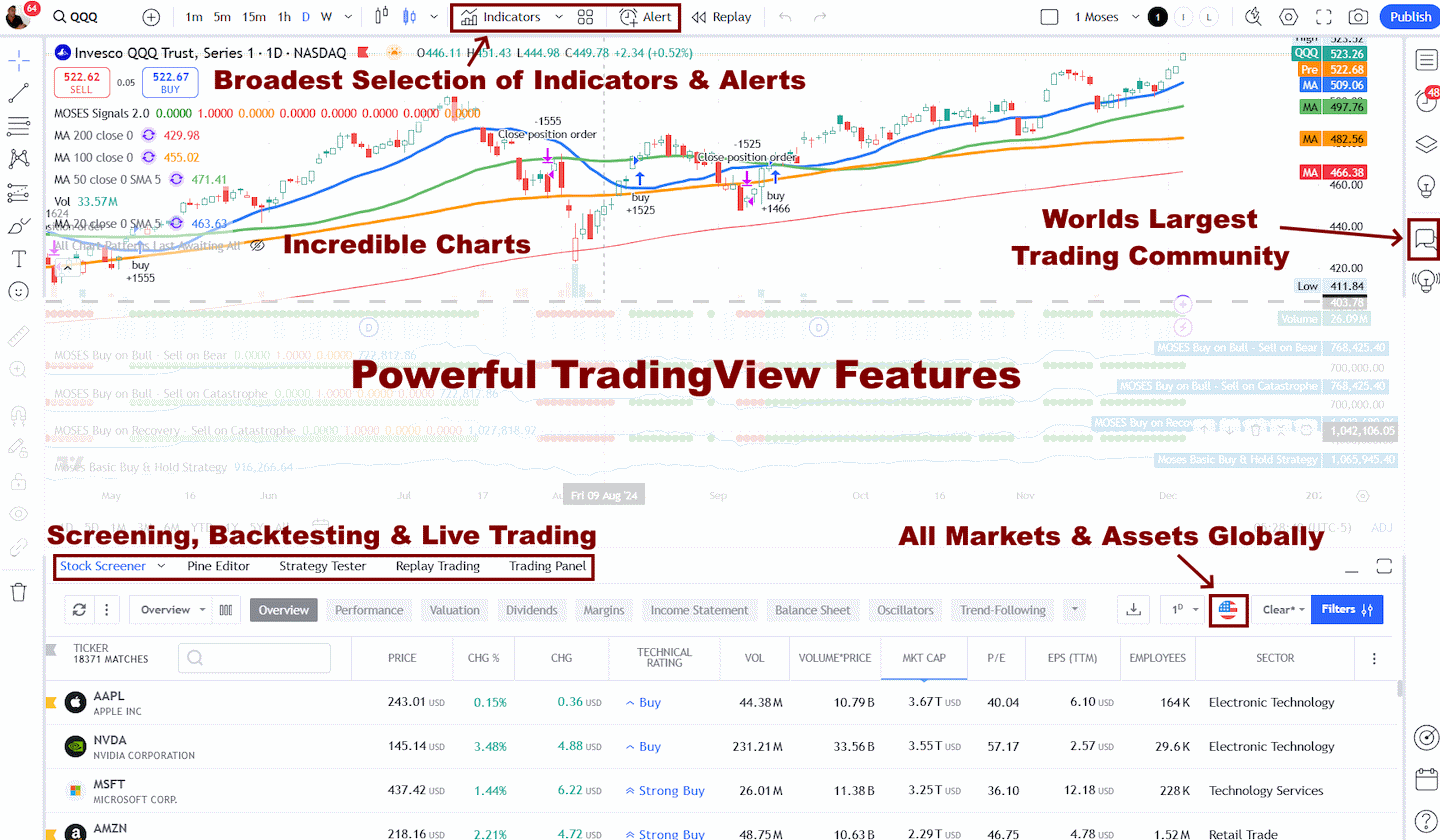
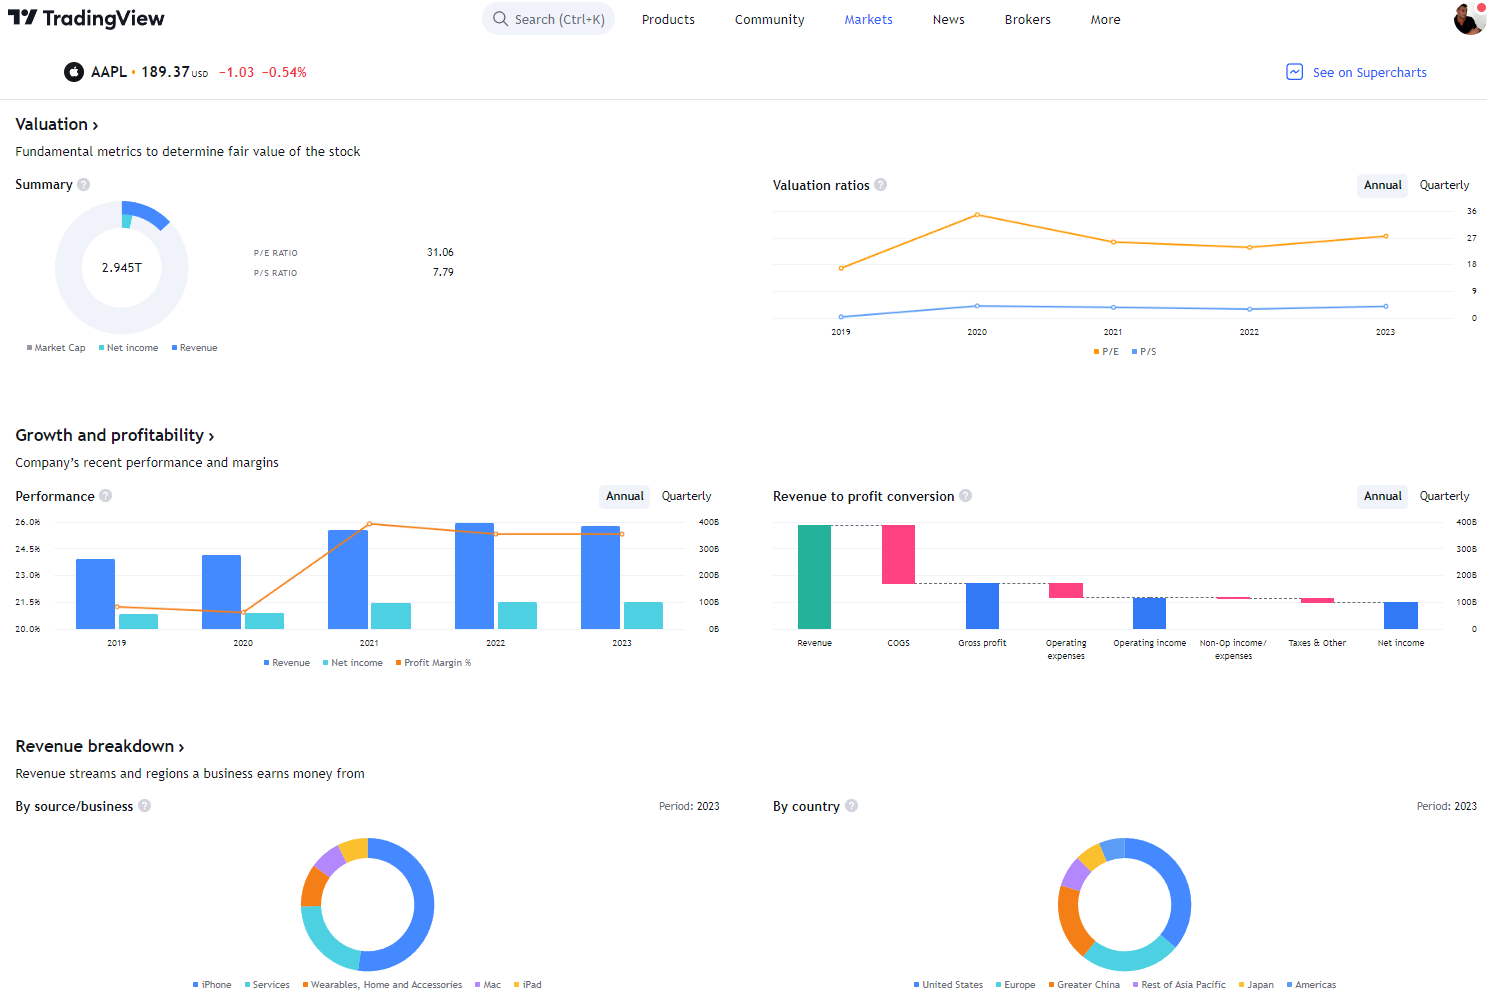
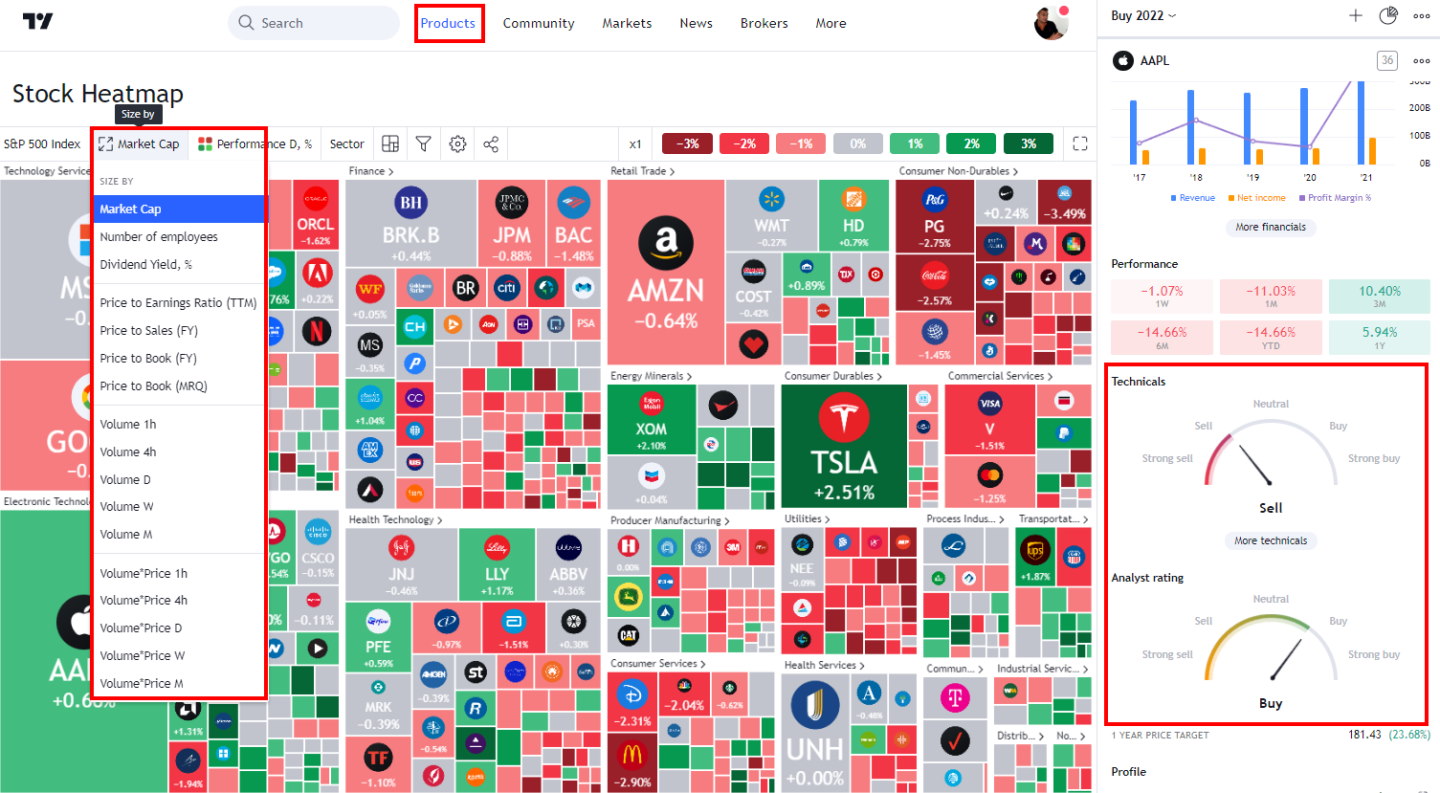
TradingView provides best-in-class technical analysis tools to analyze financial markets. It offers heatmaps, super charts, indicators, strategy development tools, and backtesting capabilities.
Its vibrant community of traders shares ideas, strategies, and custom indicators, making it an invaluable resource for learning and collaboration.

TC2000 Lab Results
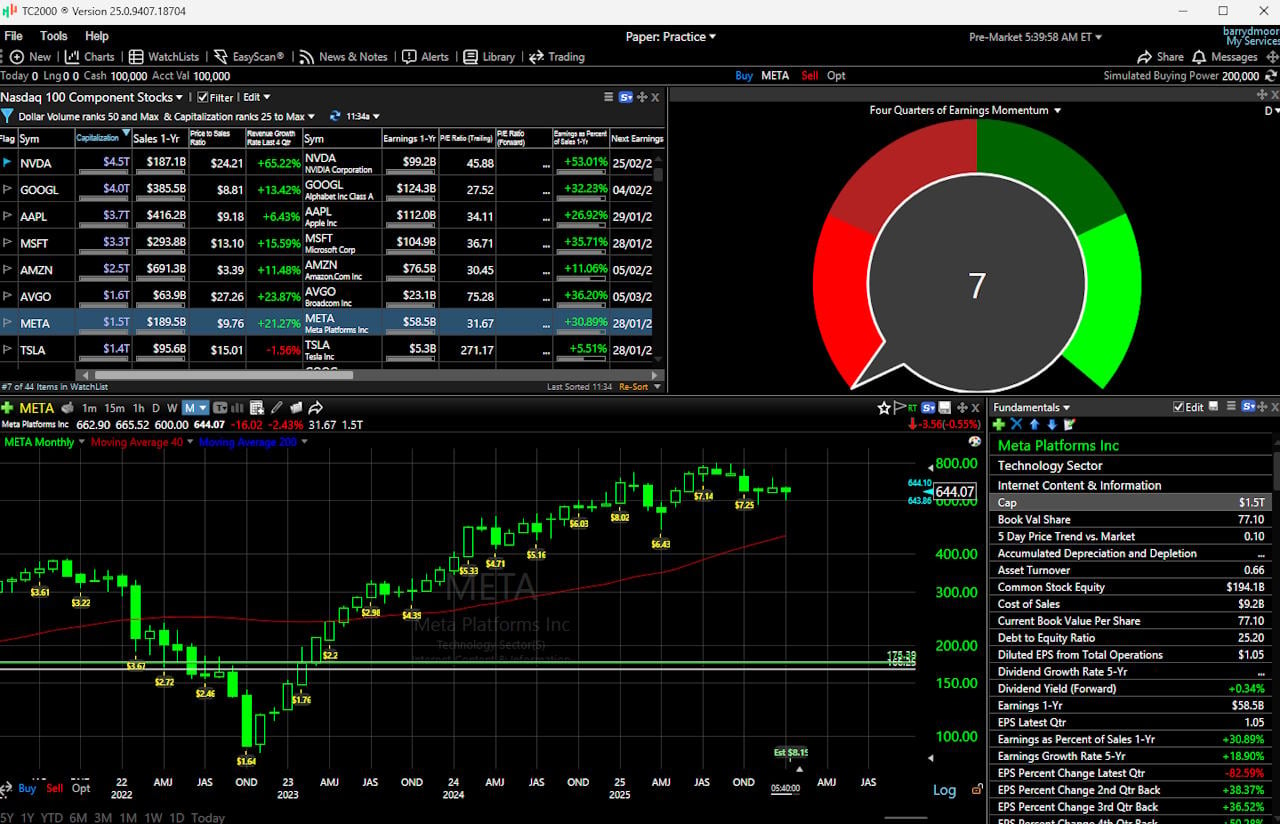
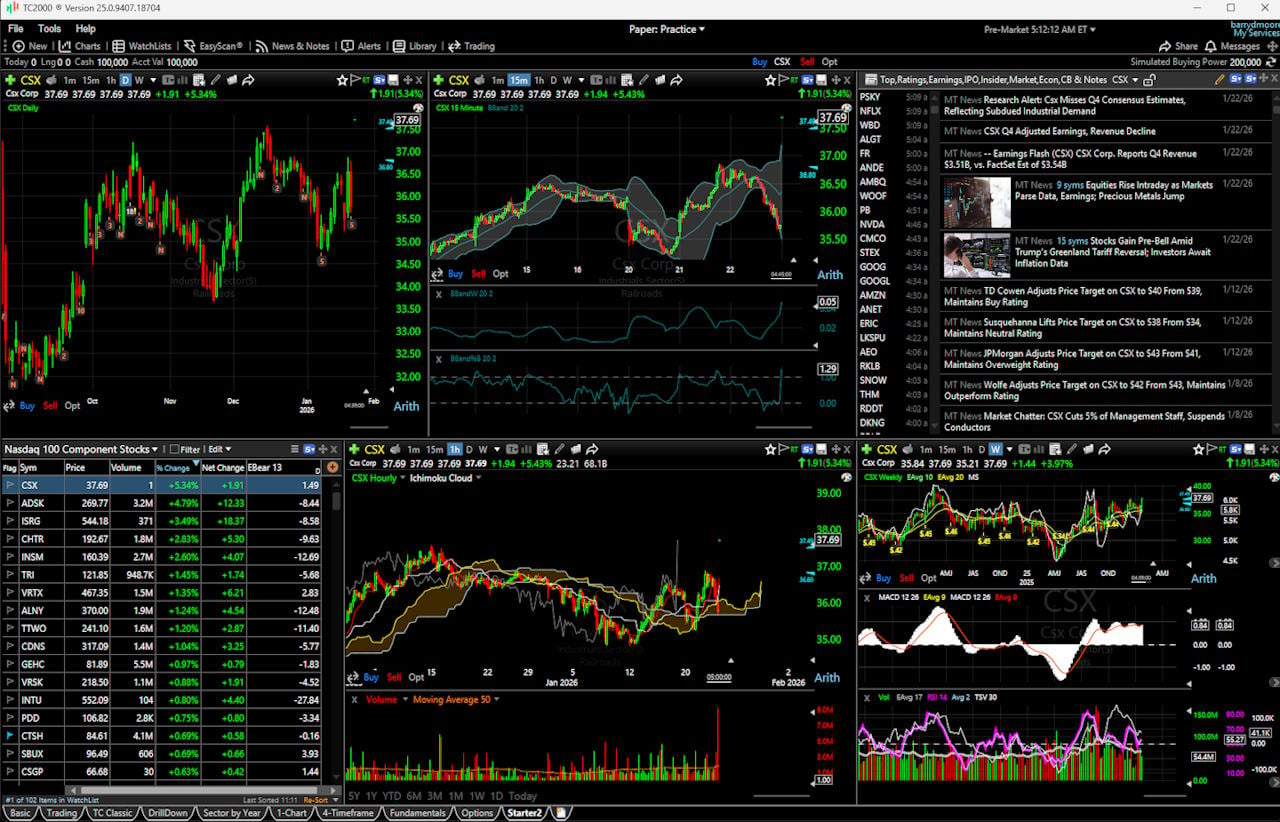
My testing of TC2000 highlights its impressive real-time stock scanning, advanced charting, and customizable indicators, making it a powerful tool for US stock and options traders. It also offers seamless broker integration with TC2000 Brokerage and sophisticated technical analysis features, such as options strategy charting and trade execution.
| Test | Tier | Score | Average |
|---|---|---|---|
| Lab Test Composite Score | AA | 4.30 | 4.21 |
| Pricing Index $/day | AA | $2.74 | $2.74 |
| Value Score (VP) | B | 3.39 | 2.82 |
| Speed & Ease of Use | AAA | 4.83 | 4.50 |
| Chart Analysis Depth Index | B | 3.78 | 3.17 |
| Chart Pattern Depth & Accuracy | C | 2.58 | 2.73 |
| Scanning Performance | AA | 4.32 | 3.38 |
| Backtesting Performance | C | 0.00 | 3.38 |
| Trading Bot & Auto-Trading Reliability | B | 3.00 | 2.50 |
| AI & Algo Index | C | 1.50 | 2.00 |
| Alert Speed | A | 4.00 | 3.67 |
| Trade Signal Quality | C | 0.00 | 0.00 |
| Broker Connectivity & Ecosystem Depth | C | 2.73 | 2.00 |
| Portfolio Tool Performance | C | 2.90 | 2.80 |
| Financial News Speed & Depth | B | 3.50 | 2.30 |
| Community Utility Index (CUI) | B | 3.50 | 3.25 |
| Support Infrastructure & SLA Audit | AAA | 5.00 | 3.75 |
Tested using rating system v3.
See the 2026 v3 58-point TC2000 test and benchmarking.
Pros
✔ Excellent US Customer Support
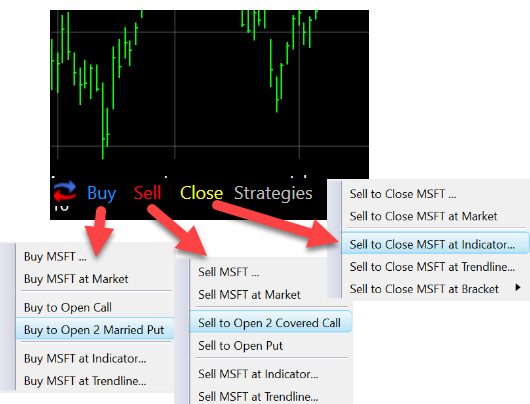
✔ Trade Stocks & Options From Charts
✔ Broad Selection of Charts & Indicators
✔ Options Strategies & Live Trading
✔ Real-time Entire Market Scanning
✔ Great Usability & Simple Setup
✔ AAA Support & SLA
✔ Free for TC2000 Brokerage Users
Cons
✘ Limited Social Community
✘ Limited Pattern Recognition
✘ No Backtesting
✘ $1 per trade with TC2000 Brokerage
✘ No AI Trading Features

However, TC2000 falls short in its backtesting capabilities and in the advanced AI trading features offered by platforms like TrendSpider and Trade Ideas. It lacks cutting-edge tools such as AI stock trading and pattern recognition, which provide traders with a significant advantage.
TC2000, much like TradingView, delivers great stock charting and a wide variety of indicators, but TradingView stands out with its social community of 100 million users, 20 million of whom actively share and contribute ideas.
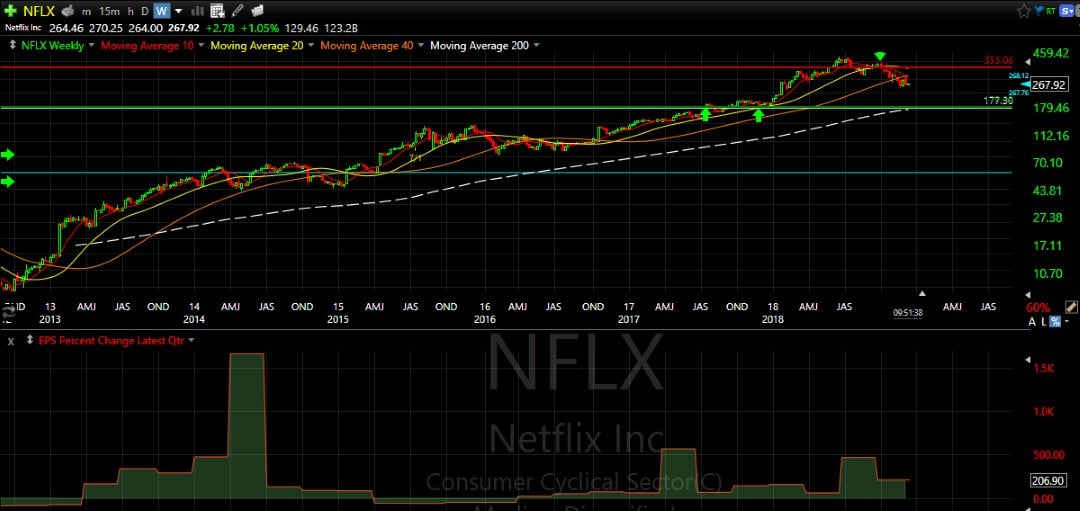
Feature Comparison
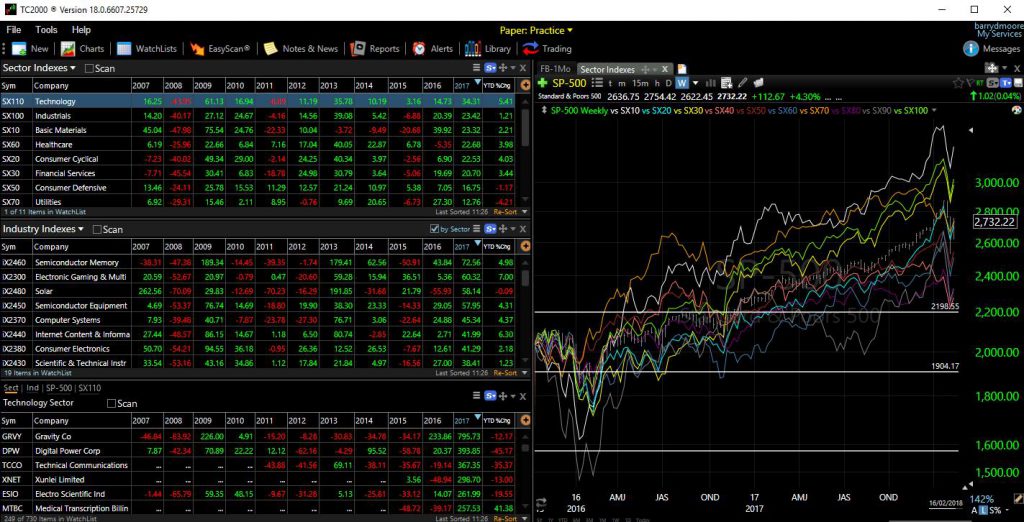
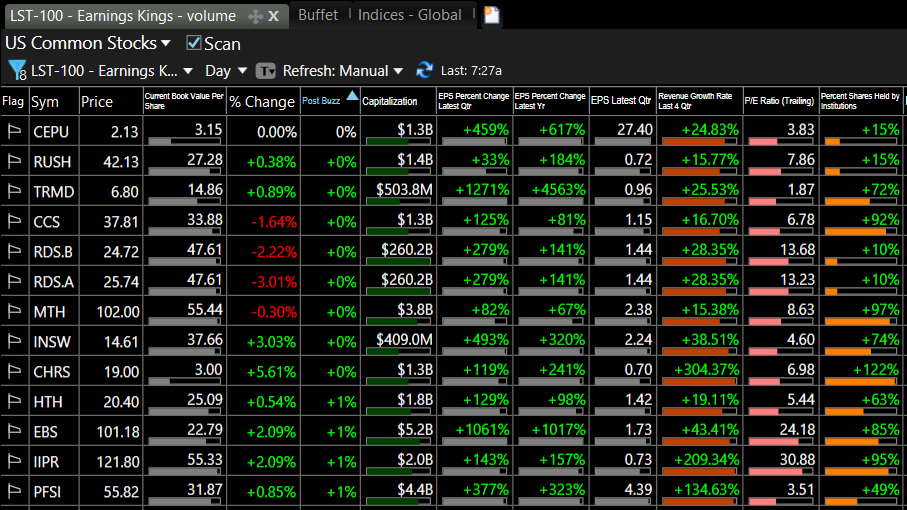
TradingView’s broader feature set is the main difference versus TC2000. TC2000 is highly effective for US stock and options traders who want fast scanning, charting, watchlists, and integrated execution.
TradingView offers a comprehensive platform that combines charting, screening, backtesting, scripting, broker integrations, community tools, and support for stocks, forex, futures, crypto, and global exchanges.
TradingView features a news stream and a social community of 100 million users who share charts and ideas. TC2000 has no news or social component.
| Features | TradingView |
|---|---|
| ⚡ Features | Charts, News, Watchlists, Screening |
| 🏆 Unique Features | Trading, Backtesting, Community |
| 🎯 Best for | Stock, FX, Futures & Crypto Traders |
| ♲ Subscription | Monthly, Yearly |
| 💻 OS | Web Browser, PC |
| 🎮 Trial | Free 30-Day |
| 🌎 Market Data | Global |
| 📒 In-depth Review | TradingView Review |
Both platforms are strong in stock charting and technical analysis, but their focus differs. TC2000 is primarily designed for US equities and options, while TradingView supports multiple asset classes and international markets.
TradingView also adds Pine Script, strategy testing, shared indicators, trade ideas, and a large global trading community, giving it a clear advantage for traders who want a broader ecosystem rather than a specialized US-focused workstation.
TradingView offers news, a social community, backtesting, and screening for stocks, forex, futures, and crypto globally, while TC2000 does not.
| Features | TC2000 |
|---|---|
| ⚡ Features | Charts, Watchlists, Screening |
| 🏆 Unique Features | Options Scanning & Trading |
| 🎯 Best for | Stock & Options Traders |
| ♲ Subscription | Monthly, Yearly |
| 💻 OS | Web Browser, PC |
| 🎮 Trial | Free 30-Day |
| 🌎 Market Data | USA, Canada |
| 📒 In-depth Review | TC2000 Review |
Both platforms are stable, responsive, and easy to use. TC2000 remains particularly strong for focused US stock and options workflows, while TradingView delivers more overall functionality and market coverage at a lower entry price.
Pricing
TradingView and TC2000 offer free access to their platforms; however, TradingView’s free service has more functionality than TC2000’s. TradingView offers free scanning and screening, backtesting, watchlists, and Candlestick chart recognition; with TC2000, scanning and watchlists are disabled.
TradingView Pricing
TradingView pricing starts at $0 for the Basic, ad-supported plan, which includes ad-supported screening, charting, trading, scripting, backtesting, and three indicators per chart. The Free plan is a great way to test the service.
TradingView Essential costs $12.95/mo on an annual plan and is ad-free. It includes two charts per layout, five indicators per chart, and 20 alerts. It is ideal for beginners and also enables access to the full social network.
The annual Plus Plan at $29.95/mo adds four charts per tab, 100 alerts, and advanced Renko, Kagi, Point & Figure, and Line Break charts.
I personally use TradingView Premium at $59.95/mo annually; it offers the optimal balance of price and key functionality: 25 indicators per chart, 400 alerts, and, most importantly, automated chart pattern recognition.
It is designed for intermediate and advanced-level traders who seek the optimal balance between functionality and price.
See our TradingView Pricing Guide for further details and discounts.
✂ TradingView Discounts
Sign up for an annual Pro or Premium plan, and TradingView will offer you a 16% discount. Find out more in my dedicated TradingView discounts guide.
TC2000 Pricing
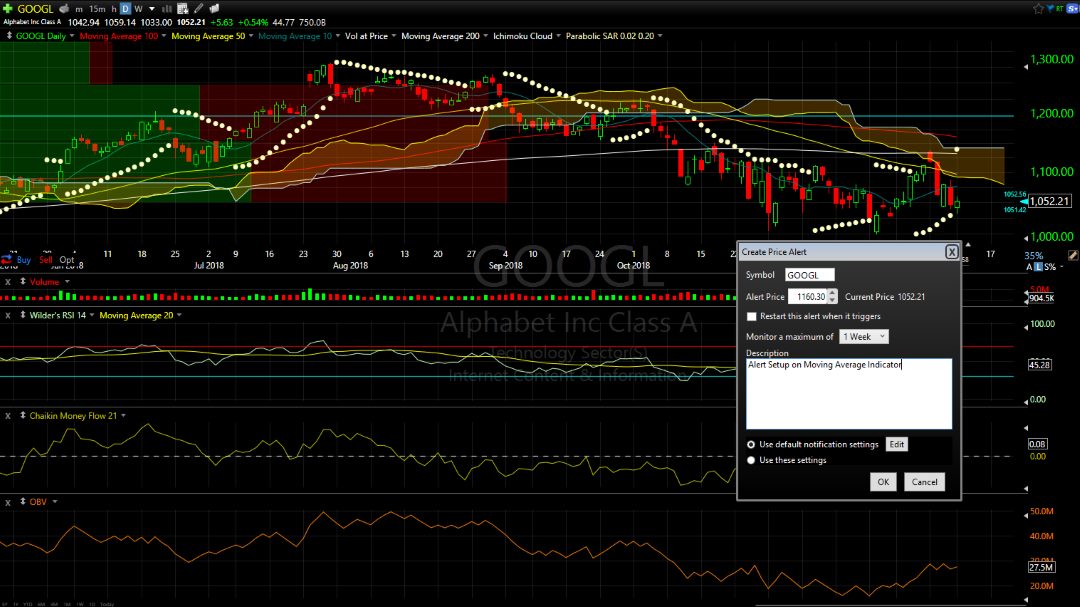
TC2000 is free for charts and trendlines, but the restrictions make it unusable. The Basic service costs $24.99 monthly and unlocks indicators, watchlists, and paper trading. Premium costs $49.99 per month and includes scanning, multiple monitors, chart drawing tools, and alerts.
Premium+ is priced at $99.99 per month, including $9.99 per month for data, which is the Effective Monthly Cost (EMC). It includes 1,000 alerts and real-time market pulse gauges.
The minimum plan to use is Premium, since Basic lacks too much functionality.
✂ TC2000 Discounts
My partnership with TC2000 enables us to offer a $25 discount on your first purchase. You can also combine it with a bi-annual subscription, which saves an additional 25%. Additionally, you will receive ebooks and training discounts worth $199 from LiberatedStockTrader.com via email. Claim your TC2000 Bonuses.
Chart & Technical Analysis
TradingView wins chart analysis 5.00 vs. 3.78 for TC2000.
TradingView’s advantage comes from its deeper charting, broader range of chart types, Pine Script extensibility, automated pattern tools, and global multi-asset coverage. TC2000 remains excellent for fast US stock workflows, customizable indicators, and formula-driven charts, but TradingView is the stronger overall technical-analysis platform.
TradingView’s advantage is breadth plus extensibility: 21 chart types, 400 indicators, 5.00 chart depth, 5.00 indicator depth, and 5.00 custom indicator coding through Pine Script.
TC2000 is still strong, especially for a U.S.-focused desktop platform: it offers 7 chart types, 170 indicators, 4.25 indicator depth, and 5.00 custom indicator coding, but its chart-type depth is lower at 2.10. In practical terms, TradingView is the better platform for broad technical experimentation, while TC2000 is better for stable, efficient, formula-driven charting.
TradingView offers specialty charts such as LineBreak, Kagi, Heikin Ashi, Point & Figure, and Renko. TC2000 has seven chart types, including Candlesticks and Heiken Ashi.

TradingView offers 65 drawing and annotation tools, including capabilities unavailable on other platforms, such as extensive Gann & Fibonacci tools and hundreds of icons for your charts, notes, and ideas. TC2000 offers 28 different chart annotation tools.
TradingView’s unique and innovative Buy and Sell gauges save you time by providing an instant readout of which stocks are bullish, bearish, or neutral; TC2000 does not have this functionality.
TradingView’s stock indicator ratings are well implemented, with two critical technical analysis indicators: price-based moving averages and price- and volume-based oscillators. Based on my observations, the TradingView buy and sell indicators are a good measure of sentiment and are featured in my Fear & Greed Index Dashboard.
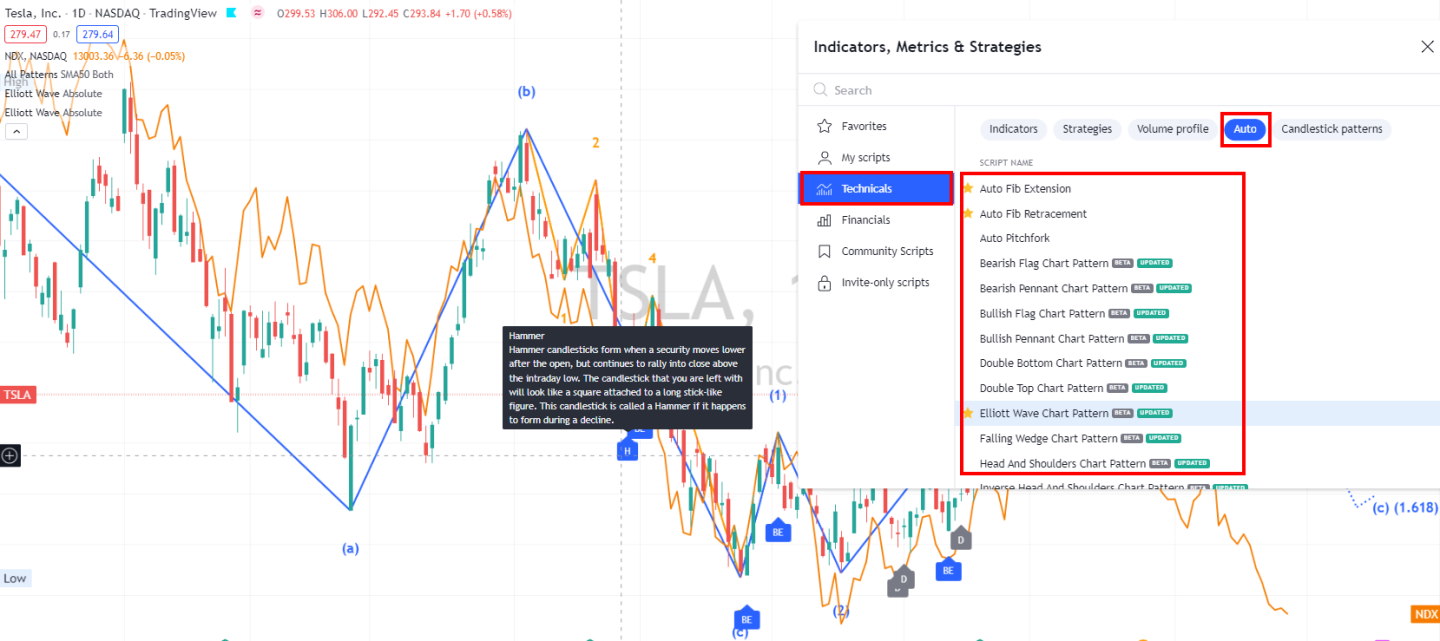
TradingView clearly wins Chart Pattern Depth & Accuracy, scoring 3.98. TradingView recognized 97 total patterns, including 44 candlestick patterns and 53 chart price/trend patterns, with 95% tested accuracy and a 4.75 pattern accuracy score.
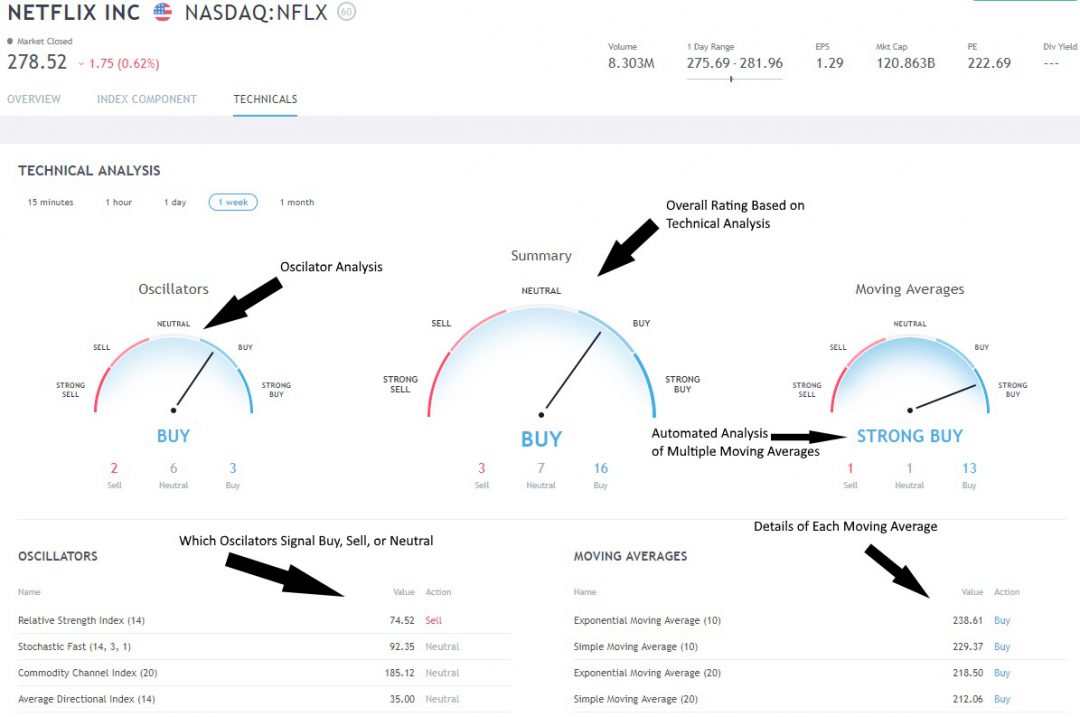
The left gauge shows the oscillating indicators, such as Relative Strength, Stochastics, and the Average Directional Index. On the right, you have a selection of Moving Averages, Simple, Exponential, and even Ichimoku Cloud.
TC2000 recognized only 20 total patterns, all candlestick-based, with 0 chart price/trend patterns; however, its tested accuracy is still respectable at 90%, giving it a 4.50 accuracy score. So TC2000’s weakness is not reliability—it is pattern breadth. TradingView is better for automated pattern discovery and visual pattern workflows; TC2000 is better for traders who scan conditions first and then manually confirm setups.
Scanning & Screening
TradingView wins scanning and screening 4.83 vs. 4.32 for TC2000.
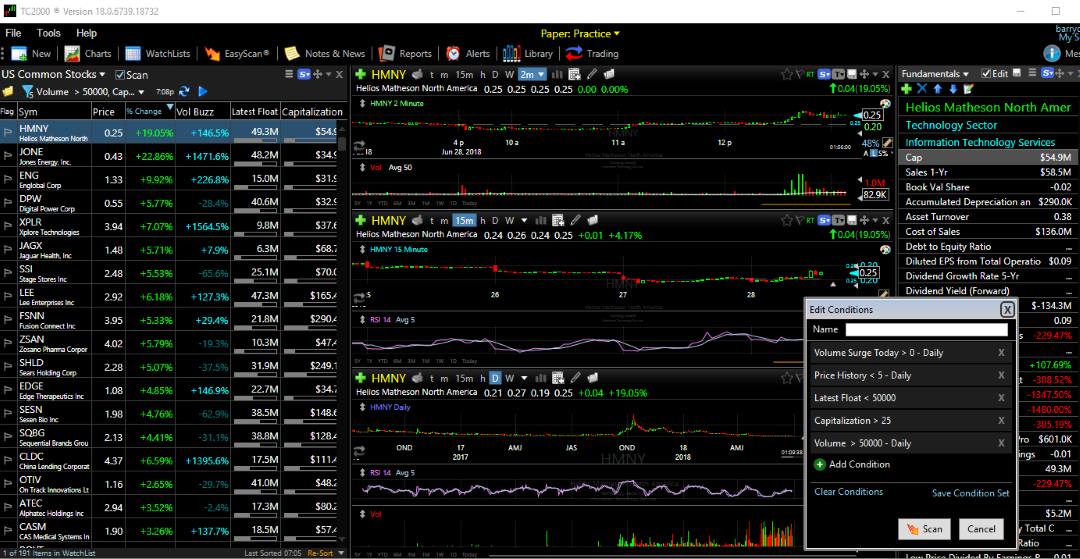
Both platforms are excellent scanners, but TradingView wins overall because it combines technical and fundamental screening across stocks, ETFs, forex, crypto, and global markets. TC2000 is exceptionally fast for scanning US stocks and remains one of the strongest choices for traders building highly customized technical scans with PCF formulas.
TradingView has integrated stock, forex, and crypto screeners and heatmaps, covering fundamental analysis and price/volume indicator scanning, earning it an incredible 4.83.
The TradingView stock screener comes complete with 160 fundamental and technical screening criteria. All the usual criteria are there, such as EPS, Quick Ratio, Pre-Tax Margin, and PE Ratio. But it also goes into more depth with more esoteric criteria, such as the number of employees, goodwill, and enterprise value.
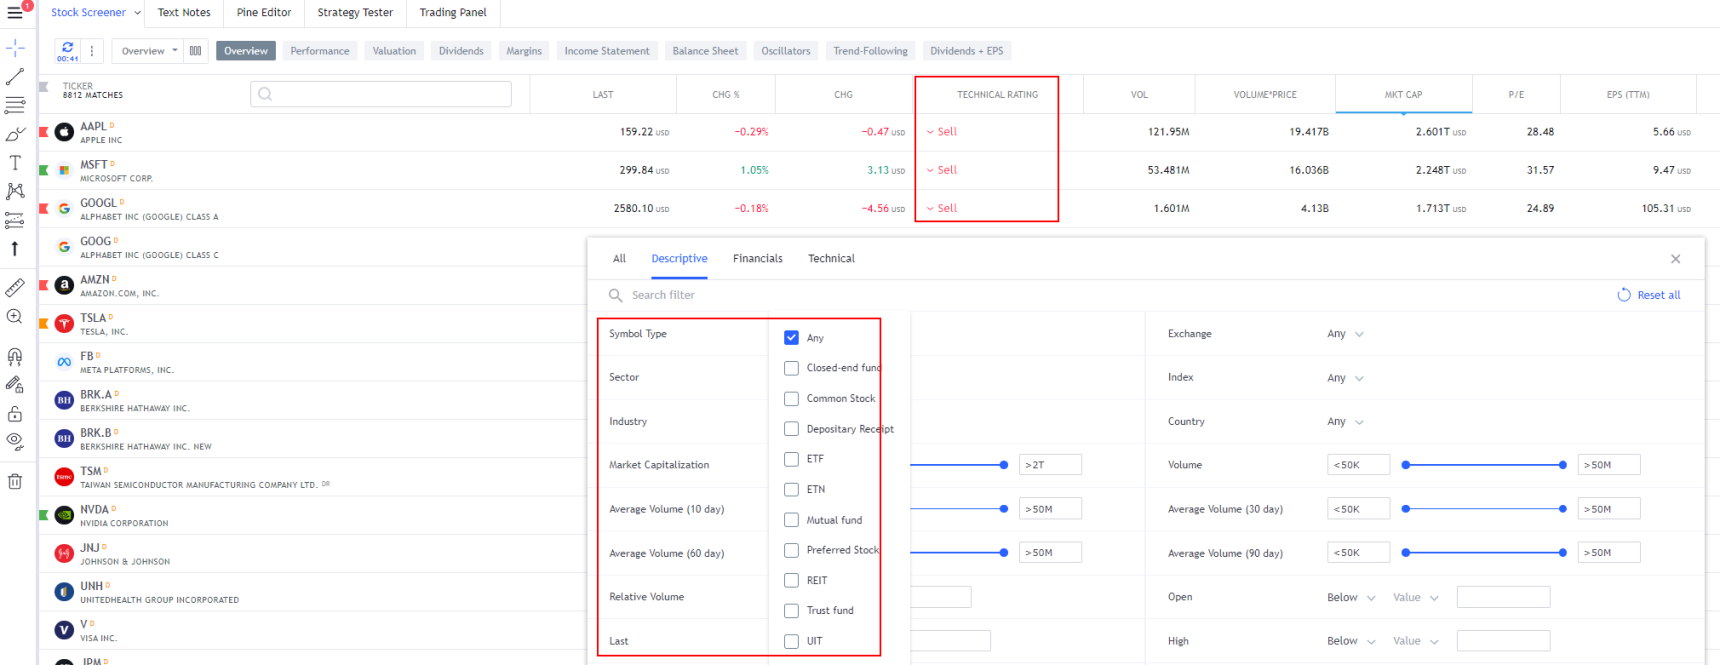
TC2000 primarily focuses on the technical screening of price, volume, and indicators, scoring 4.32. TC2000’s EasyScan has 108 technical indicators, such as MACD, Moving Averages, and RSI. TC2000 also has a coding window for customizing scans and indicators, but it is not as flexible or powerful as TradingView’s Pine script coding engine.
News & Community
TradingView wins community features 5.00 vs. 3.50 for TC2000.
TradingView has one of the largest trading communities in the world, with shared charts, trade ideas, indicators, strategies, scripts, and educational content built directly into the platform. TC2000 has an established user community and educational resources, but community collaboration is not at its core.
Community is where TradingView dominates. TradingView scores a perfect 5.00 for Community Utility, with 5.00 for active community size and 5.00 for contribution quality.
Join me and 20 million traders on TradingView for free. It's a great place to chart, scan, trade, and get my latest trading ideas and analysis.
TC2000 scores a respectable 3.50, with 3.50 for active community size and 3.50 for contribution quality. The difference is structural: TradingView’s community produces reusable Pine scripts, indicators, strategies, and workflows at scale; TC2000’s community is more practical and platform-supportive, but not a global open-source trading ecosystem.
News is closer, but TC2000 edges TradingView on market-news usefulness. TradingView scores 3.00 for Financial News Speed & Depth, with an estimated 60–300 second delay versus primary wires. It is useful for context, symbol research, and sentiment, but it is not designed as a breaking-news terminal.
TC2000 scores 3.50, with a faster estimated 20–60 second delay and MT Newswire integration (at an additional cost of $10/mo), making it stronger for traders who use news as catalyst context alongside scans and alerts.
Strategy Backtesting
TradingView wins backtesting 4.19 vs. 0.00 for TC2000.
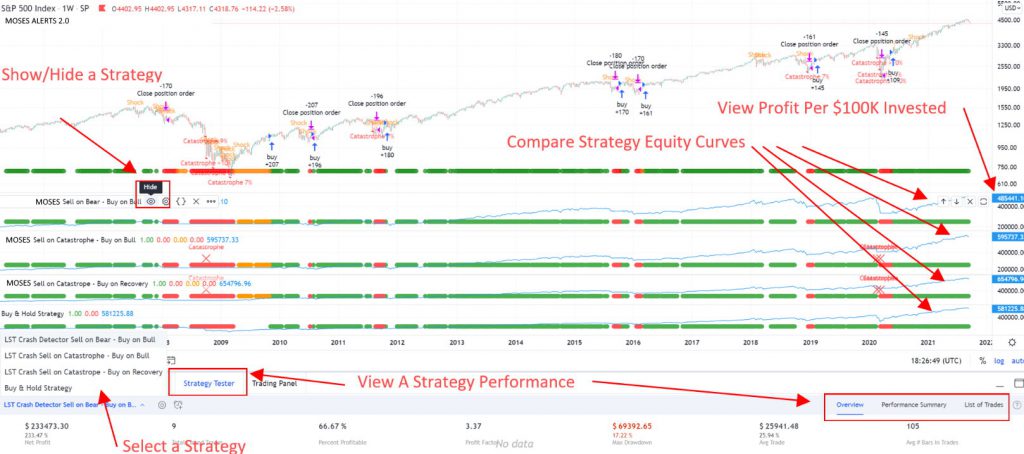
TradingView provides a genuine rules-based strategy testing environment through Pine Script and Strategy Tester, allowing traders to build, test, and analyze systematic trading strategies. TC2000 supports historical chart analysis and formula-driven scans, but it does not provide a native strategy backtesting engine comparable to TradingView.
In my lab results, TradingView scores 4.19. TradingView’s advantage comes from very fast strategy testing: 7 ms backtest speed, 5.00 speed points, 5.00 flexible coding backtesting, 85% report-quality coverage, and 4.25 report-quality points.
TC2000 lacks a native rules-based strategy backtesting engine; the tested backtesting category scores 0.00 across the board: no features for backtesting. It means strategy research must happen elsewhere. In practical terms, TradingView is infinitely better for building and testing rules in Pine Script.
AI, Automation & Trading Bots
TradingView wins AI and algorithmic trading 4.00 vs. 1.50 for TC2000.
TradingView has developed a much stronger algorithmic ecosystem through Pine Script, automated strategy development, alerts, webhooks, its growing AI functionality, and integrations with external automation tools. TC2000 remains largely focused on traditional charting, scanning, and trade execution and currently offers very limited AI or algorithmic trading functionality.
TradingView scores 3.50 for Trading Bot & Auto-Trading Reliability. TradingView’s bot score is driven by automation path and strategy/bot sophistication.
TC2000 scores lower on strategy sophistication at 1.00, with 0.00 for operational assurance.
For AI & Algo, TradingView leads again: 4.00. TradingView earns full algo-depth points at 2.00, no AI-native layer at 0.00, and full transparency at 1.00 because Pine Script logic is inspectable.
TC2000 scores 0.00 for AI layer and 1.00 for transparency, but only 1.00 for algo depth. So TradingView is the stronger platform for rule-building, script testing, alert logic, and semi-automated workflows.
Broker Connectivity & Trading Ecosystem
TradingView wins broker connectivity 5.00 vs. 2.73 for TC2000.
TradingView supports a much broader ecosystem of integrated brokers and asset classes, allowing users to trade stocks, futures, forex, and other markets directly from its charts. TC2000 integrates tightly with TC2000 Brokerage and provides an excellent US stock and options workflow, but its broker choice and market coverage are substantially narrower.
TradingView earns full marks for live trading 5.00, broker integration 5.00, and asset/data coverage 5.00. The key data point is broker breadth: TradingView is scored with 100 integrated brokers, capped at the maximum broker-integration score, and covers stocks, options, FX, US exchanges, and international exchanges.
TC2000’s broker result is more focused. It scores 5.00 for live trading, but only 0.20 for broker integration, as the tested broker count is 2 and asset/data coverage is 3.00. That makes TC2000 good for traders who want a clean U.S.-centric execution workflow, especially if they already accept its broker path.
TradingView is the better choice if broker choice, global markets, multi-asset coverage, and trading from charts matter more than a tightly focused US stock/options workflow.
Speed & Ease of Use
TradingView wins speed and usability 5.00 vs. 4.83 for TC2000.
Both platforms performed exceptionally well in my usability testing. TradingView narrowly wins because its web, desktop, and mobile applications provide a highly consistent experience with fast navigation and cross-device synchronization. TC2000 is also extremely responsive and can be particularly effective for multimonitor US trading setups, so the practical difference here is small.
TradingView scores a perfect 5.00 overall, with 1.55 seconds time-to-chart, 5.00 time-to-chart performance, 20 ms multi-chart latency, 5.00 multimonitor chart speed, a 2-click workflow, and 5.00 for the 3-click ease test. That is why TradingView feels fast despite being web-based: it combines quick startup, responsive charts, and low-friction navigation.
TC2000 scores 4.83, with 7.30 seconds time-to-chart 4.50, 10 ms multi-chart latency 5.00, multimonitor chart speed 5.00, a 3-click workflow, and 5.00 ease-of-use score. TC2000’s 10 ms multi-chart latency is faster than TradingView’s 20 ms, which makes it outstanding for multimonitor desktop trading.
But TradingView’s faster chart startup and broader web workflow push it ahead overall.
Customer Support
TC2000 wins customer support 5.00 vs. 3.25 for TradingView.
Customer support is one category where TC2000 clearly beats TradingView. TC2000 provides highly accessible US-based support and performed exceptionally well in my service testing. TradingView offers extensive documentation and support resources, but access to direct human assistance is less immediate, giving TC2000 a meaningful advantage for traders who value responsive customer service.
TC2000 vs TradingView for Day Trading
TC2000 and TradingView are close in terms of choice for day traders. TradingView is the better choice for day traders who need broader market coverage, greater charting flexibility, more brokers, Pine Script, and strategy testing.
TC2000 is arguably the better specialist platform for US stock day traders who prioritize fast scans, watchlists, multimonitor desktop performance, options, and direct execution.
TC2000 vs TradingView for Swing Trading
For swing trading, I prefer TradingView because its stronger charting, alerts, Pine Script, strategy backtesting, and broader market coverage make it easier to identify setups, test trading rules, and monitor positions over several days or weeks.
TC2000 remains an excellent choice for swing traders focused almost entirely on US stocks because its scanning engine is fast, flexible, and particularly good at finding stocks that meet precise technical conditions. However, TradingView provides the more complete swing-trading workflow overall, especially if you want to test strategies, build custom indicators, trade multiple asset classes, or use advanced alerts across desktop, web, and mobile.
Final Thoughts
TradingView is my overall winner because it offers broader charting, backtesting, global market access, broker connectivity, scripting, and community features at a competitive price.
TC2000 remains an excellent specialist platform for US stock and options traders who prioritize fast scanning, desktop workflows, integrated options trading, and responsive customer support.
For most traders, I recommend TradingView. For dedicated US stock and options traders who value TC2000’s specialist workflow, TC2000 remains a strong choice.
FAQ
Which is better, TC2000 or TradingView?
Both TC2000 and TradingView enable trading directly from charts. TC2000 Brokerage is not commission-free. Its standard Small Trader schedule currently charges $1 plus $0.005 per share for stocks and ETFs, while options cost $1 plus $0.65 per contract.
TradingView‘s model is better, with integrated brokers like Interactive Brokers (low trading costs) and TradeStation (free stock trades).
Is TC2000 better for Options trading than TradingView?
Yes. TC2000 is the stronger platform for active US options trading because it combines options charting, multi-leg strategy analysis, order planning, and brokerage execution in a tightly integrated workflow. TradingView now supports options data and charting, but TC2000 provides the more complete options-trading environment.
Does TradingView have Options charts?
Yes, TradingView does have stock options charts; however, a better alternative is TC2000, which offers complex options strategies, charting, immediate order execution, and order management directly from the chart.
What is a good TC2000 alternative?
Our testing shows that TradingView is a good alternative to TC2000. While TC2000 is superior for options trading, TradingView wins in social trading, backtesting, charting, exchange coverage, free and low-cost data plans, and asset coverage with stocks, ETFs, crypto, and forex.
Can you trade futures on TradingView or TC2000?
Yes, you can trade futures on TradingView with comprehensive commodities coverage and broker integration. TC2000 does not have any functionality covering futures contract trading.
Which is best, TC2000 paper trading or TradingView?
Both TradingView and TC2000 offer a comprehensive paper trading service so you can practice trading. TC2000 is best for paper trading stocks, options, and ETFs in the USA. TradingView is better for paper trading stocks, ETFs, futures, and cryptocurrency globally.
