My lab testing shows the best TradingView indicators for advanced analysis are Volume Profile HD, VWAP, Supertrend, ATR, Relative Volatility, and RSI. Also, TradingView’s candlestick and chart pattern recognition algorithms are game changers for improving trading outcomes.
I have painstakingly researched and backtested each TradingView indicator and can verify the test methodology and success rates.
| Indicator | Best Use | Suggested Setting/Setup | Published Test Result |
|---|---|---|---|
| Volume Profile HD | Supply, demand, support, resistance, and price-level analysis | Session Volume Profile / Volume Profile HD. Use on a 5-minute intraday chart for session-level volume-at-price analysis. | No direct win-rate published. This is a structural analysis tool, not a standalone buy/sell signal. |
| VWAP | Day trading, institutional price levels, trend bias, and mean reversion | VWAP(14). Buy when price closes above VWAP; exit when price closes below VWAP. Strongest tested setup: 5-minute Heikin Ashi chart. | 5-minute Heikin Ashi test: beat buy-and-hold on 93% of tested DJ30 stocks, with 29% winning trades and a 4.1 reward/risk ratio. Daily Heikin Ashi test: 46% wins, 3.03 reward/risk, 0.83 expectancy. |
| Relative Strength Index (RSI) | Momentum, overbought/oversold signals, and reversal timing. Best used with trend, volume, or support/resistance confirmation. | RSI(14), 70/30 levels. Buy when RSI crosses up through 30; sell when RSI crosses down through 70. Best tested timeframe: 1-hour OHLC chart. | Best supported setup: RSI-14 on a 1-hour OHLC chart produced a 53% win rate. Shorter-term 1-minute and 5-minute tests were weak. |
| Directional Movement Index (DMI) | Trend direction, trend strength, and DI crossover signals. DMI can work when the reward/risk profile is favorable, but the win rate is not high. | DMI(14) / DI+ and DI− crossover logic, with ADX used as trend-strength context. | DJ30 test: 36% winning positions, 2.20 reward/risk ratio, 0.15 expectancy. Russell 1000 test showed 13.68% CAGR versus 10.4% for SPY. |
| Relative Volatility Index (RVI) | Volatility direction, volatility momentum, and risk context | Use the default Relative Volatility (RVI) setup. Readings above 50 suggest upside volatility; readings below 50 suggest downside volatility. | No direct backtested success rate published, as it is a volatility filter |
| Average True Range (ATR) | Volatility, stop placement, trailing stops, and position sizing | ATR Trailing Stop (14,3). Long when price closes above the ATR stop; exit when price closes below the ATR stop. | ATR trailing stop test: 43% wins, 57% losses, 8.5% average win, -4.8% average loss, 1.77 reward/risk ratio, and 0.19 expectancy. |
| Technical Ratings | Quick bullish/bearish dashboard using multiple indicators | TradingView default Technical Ratings. Adjust the timeframe in the settings panel depending on whether you trade short-, medium-, or long-term. | No direct backtested success rate. The tool combines 11 technical indicators into a composite rating. |
| Chart Pattern Recognition | Automated pattern detection, support/resistance, and breakout targets | Use TradingView’s automatic chart pattern indicators. Focus on confirmed breakouts rather than early pattern formation. | Pattern-level research: Inverse Head & Shoulders 89% success, Double Bottom 88%, Triple Bottom 87%, Descending Triangle 87%. |
| Supertrend | Trend following, trend changes, and trailing exits | Standard Supertrend setting tested in the article: 14. Backtest different ATR/multiplier settings before using it live. | 5-minute day-trading test: 42% wins. Daily swing-trading test: 43% wins. Not profitable as a standalone standard OHLC setup. |
| Vertical Volume | Volume confirmation, breakout validation, and demand/supply analysis. Best used to confirm whether price moves have real participation behind them. | Use default vertical volume bars. Combine with Session Volume Profile for a fuller view of volume by time and price. | No direct win-rate published. It is a confirmation indicator rather than a standalone signal. |
I explain how each indicator works and how to use it to identify entry and exit points in your trading strategy. So, if you’re ready to improve your trading, read on!
1. Volume Profile HD.
The best supply-and-demand TradingView indicator is the Volume Profile HD. Used in an intraday setting, such as 5 minutes, you can see the volume profile for each trading session. This is a unique and powerful volume indicator.
| Indicator | Best Use | Suggested Setting/Setup | Published Test Result |
|---|---|---|---|
| Volume Profile HD | Supply, demand, support, resistance, and price-level analysis | Session Volume Profile / Volume Profile HD. Use on a 5-minute intraday chart for session-level volume-at-price analysis. | No direct win-rate published. This is a structural analysis tool, not a standalone buy/sell signal. |

This indicator allows traders to analyze the volume at a certain price level, helping them identify areas of strong buying and selling. Volume Profile plots the total volume executed at each price level. This gives traders an idea of where most activity occurs, helping them make more informed trading decisions. Additionally, the Volume Profile indicator can identify strong support and resistance levels that may not be apparent on a normal volume chart. This makes it an invaluable tool for traders looking for strategic entry and exit points in their trades.
Overall, the Volume Profile indicator is one of the best indicators available on TradingView for analyzing supply and demand. It provides traders with valuable insights into price movements and trading volume, giving them a distinct edge in their trading decisions. This indicator can be an invaluable tool for making more profitable trades by providing an accurate read of market sentiment.
2. Volume Weighted Average Price (VWAP).
The Volume Weighted Average Price (VWAP) indicator is one of the best volume indicators available on TradingView. This indicator provides traders with a powerful tool to identify entry and exit points for their trades based on trading volume. VWAP plots the cumulative total by comparing the price and volume of trades over a given period.
| Indicator | Best Use | Suggested Setting/Setup | Published Test Result |
|---|---|---|---|
| VWAP | Day trading, institutional price levels, trend bias, and mean reversion | VWAP(14). Buy when price closes above VWAP; exit when price closes below VWAP. Strongest tested setup: 5-minute Heikin Ashi chart. | 5-minute Heikin Ashi test: beat buy-and-hold on 93% of tested DJ30 stocks, with 29% winning trades and a 4.1 reward/risk ratio. Daily Heikin Ashi test: 46% wins, 3.03 reward/risk, 0.83 expectancy. |
It plots the cumulative total of price and volume over a given period, allowing traders to easily identify entry and exit points for their trades. VWAP helps traders analyze support and resistance levels, as well as overhead supply and demand, which may not be evident on a chart. This indicator is particularly useful for intraday analysis, as it can indicate the overall trend for the period: when the price is above the VWAP, the trend is up. When it’s below the VWAP, the trend is down. There can be a lag between the indicator and price due to VWAP’s calculation of an average from past data.
TradingView 4.8/5⭐ : The Best Trading Platform I’ve Tested in 20+ Years
With lightning-fast charts, powerful pattern recognition, smart screening, backtesting, and a global community of 20+ million traders — it’s a powerful edge in today’s markets.

If you want one platform that gives you an edge, this is it.
3. Relative Strength Index (RSI).
The best momentum indicator on TradingView is the Relative Strength Index (RSI). This technical indicator measures the magnitude of an asset’s recent price changes to determine whether it is overbought or oversold. The RSI compares the magnitude of a stock’s gains over a specified period to its losses and presents the result as an oscillator.
| Indicator | Best Use | Suggested Setting/Setup | Published Test Result |
|---|---|---|---|
| Relative Strength Index (RSI) | Momentum, overbought/oversold signals, and reversal timing. Best used with trend, volume, or support/resistance confirmation. | RSI(14), 70/30 levels. Buy when RSI crosses up through 30; sell when RSI crosses down through 70. Best tested timeframe: 1-hour OHLC chart. | Best supported setup: RSI-14 on a 1-hour OHLC chart produced a 53% win rate. Shorter-term 1-minute and 5-minute tests were weak. |
The RSI values range from 0 to 100, and a value above 70 indicates that a stock is overbought, while a value below 30 suggests it is oversold. When combined with other indicators, the RSI helps traders identify when to enter or exit trades. This indicator also provides valuable insight into a stock’s momentum direction, making it one of the best indicators on TradingView.
The chart above shows that the best way to use RSI is to spot divergences between price and RSI peaks. When price makes new highs and RSI makes new lows, this indicates that a price trend reversal is possible.
4. Directional Movement Index (DMI).
The Directional Movement Index (DMI) is a technical momentum indicator that measures the strength of a trend. It combines three popular indicators, ADX, DMI-, and DMI+, to provide traders with an indication of whether a trend is changing and the trend’s strength.
| Indicator | Best Use | Suggested Setting/Setup | Published Test Result |
|---|---|---|---|
| Directional Movement Index (DMI) | Trend direction, trend strength, and DI crossover signals. DMI can work when the reward/risk profile is favorable, but the win rate is not high. | DMI(14) / DI+ and DI− crossover logic, with ADX used as trend-strength context. | DJ30 test: 36% winning positions, 2.20 reward/risk ratio, 0.15 expectancy. Russell 1000 test showed 13.68% CAGR versus 10.4% for SPY. |
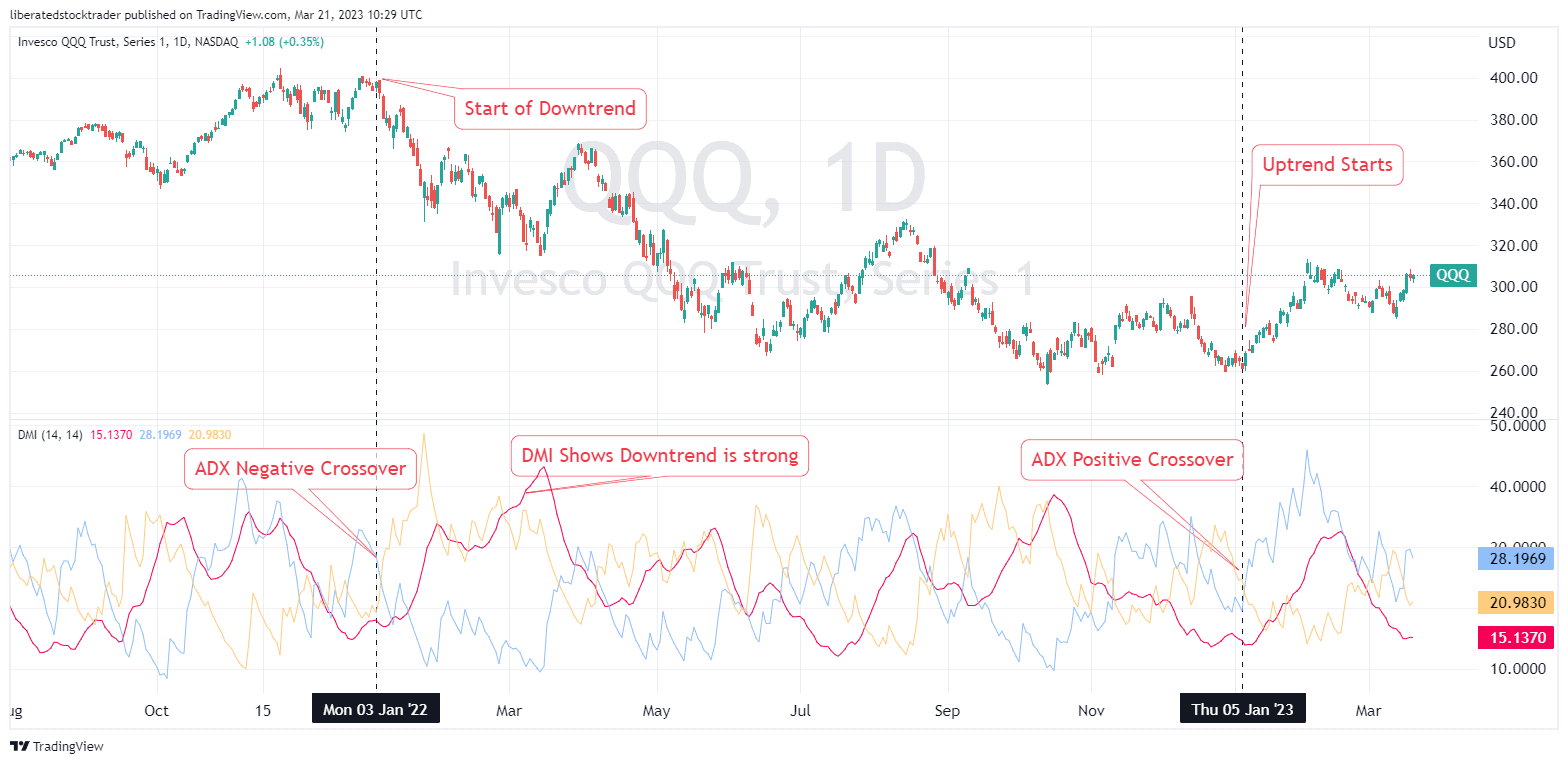
The ADX line tracks the magnitude of price movements, while the DMI lines indicate the trend direction. A rising ADX line above 25 indicates a strong trend, while a falling ADX line suggests that the trend is weakening. Meanwhile, a DI+ reading above DI- indicates an uptrend.
I have indicated the DI+ and DI- crossovers in the chart above, as well as the impact of ADX strength on the price trend.
Traders can use this information to determine whether to buy or sell to exploit the current trend. This indicator also helps traders identify when to close positions as the trend weakens. As such, it is an excellent tool for entry and exit points on trades.
5. Relative Volatility.
Based on my testing, Relative Volatility is an excellent volatility indicator on TradingView. This indicator measures price fluctuations and compares them to past volatility. When Relative Volatility is high, it suggests the market is experiencing heightened volatility, making it a useful tool for traders looking to enter or exit positions. The Relative Volatility indicator also helps traders identify when prices are likely to reverse direction, allowing them to take advantage.
| Indicator | Best Use | Suggested Setting/Setup | Published Test Result |
|---|---|---|---|
| Relative Volatility Index (RVI) | Volatility direction, volatility momentum, and risk context | Use the default Relative Volatility (RVI) setup. Readings above 50 suggest upside volatility; readings below 50 suggest downside volatility. | No direct backtested success rate published, as it is a volatility filter |
Try Relative Volatility on TradingView
The Relative Volatility Index (RVI) is an excellent indicator for gauging market volatility. It measures price fluctuations relative to past volatility, giving traders a clearer indication of potential entry and exit points. The RVI is plotted on the chart, ranging from 0 to 100, with higher values indicating greater volatility. When the RVI is above 50, it suggests volatility is to the upside and that a potential buy signal may exist. Conversely, when the RVI falls below 50, it may signal an opportunity to sell. Additionally, traders can use this indicator to identify overbought and oversold conditions to make more informed decisions.
6. Average True Range (ATR).
The Average True Range (ATR) is one of the most established market volatility indicators on TradingView. This indicator considers both the magnitude and direction of price movements and expresses them as oscillators. The ATR values range from 0 to infinity, with higher values indicating increased volatility.
| Indicator | Best Use | Suggested Setting/Setup | Published Test Result |
|---|---|---|---|
| Average True Range (ATR) | Volatility, stop placement, trailing stops, and position sizing | ATR Trailing Stop (14,3). Long when price closes above the ATR stop; exit when price closes below the ATR stop. | ATR trailing stop test: 43% wins, 57% losses, 8.5% average win, -4.8% average loss, 1.77 reward/risk ratio, and 0.19 expectancy. |
Traders can use this information to identify rising volatility in a stock, as volatility is a day trader’s best friend. However, the ATR will not indicate the direction of the trend; it will simply indicate the magnitude of potential price movements.
7. Technical Ratings.
The technical rating indicator in TradingView is one of the best indicators for identifying potential entry and exit points in trades, using 11 different technical indicators. The Blue bars are buy signals, and the red bars are sell signals.
| Indicator | Best Use | Suggested Setting/Setup | Published Test Result |
|---|---|---|---|
| Technical Ratings | Quick bullish/bearish dashboard using multiple indicators | TradingView default Technical Ratings. Adjust the timeframe in the settings panel depending on whether you trade short-, medium-, or long-term. | No direct backtested success rate published. The tool combines 11 technical indicators into a composite rating. |
The technical rating indicator combines moving average and oscillator technical signals, including Moving Averages, Ichimoku Cloud, Stochastic, Commodity Channel Index, Average Directional Index, Awesome Oscillator, Momentum, MACD, Williams Percent Range, Bulls and Bears Power, and the Ultimate Oscillator.
Plotting the technical rating indicator as a histogram beneath the price chart lets you visualize price performance across 11 indicators. You can also change the timeframe in the settings panel to adjust the sensitivity. The table in the bottom right of the chart also indicates the oscillator’s buy and sell status and moving average signals for the short, medium, and long term.
8. Chart Pattern Recognition.
The automated chart pattern recognition algorithms are the best support-and-resistance indicators on TradingView. There are 15 chart pattern types you can overlay on the chart to save time spotting them. The chart pattern indicators also provide excellent support and resistance levels, as well as price targets for each breakout.
| Indicator | Best Use | Suggested Setting/Setup | Published Test Result |
|---|---|---|---|
| Chart Pattern Recognition | Automated pattern detection, support/resistance, and breakout targets | Use TradingView’s automatic chart pattern indicators. Focus on confirmed breakouts rather than early pattern formation. | Pattern-level research: Inverse Head & Shoulders 89% success, Double Bottom 88%, Triple Bottom 87%, Descending Triangle 87%. |
In the chart above, I have mapped the following patterns: Rectangles, Triple Bottom, Falling Wedges, and Rising Wedges. Chart pattern recognition in TradingView is one of my favorite indicators.
Traders can use this information to help identify entry and exit points for their trades – sell when prices break through key levels of support or buy when prices push up through areas of resistance. These stock chart patterns can also be used with other indicators, such as moving averages, to provide traders with additional trading signals.
9. Supertrend.
The Supertrend Indicator on TradingView is a trend-following indicator that signals when a new trend might be forming. This indicator uses the Average True Range (ATR) and a factor multiplier to generate buy or sell signals. It is designed to identify strong trends as early as possible and keep traders in the right direction.
| Indicator | Best Use | Suggested Setting/Setup | Published Test Result |
|---|---|---|---|
| Supertrend | Trend following, trend changes, and trailing exits | Standard Supertrend setting tested in the article: 14. Backtest different ATR/multiplier settings before using it live. | 5-minute day-trading test: 42% wins. Daily swing-trading test: 43% wins. Not profitable as a standalone standard OHLC setup. |
Try this indicator on TradingView
The Supertrend indicator is a great tool for traders to identify trend reversals and gauge market volatility. When the price of an asset falls below the indicator curve, the indicator turns red, suggesting that a downtrend may be forming. Conversely, when the price rises above the indicator curve, the indicator turns green, suggesting an uptrend may begin. A new trend may start after each close above or below the Supertrend indicator.
The chart above shows the weekly Nasdaq 100, and the Supertrend indicators perform very well during this period.
The Supertrend indicator is especially useful for trading strategies that capture trend movements, such as breakout trades or trend following. Additionally, the indicator can be tuned to adjust entry and exit signals based on price action moves using the Average True Range (ATR). This makes it a good tool for traders seeking new price trend formation. The Supertrend Indicator, like all technical indicators, produces false signals during periods of price consolidation, so it is best used alongside other indicators.
10. Vertical Volume.
The vertical volume indicator is important for traders to gauge a stock’s strength or weakness. On TradingView, the vertical volume indicator is a standard indicator for assessing supply and demand in a market.
The vertical volume indicator displays the amount of buying or selling activity in a given time frame, helping traders quickly identify supply and demand. This can be an additional confirmation signal for trade entry and exit points. This indicator is also useful in identifying divergences between price and volume.
| Indicator | Best Use | Suggested Setting/Setup | Published Test Result |
|---|---|---|---|
| Vertical Volume | Volume confirmation, breakout validation, and demand/supply analysis. Best used to confirm whether price moves have real participation behind them. | Use default vertical volume bars. Combine with Session Volume Profile for a fuller view of volume by time and price. | No direct win-rate published. It is a confirmation indicator rather than a standalone signal. |
When you combine the standard vertical volume bars with the Session Volume Profile, you get a 360-degree view of supply across any time frame and price.
Bonus Indicator: MOSES
My testing shows that one of the most accurate indicators available on TradingView is the MOSES indicator, which I personally developed. MOSES combines several moving averages (MA) and uses price action percentage moves to tune entry and exit signals. This unique indicator considers price data, historical market trends, momentum, and volatility to provide traders with more accurate entry points.
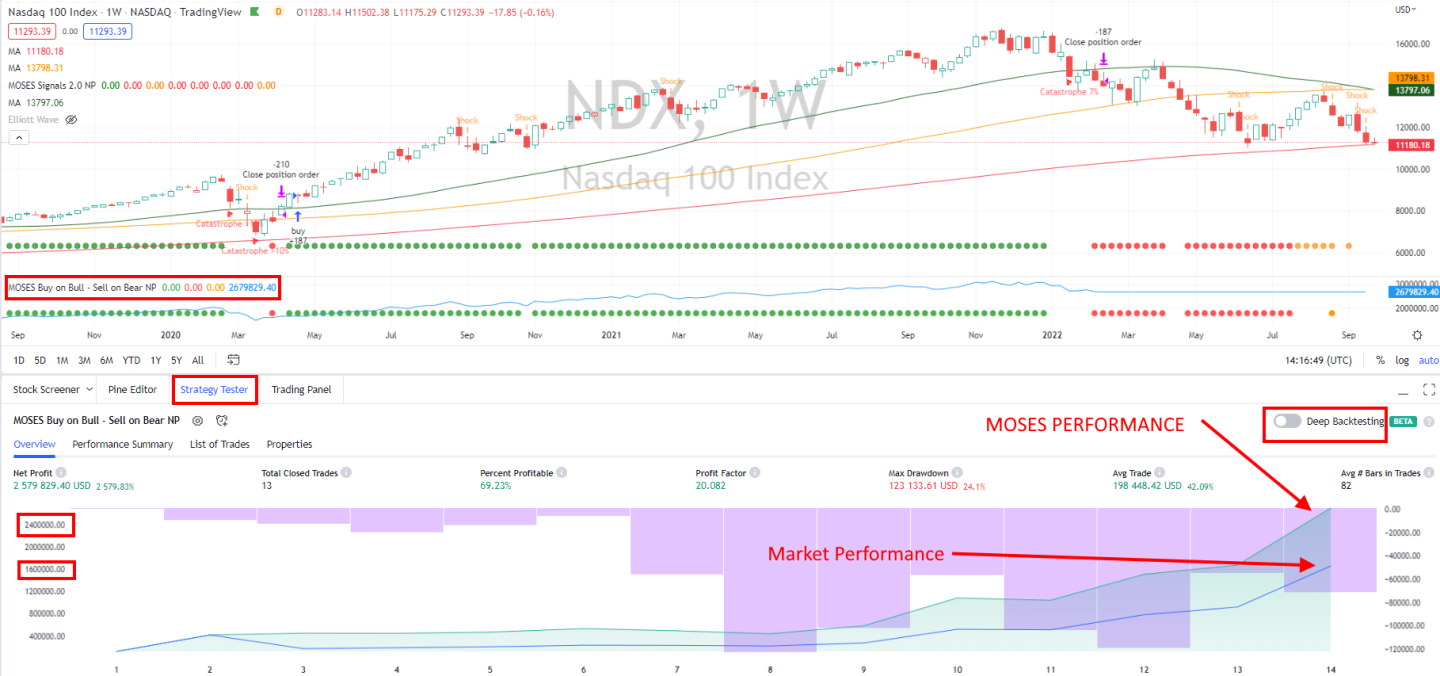
MOSES is designed to operate on a weekly timeframe and delivers high accuracy for broad market indexes, such as the Nasdaq 100 and the S&P 500.
It’s fast and reliable, giving traders more confidence in their decisions. Additionally, this indicator is designed only for long trades on a weekly timeframe and has produced a 66.67% win ratio and a 712% return since 1996. MOSES is the only indicator on this list that is not free but is available here for $199.
Beat The Market, Avoid Crashes & Lower Your Risks
Nobody wants to see their hard-earned money disappear in a stock market crash.
Over the past century, the US stock market has had 6 major crashes that have caused investors to lose trillions of dollars.

The MOSES Index ETF Investing Strategy will help you minimize the impact of major stock market crashes. MOSES will alert you before the next crash happens so you can protect your portfolio. You will also know when the bear market is over and the new rally begins so you can start investing again.
MOSES Helps You Secure & Grow Your Biggest Investments
★ 3 Index ETF Strategies ★
★ Outperforms the NASDAQ 100, S&P500 & Russell 3000 ★
★ Beats the DAX, CAC40 & EURO STOXX Indices ★
★ Buy & Sell Signals Generated ★
MOSES Helps You Sleep Better At Night Knowing You Are Prepared For Future Disasters
Summary
Based on our research, the most effective TradingView indicators for advanced analysis are Volume Profile HD, VWAP, Supertrend, ATR, Relative Volatility, Vertical Volume, and RSI.
Additionally, TradingView offers candlestick and chart pattern recognition features that enhance trading outcomes.
Overall, TradingView offers a wide range of chart indicators that allow traders to identify entry and exit points in the market with greater accuracy. From automated chart pattern recognition to candlestick pattern recognition, there is an indicator for every trading style.
We discussed the top 10 best stock indicators on TradingView and how they can help make smarter trading decisions. The Technical Ratings Indicator helps traders identify potential entry and exit points. Additionally, the Relative Volatility Index (RVI) is an excellent tool for gauging market volatility and identifying overbought and oversold conditions.
FAQ
How do I use TradingView Indicators?
To use TradingView indicators, you first need to open the chart of the asset you're interested in. Then, click on the 'Indicators' button at the top of the page, search for the indicator you want, and click on it to add it to your chart. You can customize the settings of each indicator according to your needs.
Which TradingView indicators are best for beginners?
If you're a beginner, start with simple indicators like Moving Averages (MA), Relative Strength Index (RSI), and Bollinger Bands. These are straightforward to understand and provide clear signals for buying and selling.
What are the best TradingView indicators for day trading?
For day trading, consider using the Volume Weighted Average Price (VWAP), Moving Average Convergence Divergence (MACD), and RSI. These indicators can provide insights into short-term price movements and momentum.
What are the best TradingView indicators for swing trading?
Swing traders often use the Stochastic Oscillator, Exponential Moving Average (EMA), and the On-Balance Volume (OBV). These indicators help identify potential entry and exit points based on medium-term trends.
How do I create a custom indicator on TradingView?
TradingView allows you to create custom indicators using its Pine Script language. Click on the 'Pine Editor' tab at the bottom of the page, write your code, then click 'Add to Chart' to apply your custom indicator.
Can I use multiple TradingView indicators simultaneously?
Yes, you can use two indicators at the same time on the free plan. However, avoid cluttering your chart with too many indicators as it may lead to conflicting signals.
How can I improve my trading with TradingView indicators?
Indicators can help you make more informed trading decisions by providing visual representations of market conditions. Practice using different indicators, understand their signals, and backtest your strategies to improve your trading.
What are the best Volume Indicators on TradingView?
Accordnng to my testing, the best volume indicators on TradingView are Volume Profile GD, Volume Weighted Average Price (VWAP) and Relative Volatility. Each providing a unique perspective.
Which Momentum Indicators are considered the best on TradingView?
On TradingView, some of the most reliable momentum indicators are Relative Strength Index (RSI), Directional Movement Index (DMI), and Average True Range (ATR).
Are TradingView Indicators always accurate?
No, no indicator is 100% accurate. They should be used as part of a broader trading strategy that includes other market analysis and financial news.
Hi Tim, I am glad you like the article. Also try the chart pattern recognition it is really good.
Thanks for the research and video. I have never used Volume profile or vwap indicators on Tradingview. I am going to try them now. They look really good, I will let you know how i get on.