My testing reveals that the top free stock charting software options are TradingView, Stock Rover, Benzinga Pro, Finviz, and ChartMill. All offer unique features like powerful stock charts, community, real-time news, and global heatmaps.
My in-depth research shows TradingView has the best free stock charts and app for technical traders, while Stock Rover offers excellent financial screening for investors. Benzinga Pro provides charting and real-time news. Finviz’s free stock charts are fast, reliable, and powerful. Finally, ChartMill provides full free access to its powerful features.
As a certified financial technical analyst, I guarantee this is the most concise, accurate, and in-depth test of free stock charting tools available.
10 Best Free Stock Charts Compared
| Free Features | Charts | Trading | News | Screener | App |
|---|---|---|---|---|---|
| TradingView | Summary | ✔ | ✔ | ✔ | ✔ | ✔ |
| Stock Rover | Summary | ✔ | ✘ | ✔ | ✔ | ✘ |
| Benzinga Pro | Summary | ✔ | ✘ | ✔ | ✔ | ✘ |
| Finviz | Summary | ✔ | ✘ | ✔ | ✔ | ✘ |
| ChartMill | Summary | ✔ | ✘ | ✔ | ✔ | ✘ |
| TC2000 | Summary | ✔ | ✔ | ✘ | ✘ | ✔ |
| Yahoo Finance | Summary | ✔ | ✔ | ✔ | ✔ | ✘ |
| StockCharts | Summary | ✔ | ✘ | ✘ | ✘ | ✘ |
| Robinhood | Summary | ✔ | ✔ | ✔ | ✘ | ✔ |
| Reuters | Summary | ✔ | ✘ | ✔ | ✘ | ✘ |
Free Charting Software
Our research shows TradingView is the best free stock charting analysis software, with 160 indicators and charts for stocks, Forex, commodities, and ETFs globally. Stock Rover is the best free stock software for growth, dividend, and value investors, with a 10-year financial database and industry-leading screening, research, and portfolio management capabilities.
Free Charting Apps
The best free stock charting apps for mobile and tablets are TradingView, TC2000, and Yahoo Finance. TradingView provides powerful mobile charting, TC2000 enables mobile market scanning, and the Yahoo Finance free charting app has a slick, intuitive interface.
1. TradingView: Best Free Stock Charting & Community
TradingView is the best free stock charting software because its free basic service includes charting, news, watchlists, screening, community, scripting, and backtesting.
TradingView is the best free charting service overall, but it is ad-supported. If you want an ad-free experience, you can try one of the cost-effective premium services, including multiple charts, layouts, price alerts, and system publishing.
| TradingView Rating ? | 4.8/5.0 |
|---|---|
| ⚡ Free Features? | Charts, Trading, News, Watchlists, Screening, Backtesting, App, 20M User Community |
| 🏆 Premium Features? | Pattern Recognition, Deep Backtesting, Alerts, Multi Charts |
| 🎯 Best for | Stock, FX & Crypto Traders |
| 🆓 Free Version | ✅ |
| 🎮 Premium Trial | Free 30-Day |
| ✂ Premium Discount | -17% on yearly plan + $15 Discount |
| 🌎 Markets Covered | Global |
I recommended TradingView for USA and international traders who value a great price (free), excellent chart analysis indicators and drawing tools, integrated stock news, and ease of use.
TradingView is free and has also won our Premium Subscription Stock Software Review for the last six years. The prices are reasonable and unlock a lot of extra functionality. If you like TradingView, you can upgrade for only $14 per month.
According to my research, TradingView is the best free stock charting software. TradingView has the largest selection of exchanges globally, making it ideal for international investors. TradingView is not just for free stock charts; it also includes charts for ETFs, Futures, Forex, Bonds, and Cryptocurrency, all at no extra price.
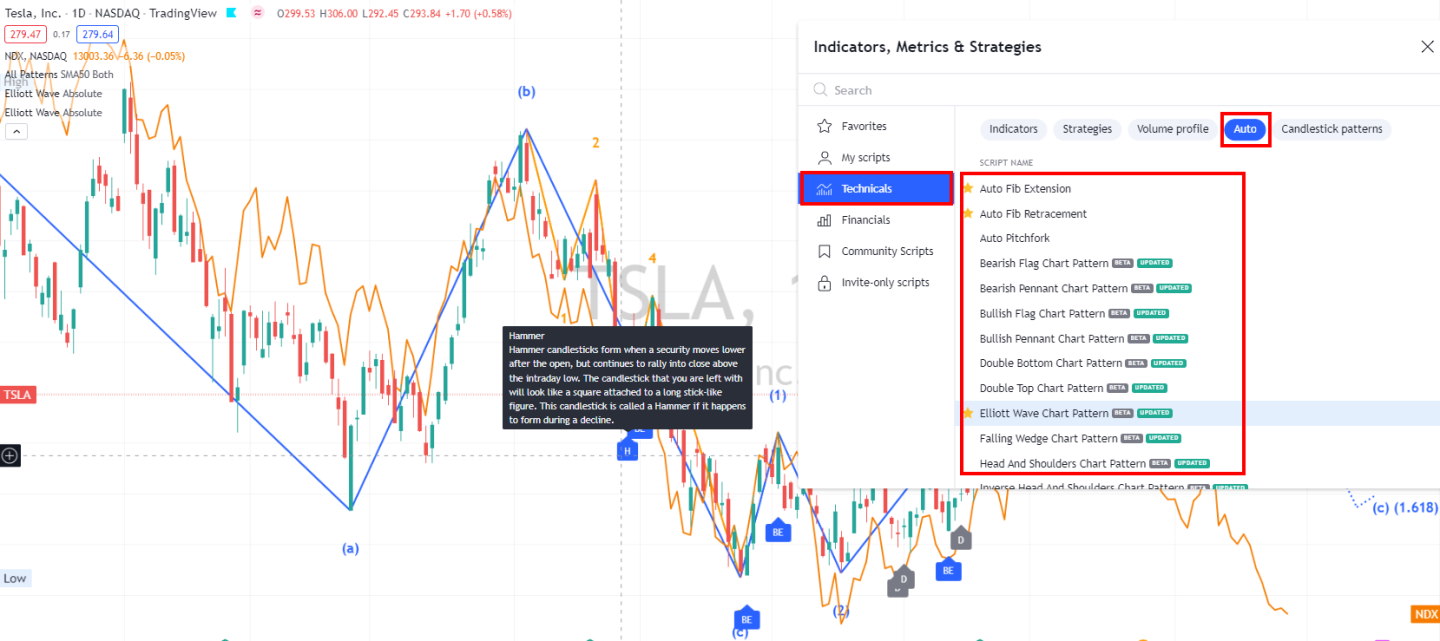
With over 160 different indicators and unique specialty charts such as LineBreak, Kagi, Heikin Ashi, Point & Figure, and Renko, you have everything you will need as an advanced trader. TradingView also has an exceptional selection of drawing tools, including tools unavailable on other platforms, like extensive Gann & Fibonacci tools. TradingView has 65 drawing tools and hundreds of icons for your charts, notes, and ideas.
I have the Premium membership, and you get fully integrated Level II data and insight.


TradingView includes free real-time scanning, filtering, and fundamental scanning. The screener is incredibly easy to use; you can scan and filter on over 150 criteria. TradingView will cover any idea you have based on technical analysis. Thanks to a connection to the Federal Reserve (FRED) database, TradingView even has vast amounts of economic data, such as Federal Funds Rates and World Economic Growth.
Watchlists have fundamentals broken into performance, valuation, dividends, margin, income statement, and balance sheet. You can set the watchlist and filters to refresh every minute.
TradingView stands out because of the huge selection of economic indicators you can map and compare on a chart. For example, you can compare the Civilian Unemployment Rate versus the growth in Company Profits in the USA, which is incredibly powerful.
The TradingView platform is built with social at the forefront, including integrated chat systems, forums, and ways to share your drawings and analysis with a single click. This is an excellent way to generate ideas and learn from other traders. You have to try it and see it in action to understand the power of the implementation. I share charts, ideas, and analyses regularly; follow me here.
The news feeds, including MT Newswires and Reuters, are fully integrated. Add that to the social network, and you have a great solution. The news service is only second to MetaStock with its real-time Reuters Feeds and Benzinga Pro’s News For Traders.
Even better is the fact that it is already configured for use. All controls are intuitive, and the charts look amazing. It’s quite a feat that TradingView is easy to use, considering the sheer number of data feeds and backend power it has.
The TradingView app has a 4.9/5 star rating on the Apple App Store and a 4.8/5 rating on the Google Play Store, meaning the mobile app is first-class. TradingView’s app has limited functionality as it understandably favors simplicity.
You do not need to sync your data across devices; it is already there. TradingView is the software I use every day, and because it is geared around social interaction, learning, and community ideas, it is a fabulous place to be.
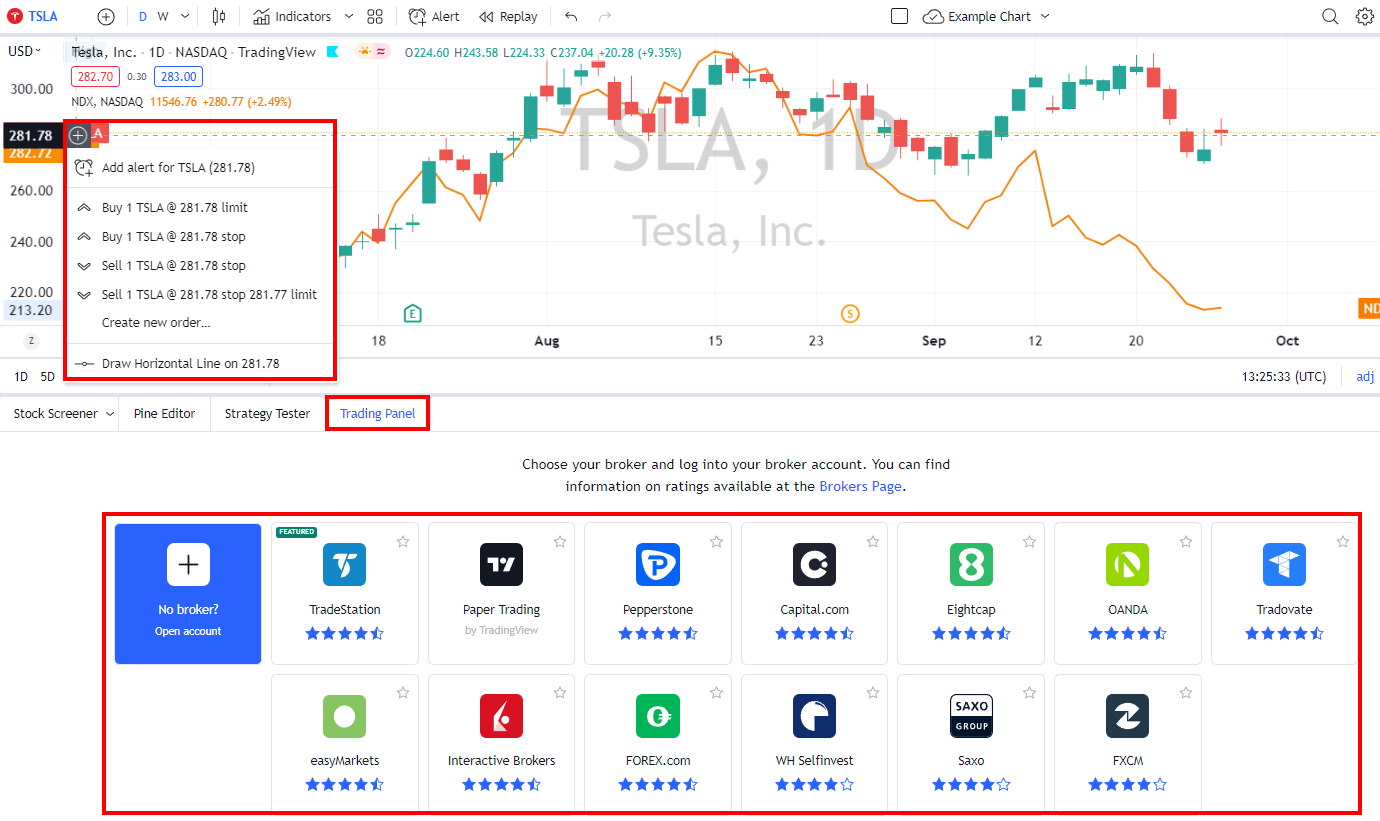
You can place trades directly from charts, and profit and loss reporting and analysis will be taken care of. The only thing it does not cover is Stock Options trading.
TradingView is the outright winner for Free Stock Charts in 2023. It offers a huge selection of indicators and drawing tools and is fully interactive for free. TradingView also offers a premium service that excels against the competition. The Pro plan is cost-effective, starting at $9.95 per month, and it offers even faster real-time charts, ad-free services, and alerts.
2. Stock Rover: Best Free Stock Analysis & Research
Our tests show that Stock Rover is the best free stock analysis, screening, and company research tool. Stock Rover has ten years of historical financial performance data combined with 350 fundamental performance metrics that allow you to implement powerful dividend, growth, and value investing strategies and portfolios.
I believe Stock Rover is the best stock screener on the market today; it won our Top 10 Best Stock Screeners Review & Test.
| Stock Rover Rating ? | 4.7/5.0 |
|---|---|
| ⚡ Free Features? | Charts, Powerful Screening, Research, Portfolio Mgt, Broker Integration [Ad-Free] |
| 🏆 Premium Features? | 10-Year Historical Financial Data, Full Portfolio Mgt, Correlation, Rebalancing & Value Investing Benefits |
| 🎯 Best for | Growth, Dividend & Value Investors |
| 🆓 Free Version | ✅ |
| 🎮 Premium Trial | Free 14-Day |
| ✂ Premium Discount | -25% During Premium Trial Period |
| 🌎 Markets Covered | USA |
Stock Rover also has stock charting capabilities that complement the scanning functionality, focusing on financial metrics charting and technical indicators like volume, moving averages, and relative strength.
You can have Stock Rover for free; however, the Premium Plus service unleashes its real power. Moreover, their top service tier is not even more expensive than the competition.
Stock Rover’s service starts free, meaning you can research and screen over 10,000 stocks and ETFs. The free service includes a stock newsfeed and powerful watchlist/portfolio management. If you want unlimited access to the 20-year financial database and fair value/margin of safety ratings, you will need the Premium Plus service.
You can have Stock Rover for free; however, the real power is unleashed with the Premium services.
Stock Rover’s Free plan includes ad-free screening for 8,500 stocks and 7,000 ETFs, portfolio analysis, and stock market news. The Free plan is OK for investors who use simple screening strategies and want to manage multiple stock portfolios in one place.
Stock Rover Premium & Premium Plus cost $29 and $49/mo, paid annually. I recommend Premium Plus for all experienced growth, income, and value investors because it unlocks unlimited fair value and margin-of-safety ratings, stock ratings, investor warnings, 700 metrics, and 20 years of historical data screening.
Ultimate and Ultimate Pro cost $79 and $149/mo, paid annually. These plans extend the services to include Options analysis, Insider metrics, and multiple client portfolio management tools for advisors. A 2-year subscription reduces all plans by 40%, representing a significant saving.
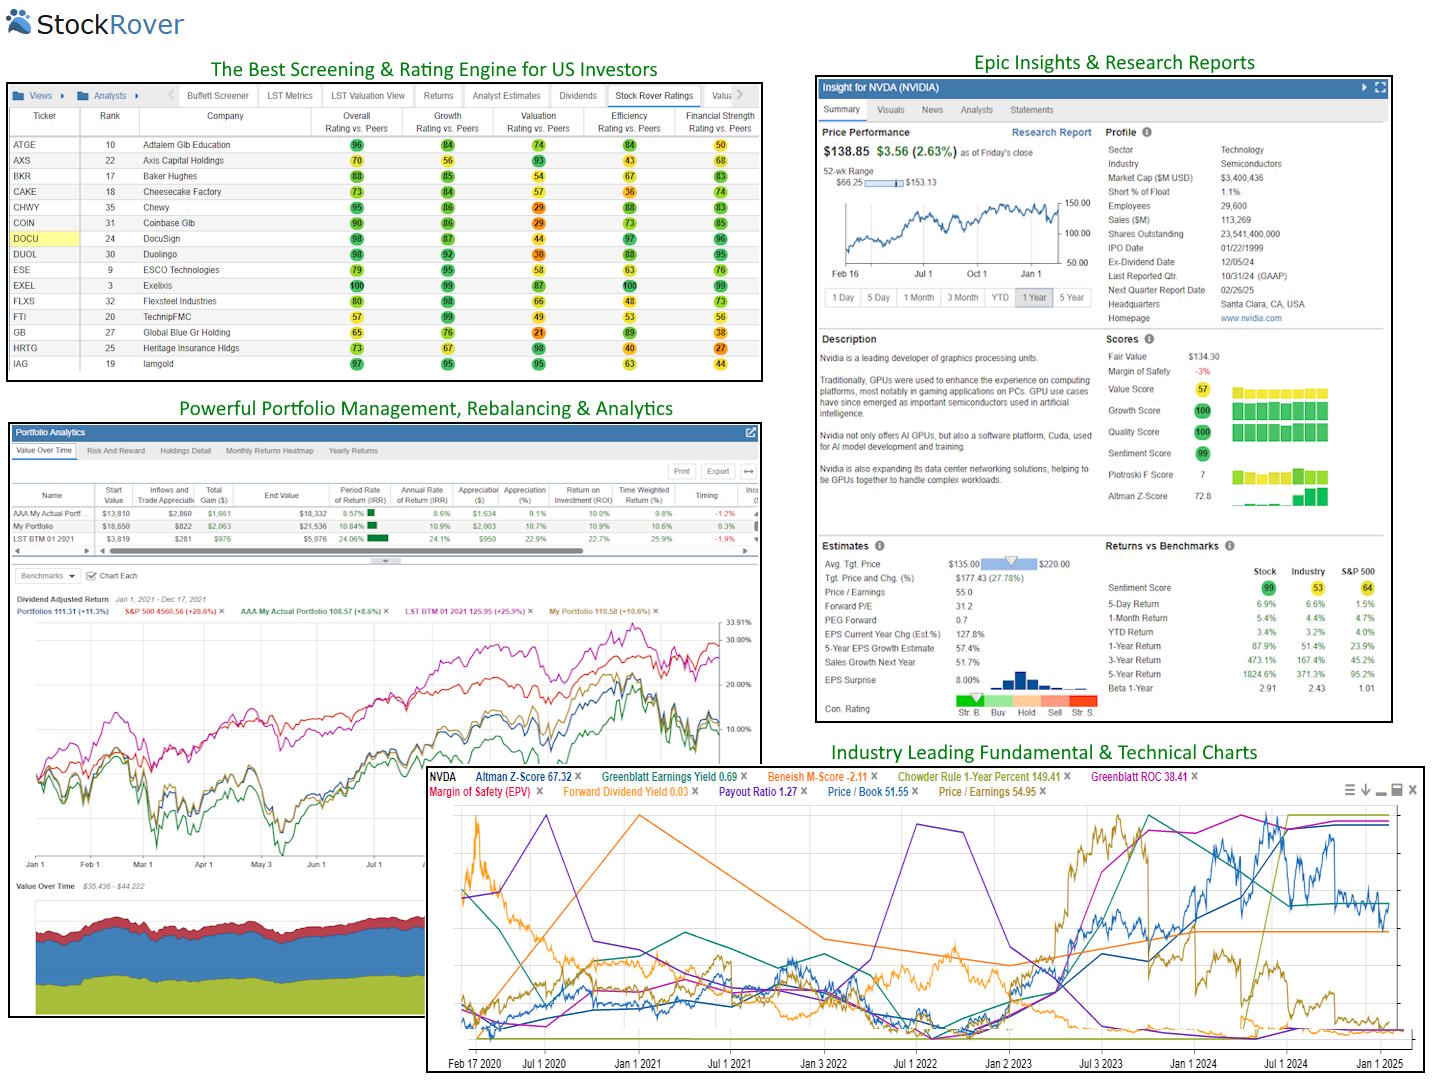
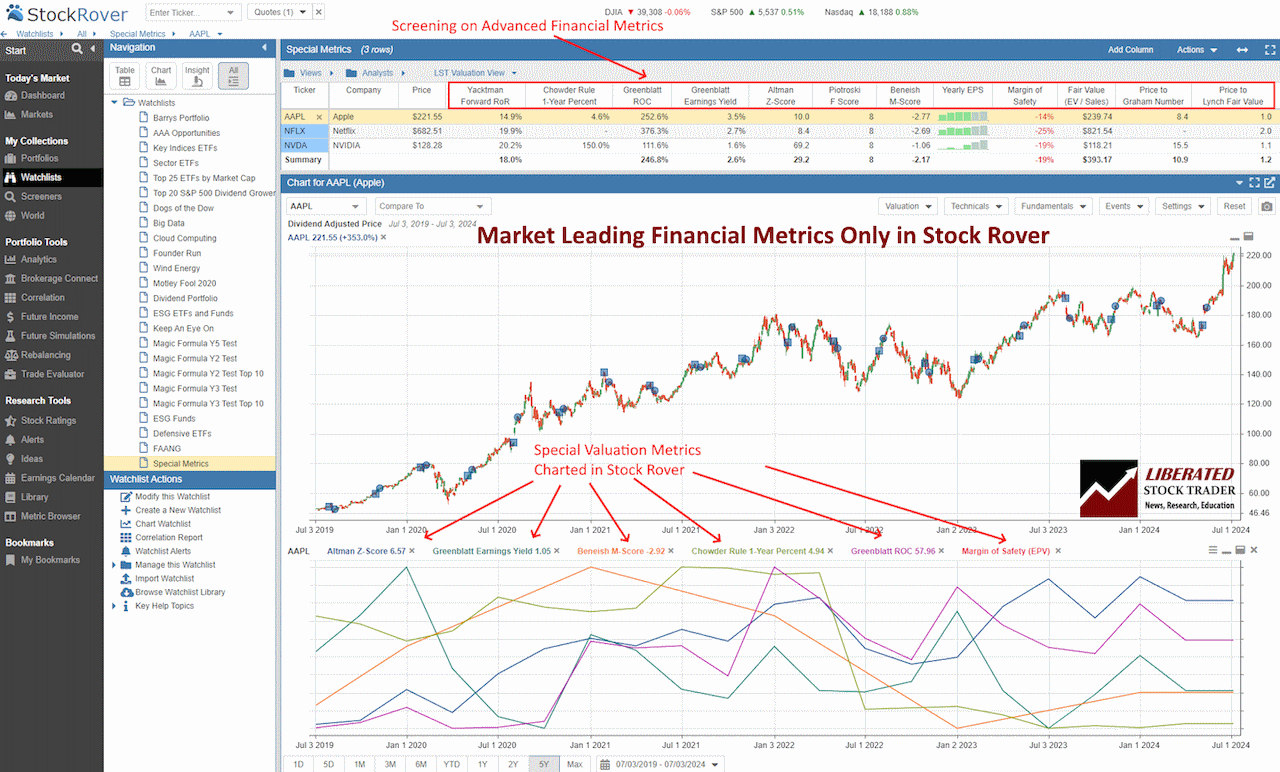
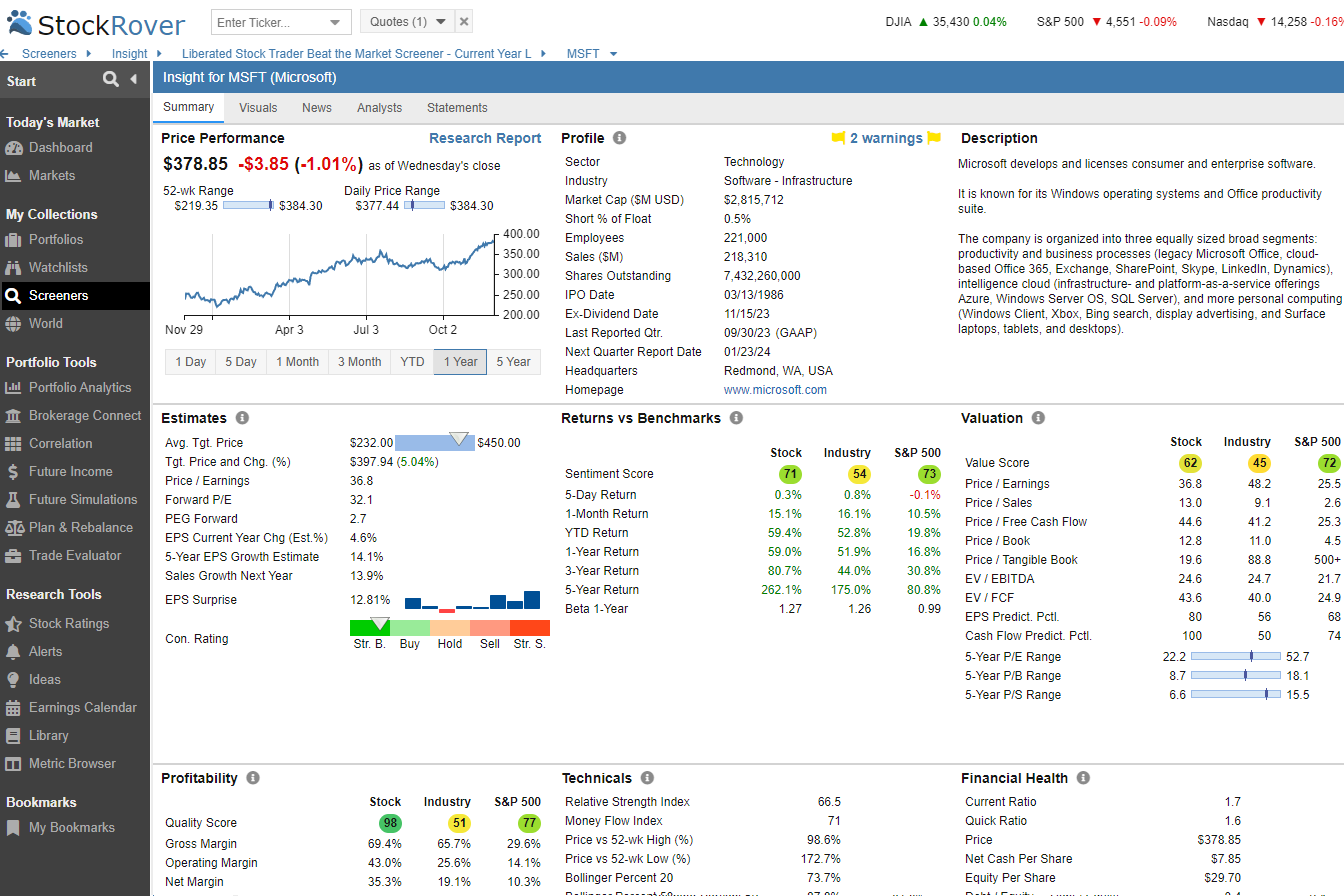
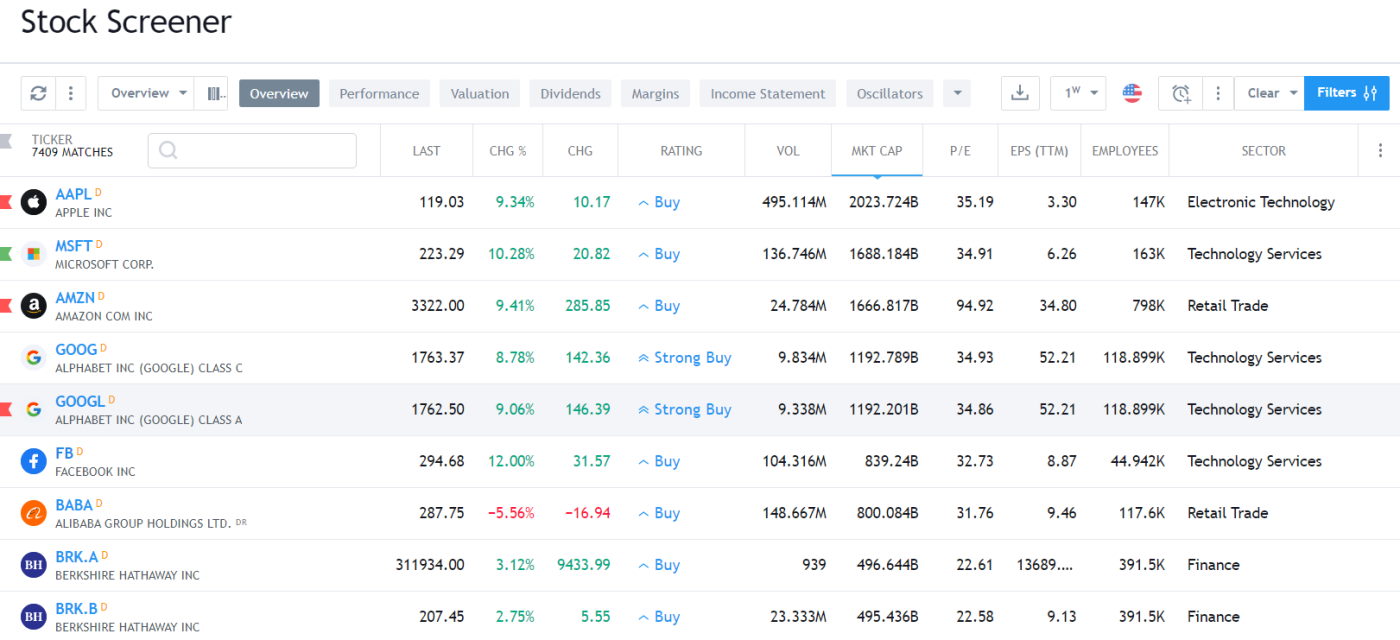
Looking at stock charts in Stock Rover, one can see that it differs from other free stock software on the market. Whereas MetaStock and TradingView focus on hundreds of technical price/volume indicators, Stock Rover focuses on charting the fundamental financial strength indicators.
Stock Rover has 154 financial ratios and 17 technical analysis indicators, making it ideal for long-term income, growth, and value investors.
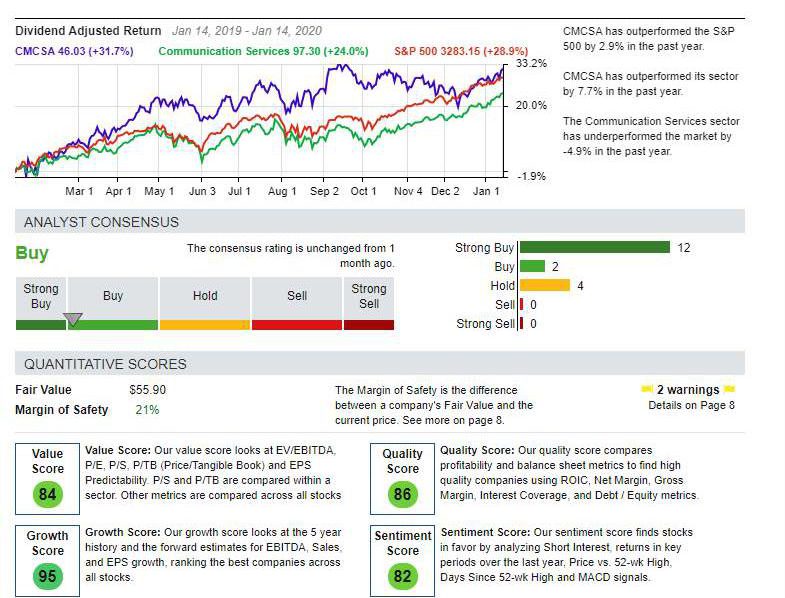
Stock Rover offers free stock analysis through its innovative research reports. The reports combine a company’s historical and forecasted financial data into a cohesive, unbiased analysis. The free stock analysis provides a real-time view of the company’s financial situation, earnings, and analyst consensus estimates. The research reports are available to download in PDF format for the Dow Jones 30 Index component companies.
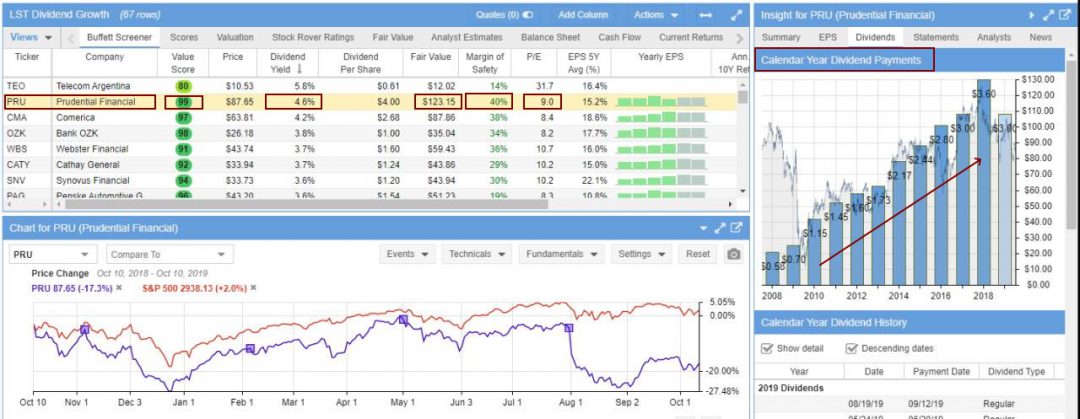
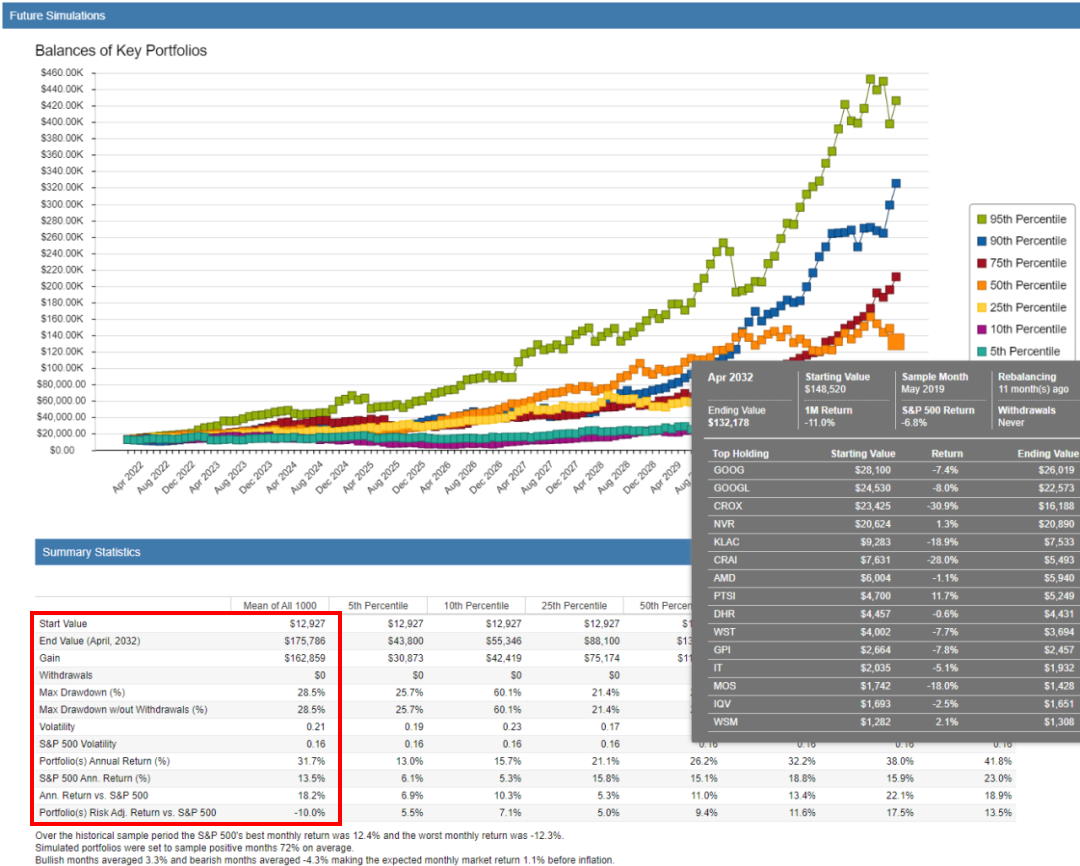
Testing shows that Stock Rover enables you to build a more informed value investing portfolio by integrating a deep set of Fair Value and Margin of Safety calculations. This enables the investor to rank stocks based on how much they are undervalued, according to the forward cash flow and fair value calculations popularized by Benjamin Graham and Warren Buffett.
When you log in to Stock Rover and select any screener—in this case, I selected the “Strong Buys Screener” and simply selected the “Fair Value” tab—you are rewarded with arguably Stock Rover’s killer features: the Fair Value and Margin of Safety analysis and rankings.
These analysis factors are difficult to calculate manually and could be said to warrant investment in Stock Rover alone.
[Related Tutorial: Setup Your Own Buffett Stock Screener With Stock Rover]
Stock Rover is incredibly easy to use. There are so many curated screeners and portfolios to import and use that you are instantly productive. Stock Rover’s ease of use is commendable, given its robust scoring and analysis systems.
3. Benzinga Pro: Free Real-time News & Charts
Benzinga Pro recently launched its free service for 2024, which has propelled it to number 3 on our list. Benzinga Pro is an excellent real-time news service with charting and advanced screeners for insider trades, market movers, and options alerts.
| Benzinga Pro Rating ? | 4.5/5.0 |
|---|---|
| ⚡ Free Features? | Charts, Real-time News, Financials, Market Movers [No Adverts] |
| 🏆 Premium Features? | Advanced Real-time News Filters & Scanning, Audio Squawk News, Signals, Options Alerts & Mentoring |
| 🎯 Best for | Stock Traders |
| 🆓 Free Version | ✅ |
| 🎮 Free Premium Trial | 14-Day |
| ✂ Premium Discount | Code "SMARTER" for 25% Off |
| 🌎 Markets Covered | USA |
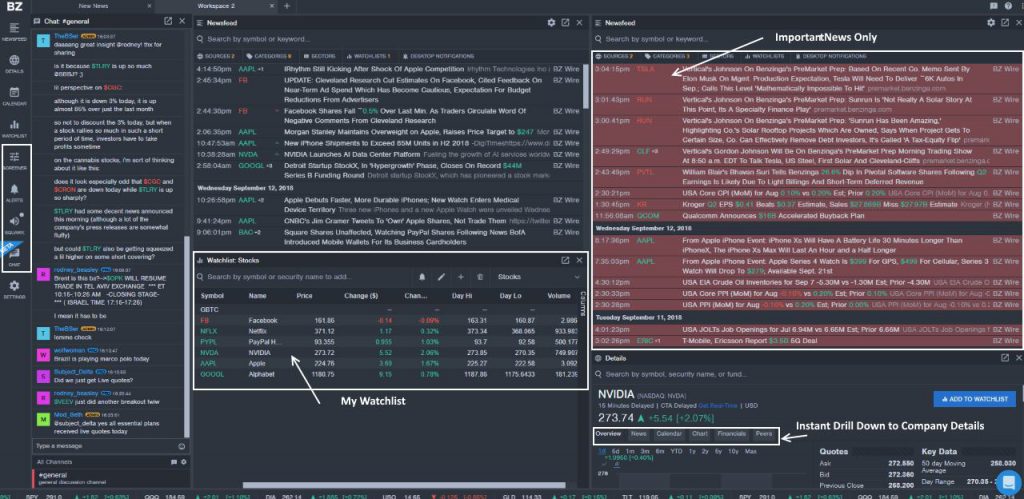
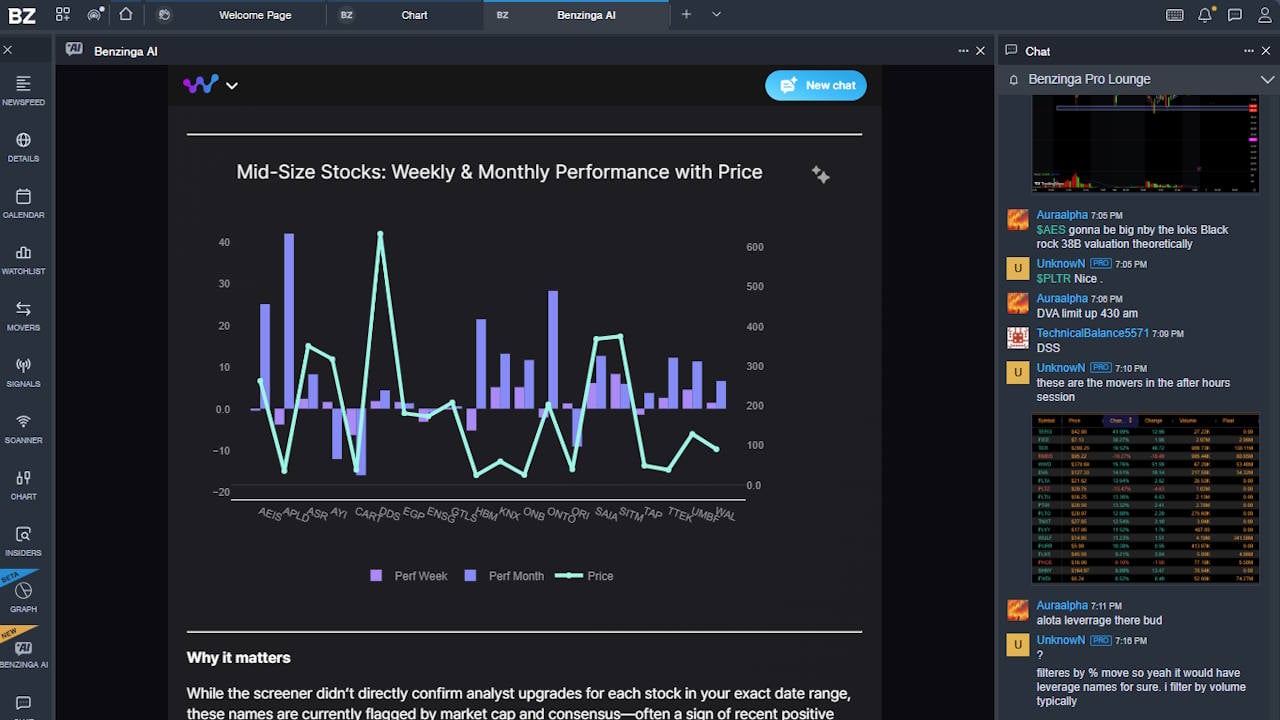
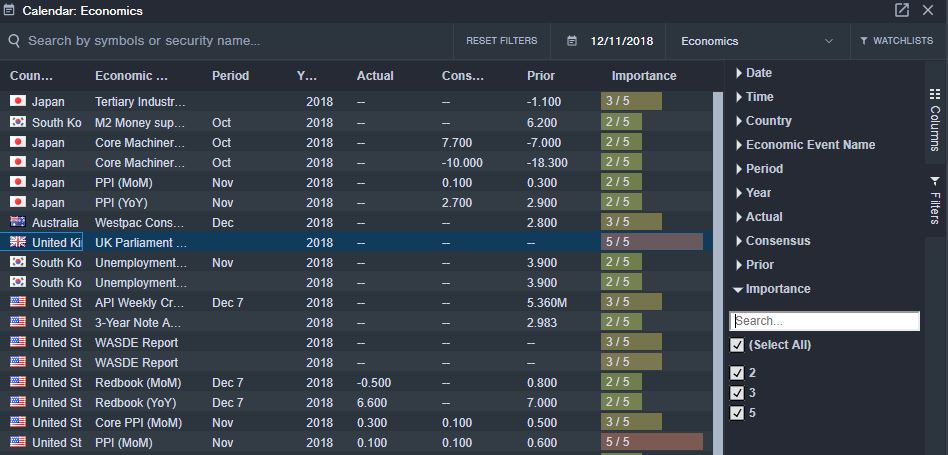
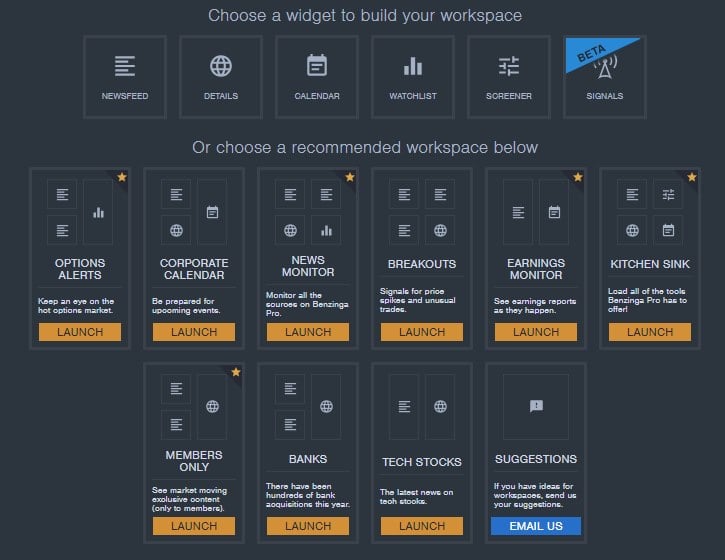
Benzinga Pro is now free, and the only platform with an outstanding free real-time news streaming service. Other services claim free real-time news, but it is nothing compared to Benzinga. Access to the BZwire news is incredible, but Benzinga also has free charting, market movers lists, and company financial details. These free services are rolled into an extremely flexible and configurable multi-screen interface.
The screenshot below shows how I have configured the free Benzinga service:
- Real-time Market Movers stock screener (top-left)
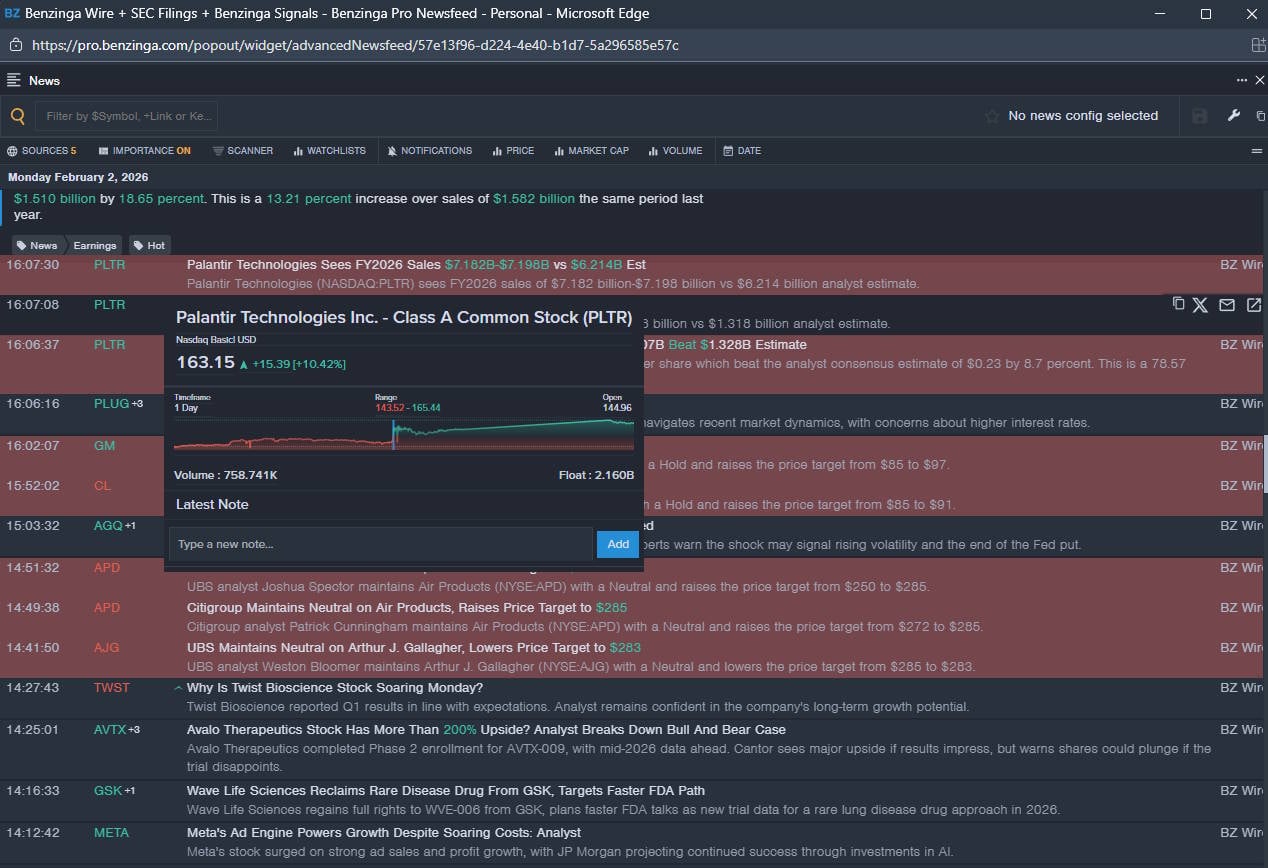
- Real-time BZWire Newsfeed (top-right)
- The integrated company financial details (bottom-right)
- Excellent stock charting engine (bottom-left)

Of course, Benzinga offers this service for free, hoping you will fall in love and upgrade to the paid services. There are plenty of reasons to upgrade because market-moving news gives traders a big edge. The paid-for services include high-value add-on benefits such as advanced newsfeed filtering, insider trading, and block trade alerts (which can be extremely lucrative for traders). I recommend the Benzinga Pro Essentials paid service if you choose to upgrade, as it includes all these features, real-time chart quotes, and unusual activity alerts.
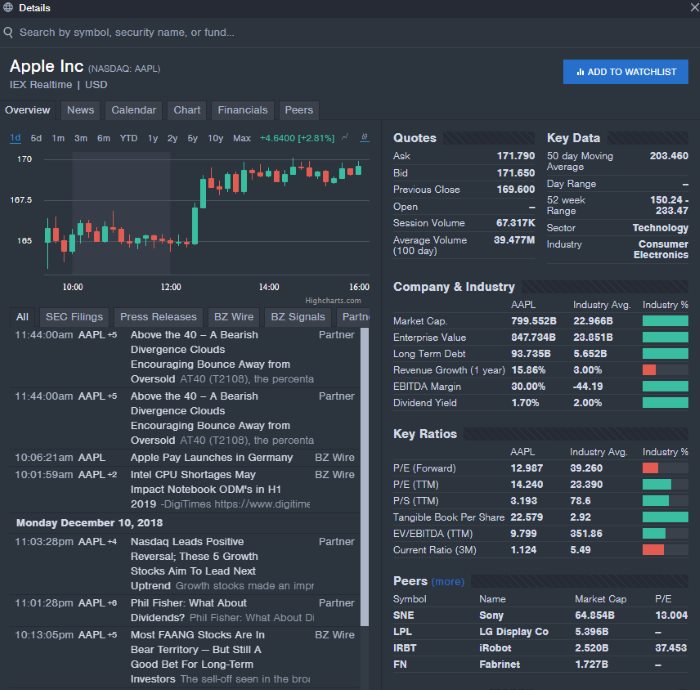
Core to the Benzinga Pro service is access to the real-time newsfeed, which updates quickly and effectively. BZWire includes all Securities & Exchange Commission (SEC) news and real-time PR newsfeeds. These can be incredibly important because SEC/FDA announcements can seriously move stocks.
Also, important company PR announcements are timed to coincide with or counteract the news, so receiving these as quickly as possible is a serious bonus.
Please do not underestimate the newsfeed; it is truly enormous. Despite the depth of financial content being released every minute, the Benzinga PRO web-based application is high-speed, responsive, and configurable. The configurable nature of the newsfeed is what makes the service so good.
Is Benzinga Pro Free Worth It?
Yes, I recommend signing up for Benzinga Pro free alongside any other stock charting software you use. It is the only credible, free, real-time news service in the world. But Benzinga packs in many other great features. Benzinga has come a long way with its services over the last five years, and I highly recommend it.
4. Finviz: Fast Free Stock Charting & Screening
Finviz provides lightning-fast free stock charting, robust screening, and, surprisingly, stock chart pattern recognition. Finviz lets investors visualize vast stock market data with heat maps and money flows on a single screen.
| Finviz Rating ? | 4.4/5.0 |
|---|---|
| ⚡ Free Features? | Charts, News, Watchlists, 50 Screener Configs, Heatmaps [Ad-supported] |
| 🏆 Premium Features? | Real-time data, Alerts, Correlation Charts, Backtesting, Data Export, 8 years of Financial Statements |
| 🎯 Best for | Beginner Investors/Traders |
| 🆓 Free Version | ✅ |
| 🎮 Premium Trial | 30-Day Money-Back |
| ✂ Premium Discount | -40% With Annual Plan |
| 🌎 Markets Covered | USA |
Finviz offers three pricing plans, including a free plan that doesn’t require registration. Registered users can also use the service for free and save their settings. Finally, the Elite service costs $39.99/mo or $24.96/mo annually, saving you 37%.
You can have Finviz for free; however, the real power of Finviz is unleashed with the Elite service, which provides real-time data and maximum flexibility.
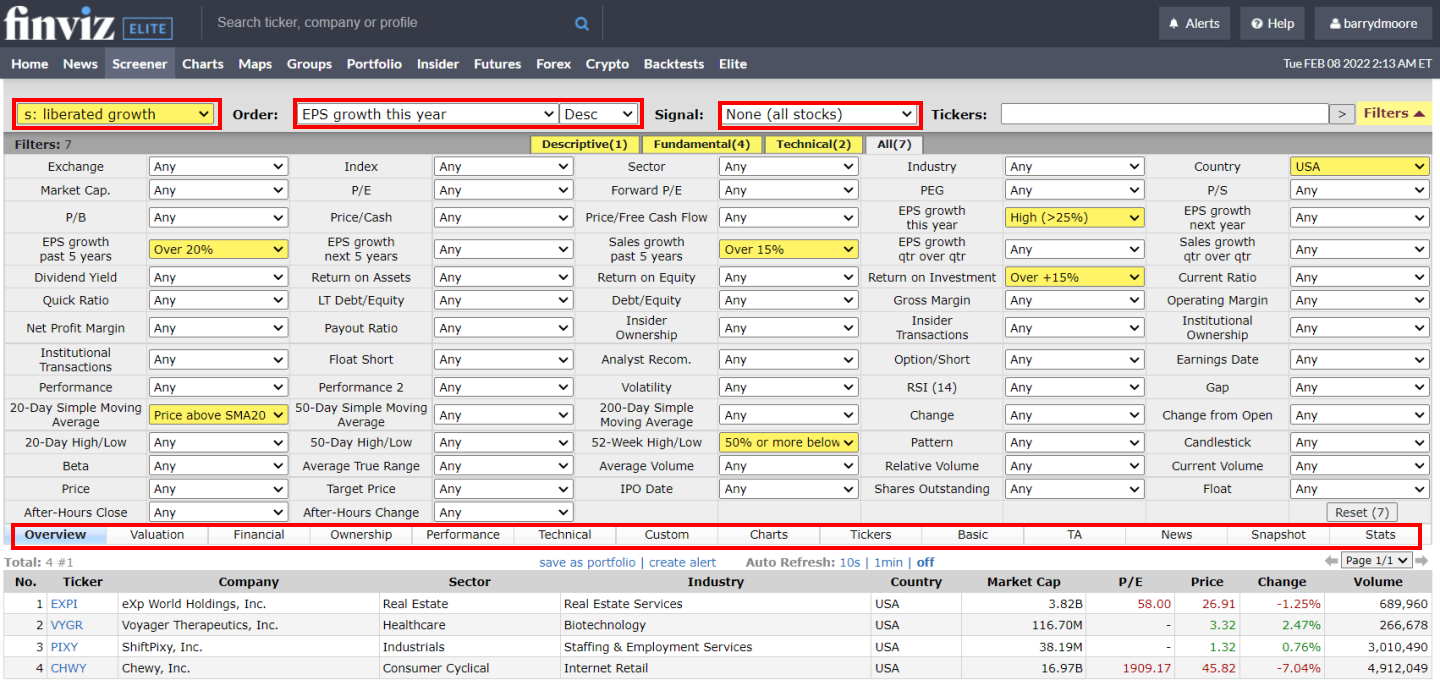
Finviz’s free plan is ad-supported but provides great value for beginner investors. You can scan and screen over 10,000 stocks without registering and use the delayed charts and news stream. The free plan is ideal for beginner investors who want to check the markets fuss-free.
If you like Finviz, I highly recommend registering for free. It provides all the features of the free version, and you can also configure 50 portfolios and 50 stocks per portfolio and save 50 screener configurations.
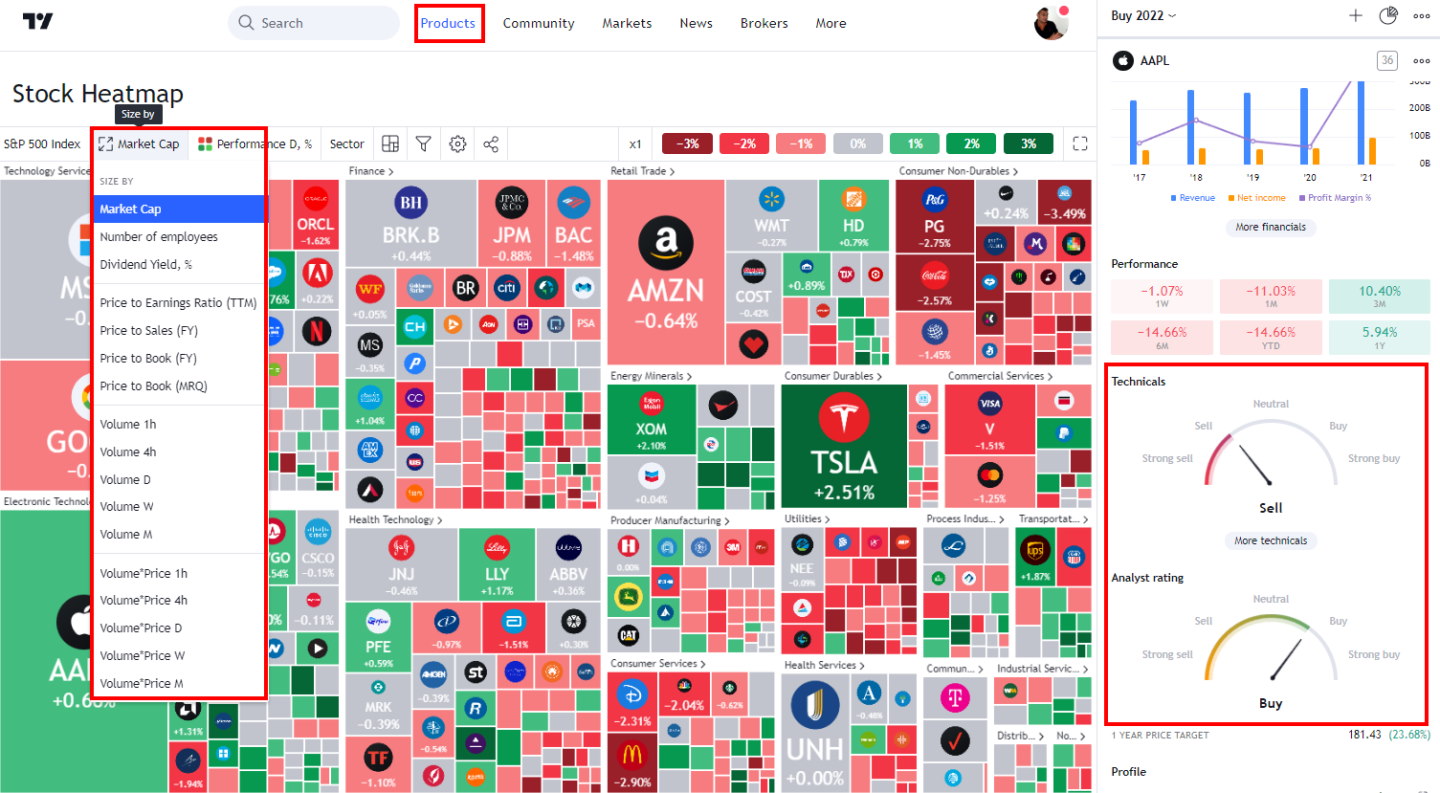
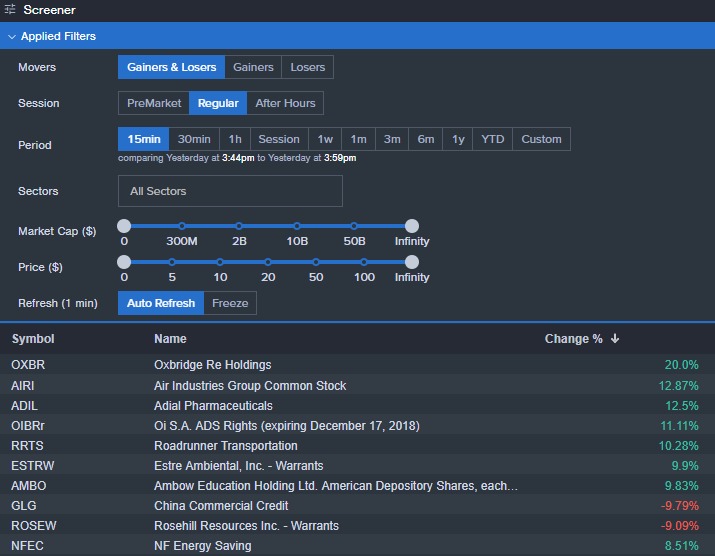
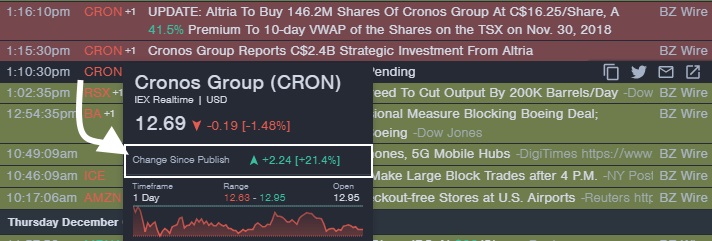
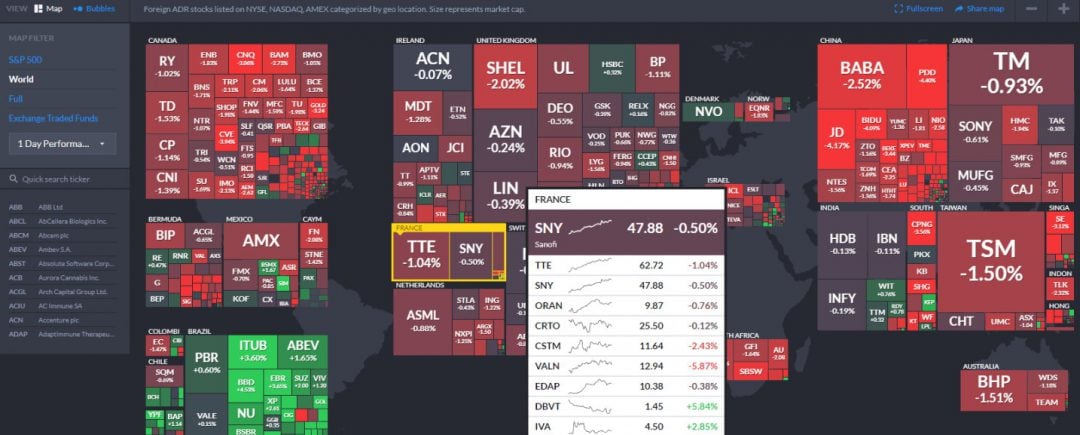
The Finviz heatmaps are the show’s star, providing a view of the US or the entire world’s stock markets. Finviz manages to cram the entire world’s moving stocks onto a single-page heatmap at lightning speed, which is very impressive. Hovering your mouse over a ticker symbol shows the stock’s current performance, a mini line chart, and the company’s direct competitors.
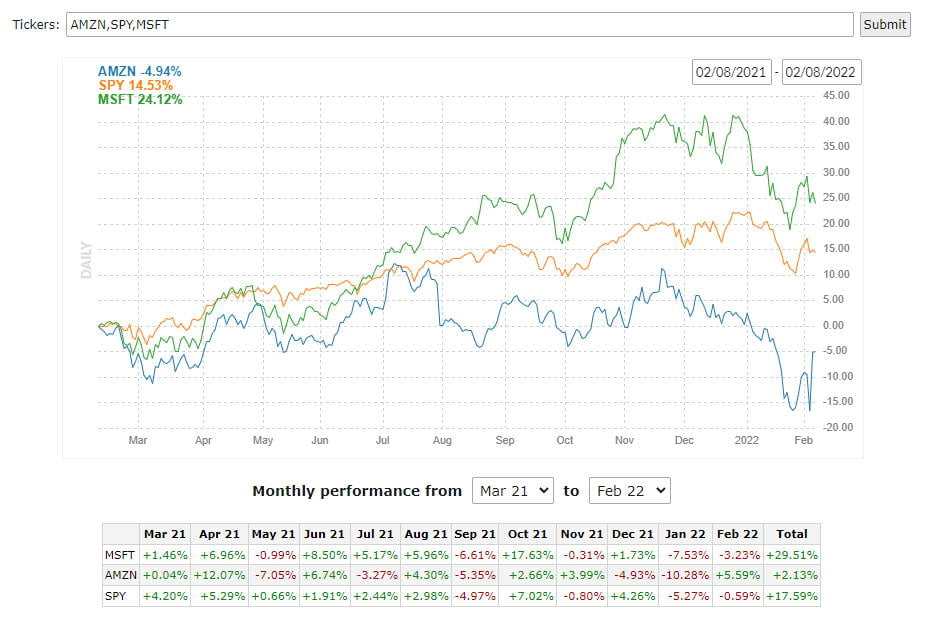
Viewing the Finviz stocks heatmaps based on analyst recommendations shows how biased institutional analysts are, as 70% of stocks are flagged as positive.
Finviz allows you to visualize markets based on stock price performance, volume, P/E, PEG, Dividend Yield, Float, EPS, and even analyst recommendations. From here, you can double-click on a stock and jump directly to the individual company data and chart. The whole process is extremely fast and efficient.
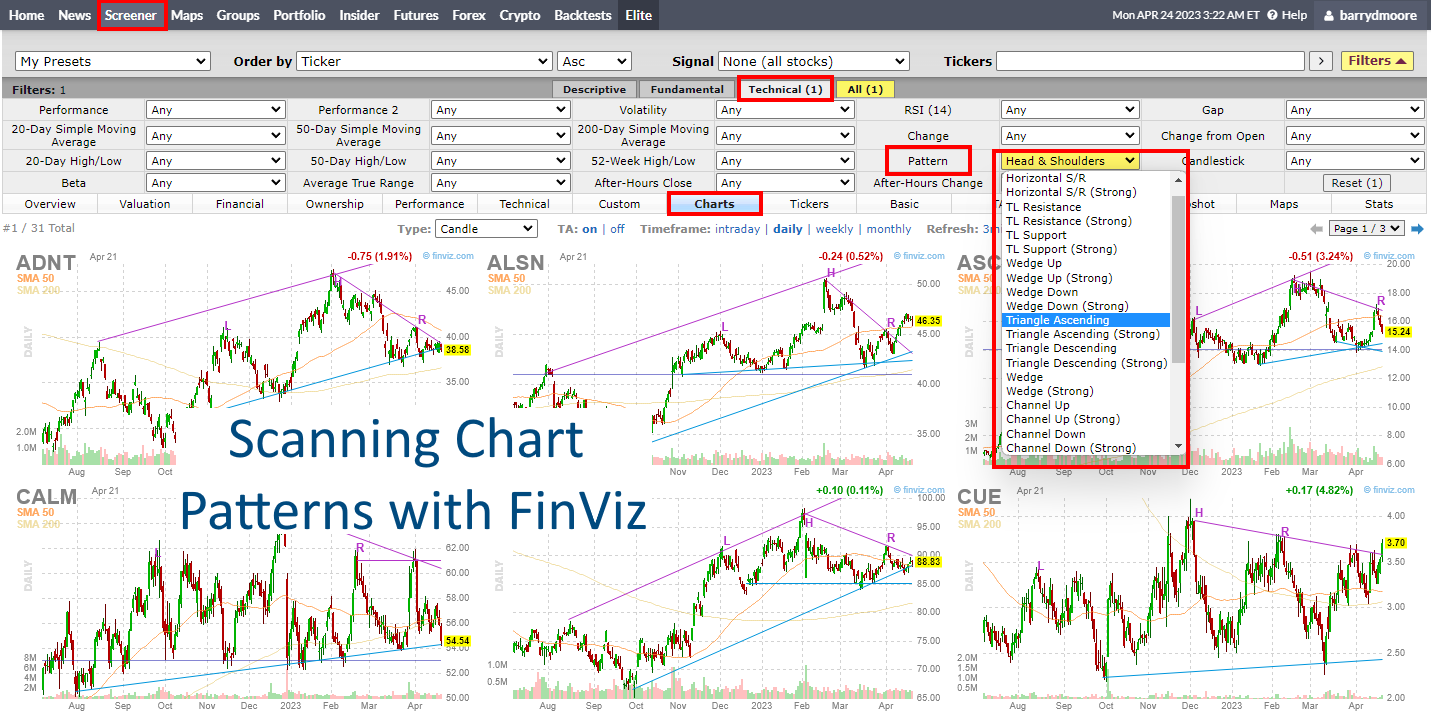
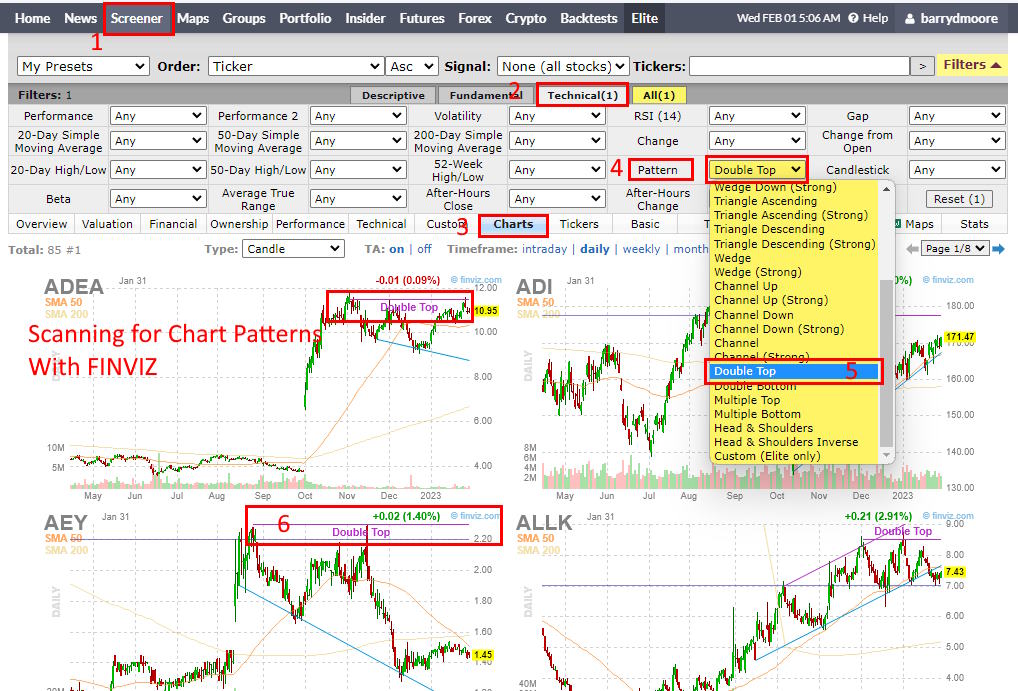
Finviz provides basic pattern recognition on daily charts and a few overlays and indicators. I like the Finviz automatic trendline recognition and how it identifies price patterns like wedges, triangles, double tops, and channels; this is a big advantage for pattern traders.
But, with only nine chart overlays, including Bollinger Bands and VWAP, and 17 chart indicators, the stock charting experience with Finviz is weak. Not only that, you cannot simply right-click and add an indicator or study; you have to open settings, select the indicators, and then click save. Finviz lacks an effective interactive workflow experience for users.
The free Finviz service is worth using. It offers excellent heatmaps, a free stock screening service, good news aggregation, and insider trading information. What more do you expect for free? Finviz provides incredibly fast stock screening, heatmaps, and stock chart pattern recognition.
5. ChartMill: Top Free Charting for UK, Europe & USA
My ChartMill review and testing has uncovered one of the best free and paid charting, screening, and stock analysis tools available. It’s unique free credit system allows users to access premium features without spending a dime.
| ChartMill Rating ? | 4.4/5.0 |
|---|---|
| ⚡ Free Features? | Charts, Watchlists, Screening, Stock Analyzer, 10-Year Historical Data |
| 🏆 Premium Features? | Automated Trendlines, Fibonacci, Candlestick & Price Pattern Recognition |
| 🎯 Best for | Beginner Investors/Traders |
| 🆓 Free Version | ✅ Try ChartMill for Free |
| 🎮 Premium Trial | ✅ |
| ✂ Premium Discount | ❌ |
| 🌎 Markets Covered | USA, UK, Europe |
ChartMill offers a comprehensive set of technical indicators, chart patterns, and drawing tools to analyze stocks. The platform is suitable for both beginners and experienced traders, making it a top choice for stock analysis.
ChartMill stands out thanks to its user-friendly interface and sophisticated stock screener, which merges technical indicators, pattern recognition, and financial metrics seamlessly.
ChartMill offers all registered users 6,000 credits per month to access all premium features for free. These credits roll over monthly up to a maximum of 60,000, enabling users to use the full functionality of the platform, albeit with light usage.
ChartMill provides a thorough rating system that assesses stocks using various technical indicators. The ratings span from highly bullish to extremely bearish, offering a concise overview of a stock’s technical situation. Below, you’ll find selection boxes for technical ratings, setup ratings, and candlestick pattern recognition.
One standout feature that I particularly admire is the automated pattern recognition tool. This tool meticulously examines 29 technical patterns, such as head-and-shoulders, double tops, and triangles. Moreover, the screener can detect 30 candlestick patterns, a crucial capability for day traders.
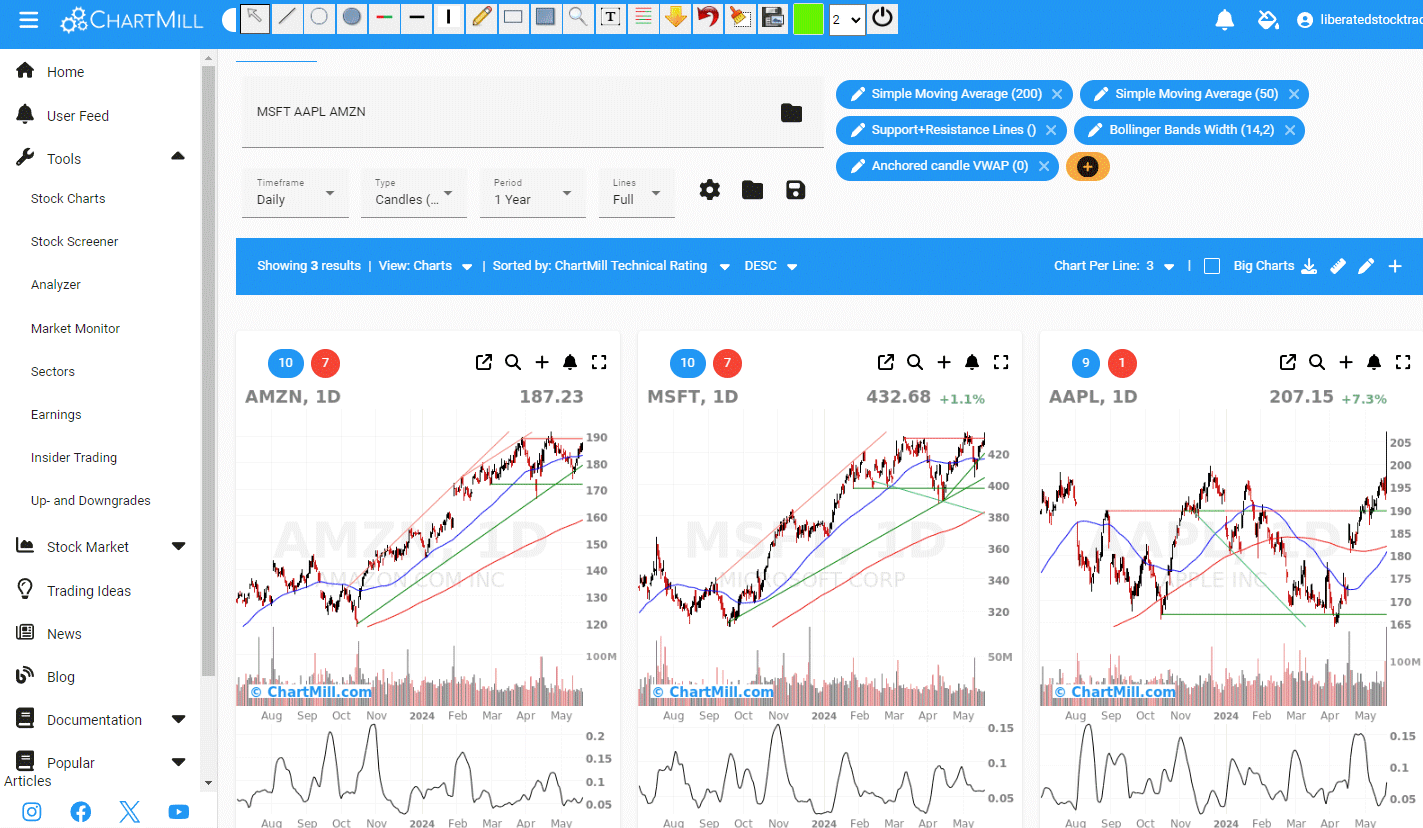
ChartMill’s stock screener stands out with its ability to filter stocks using over 238 criteria. While it includes standard profitability, dividends, financials, and valuation metrics, it goes beyond with unique elements like technical ratings, trade setup ratings, and trend intensity.
Another great tool is the ChartMill Analyzer, which helps you explore stock data more deeply. It provides detailed analysis using various technical analysis tools and screeners. Pre-built analyzers check for technical setups, affordable growth, value, dividend, and growth stocks.
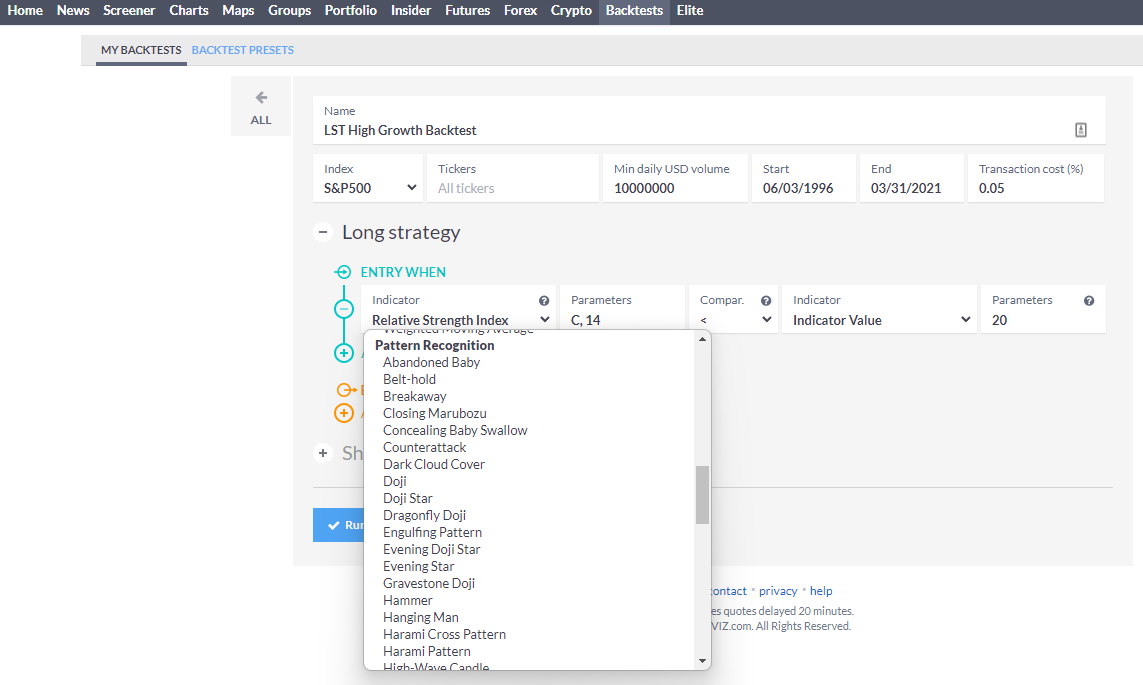
Finally, one of the most impressive features is the trading ideas functionality. Select a trading strategy, timeframe, and long or short, and you are presented with pre-built strategies. Trading strategies encompass growth, value, dividend, momentum, mean reversion, and pullbacks. Additionally, there are specialized squeeze-play tactics tailored for Meme stocks. Various timeframes are utilized, such as day trading, swing trading, position trading, and long-term investing.

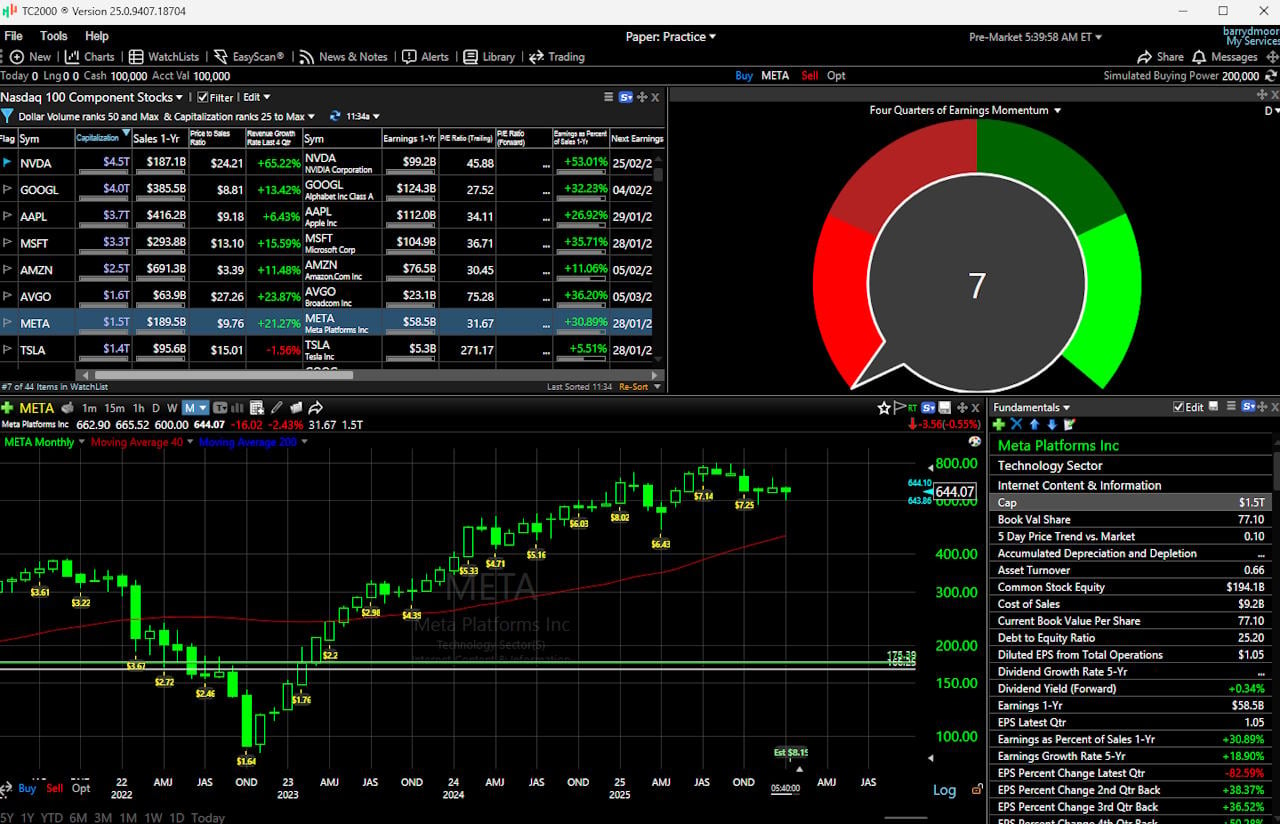
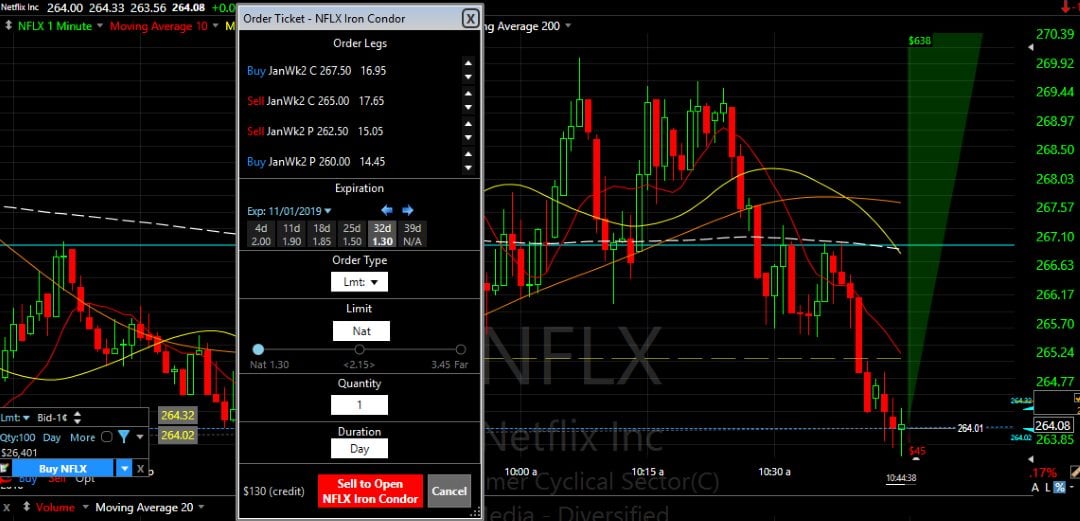
6. TC2000: Free Charting for Powerful Technical Analysis
TC2000 offers free stock charting with 140 indicators, 7 chart types, and 28 drawing tools. Chart data is delayed by 15 minutes, and the service is ad-free. TC2000 is free, and no credit card is required. You get stunning charts, all US stocks & options, option chains, and can paper trade for free.
| TC2000 Rating ? | 4.3/5.0 |
|---|---|
| ⚡ Free Features? | Intraday Charts, Indicators, 1 Watchlist, Options Chains, Paper Trading |
| 🏆 Premium Features? | Multiple Layouts & Charts, Alerts, Screening |
| 🎯 Best for | Stock & Options Traders |
| 🆓 Free Version | Download TC2000 Free |
| 🎮 Premium Trial | Free 30-Day |
| ✂ Premium Discount | -25% for Bi-Annual Subscription |
| 🌎 Markets Covered | USA |
TIP: When you download TC2000, ensure you select the free version.
The free TC2000 service has over 140 stock chart indicators (or studies) that you can apply to the chart; all the popular and exotic indicators are there. You can use different bar types, like Japanese Candlesticks and OHLC.
What is nice is that you can plot trendlines on the price data and all the indicators. This can be very valuable when you become more experienced in technical analysis.
They also allow you to use Fibonacci Lines, Fibonacci Fans, and Fibonacci Arcs in drawing tools. The user interface is simple and effective. With easy access to watchlists and stock scans, you must sign in to access and save your watchlists.
TC2000 is a great free software package with the following:
- A vast array of indicators
- Plot Trend lines not only on price but on all the indicators
- Fibonacci Lines / Fans / Arcs
- Free real-time streaming Price & Volume
- Intra-day 1 minute to 1 year per bar
- Integrated portfolio management,
- Powerful watchlists
The premium version has a powerful stock scanning system built in.
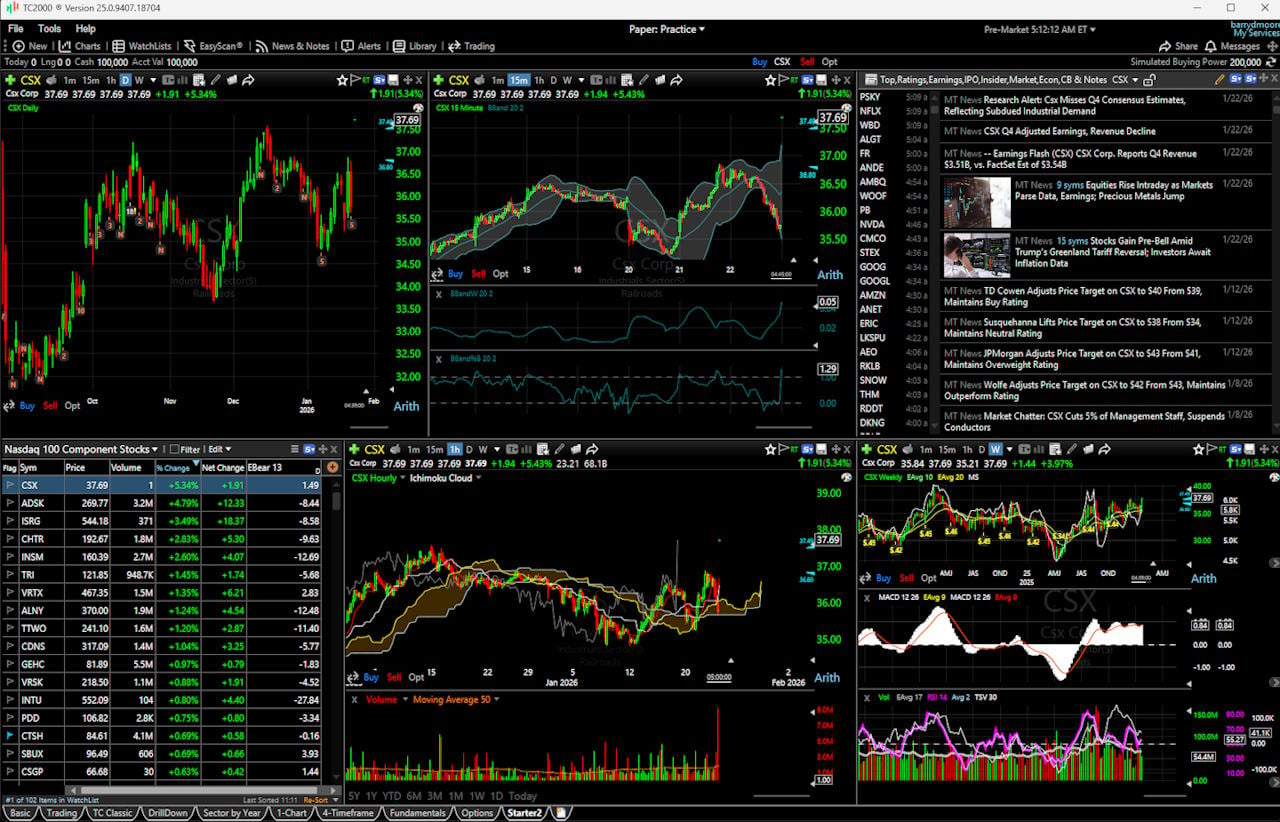
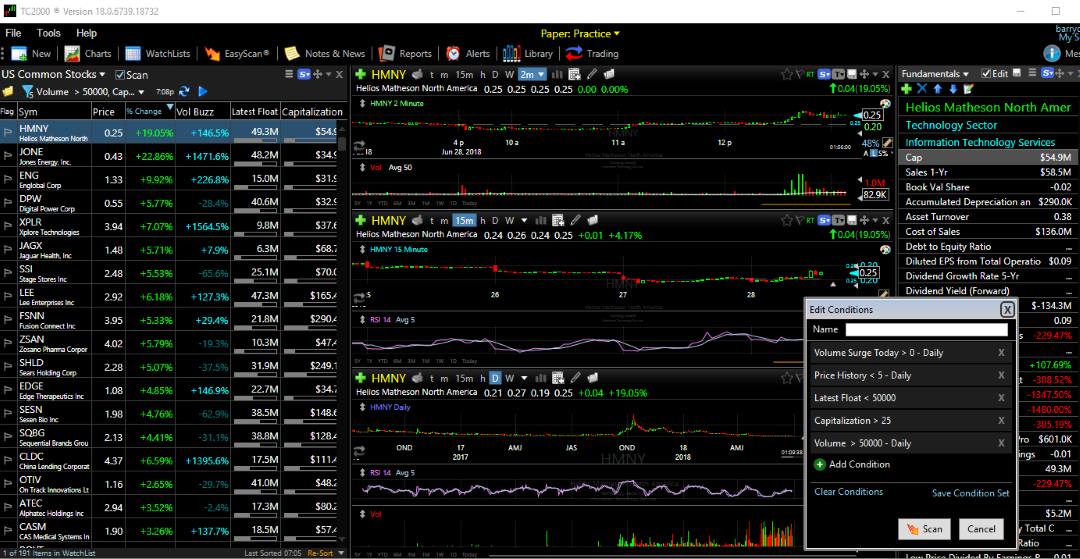
Overall, there is an excellent array of technical indicators and drawing tools; all the big ones are there, from OBV, RSI, and Bollinger Bands to Fibonacci Fans and Andrews Pitchfork. They have also introduced live alerts you can configure to email or pop up if an indicator or trend line is breached. Very useful indeed.
The charts are real-time, and the data comes from BATS, which means the price data is accurate, but the volume data only represents BATS trades. Luckily, you can select whether you want to see only BATS volumes or get an estimate of the broader market volume. The data is free real-time streaming of price and volume, and you can go to a granularity of intra-day, 1 minute up to 1 year per bar.
To avoid adverts and restrictions, you could upgrade to the silver service, which starts at $9.95 monthly. You will get a suite of scanning and sorting features and end-of-day data. If you are looking for free backtesting for stock strategies, TradingView is a better option.
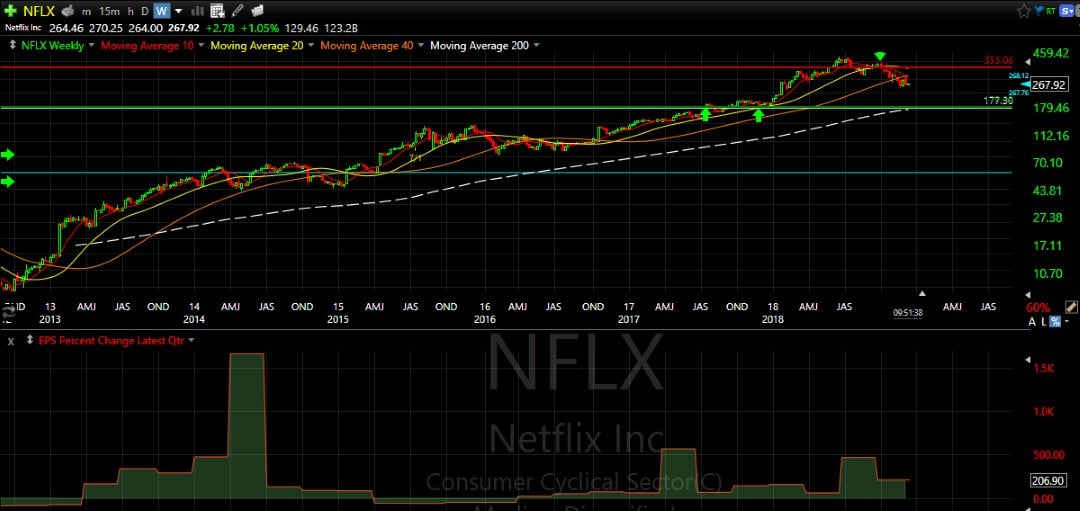
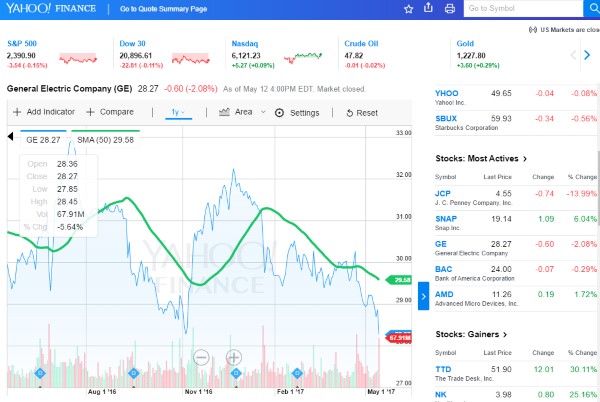
7. Yahoo Finance: Free Charts + Broker Integration
Yahoo Finance is improving its free stock charting experience every year. Yahoo has moved from 8th place to 5th on our list by providing an improved charting and screening experience with improved financial news coverage.
Yahoo has updated its interactive charting, and it is now a clean experience and runs full screen, so it is very good indeed. With 114 different technical indicators, you are well covered with Yahoo Finance. The interactive charts allow you to draw trendlines, linear regressions, and quadrant lines. A nice new addition is Yahoo, which now provides real-time quotes and charts via the BATS system.
| Yahoo Finance Rating ? | 3.9/5.0 |
|---|---|
| ⚡ Free Features | Charts, Trading, News, Watchlists, Basic Screening [ad-supported] |
| 🏆 Premium Features | Enhanced Alerts, Interactive Charts [ad-supported] |
| 🎯 Best for | Beginners |
| 🆓 Free Version | Yahoo Finance Free |
| 🎮 Premium Trial | Free 14-Day |
| ✂ Premium Discount | None |
| 🌎 Markets Covered | Global |
Yahoo Finance is working hard to make its charting system a worthy alternative to other free vendors. They have done something quite innovative. You can now trade stocks through the Yahoo Finance charts.
This means that you can trade stocks with your broker using Yahoo. It’s a nice feature, but if you have a brokerage account, you already have access to real-time data, charts, and quotes, and can trade directly with them. This seems a bit redundant, but it’s still a step forward.
Yahoo Finance provides a news aggregation engine and contributes original news via the Yahoo Finance news team. If you opt for Yahoo Finance Premium, you will get a good selection of analyst research reports. These static reports could be useful, but the $49.99 monthly price tag is expensive, especially since most mainstream brokers offer research reports for free. Firstrade offers free stock trades and research reports from both Zacks and Morningstar.
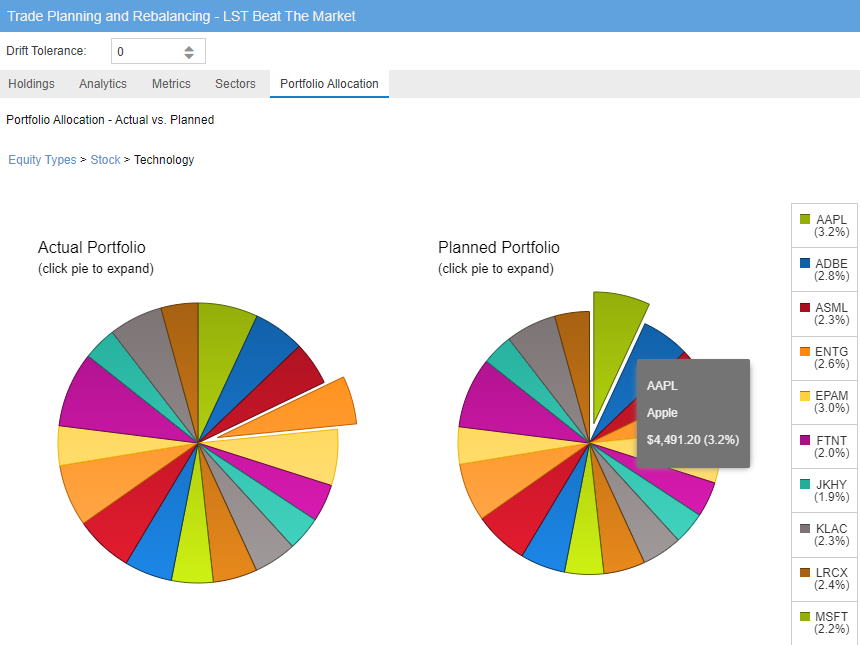
Yahoo Finance can connect to a wide variety of brokers. It can then download your stock position data and perform analytics on your portfolio, but you will require the overpriced Yahoo Premium subscription. There is currently no functionality in Yahoo Finance Premium for portfolio weighting, rebalancing, or automated portfolio management.
However, they report your portfolio asset allocation per industry sector and dividend income reporting.
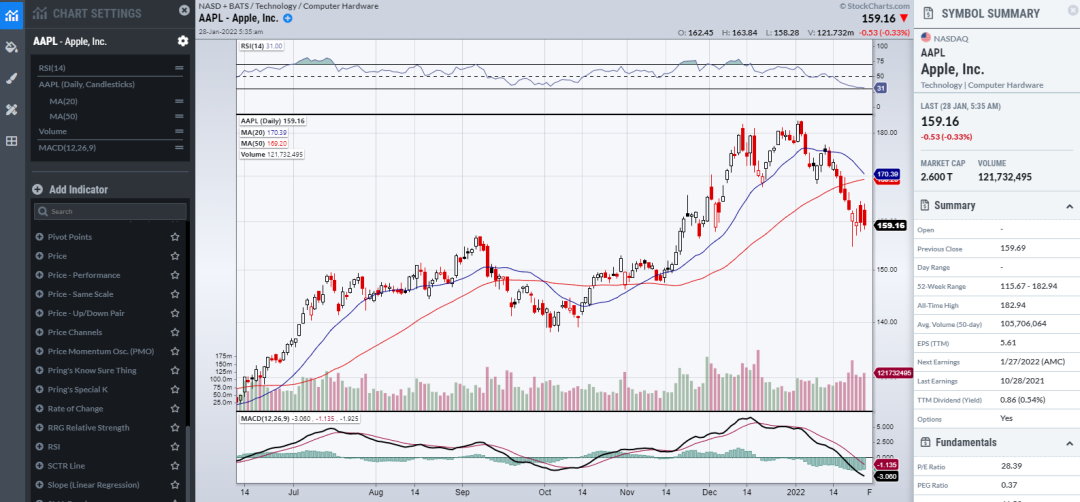
8. StockCharts.com: Charting & Expert Analysis
StockCharts.com is worth considering. The sharp charts are visually impressive, and the exotic indicators may appeal to more advanced investors.
| StockCharts.com Rating | 3.8/5.0 |
|---|---|
| ⚡ Free Features | Basic Charts, Seasonality Charts [ad-supported] |
| 🏆 Premium Features | Interactive Charts, Real-time Data, Trading |
| 🎯 Best for | Beginner Traders |
| 🆓 Free Version | StockCharts Free |
| 🎮 Premium Trial | Free 30-Day |
| ✂ Premium Discount | None |
| 🌎 Markets Covered | USA |
StockCharts recently released the Advanced Charting Platform (ACP), a significant improvement over the outdated charts of the past. Still, ACP is not as flexible and powerful as TradingView’s charting platform.
StockCharts provides a comprehensive suite of features for in-depth chart analysis. It has 66 chart indicators and 12 chart types, including Candlesticks, Heiken Ashi, and the unique Elder Impulse system.
StockCharts primarily focuses on the technical screening of price, volume, and indicators, including price pattern scanning for candlestick and Point and Figure charts.
StockCharts offers free access to its platforms; however, the free service is limited. TradingView offers free scanning and screening, backtesting, watchlists, and candlestick chart recognition, whereas with StockCharts, these benefits are only available to paying members.
- Related Article: StockCharts.com vs. TradingView: Head-to-Head Comparison
9. Robinhood: Simple Free Charts & Trading
Robinhood is a commission-free broker with a $0 account minimum. You can sign up for Robinhood and access stock charts and real-time quotes and charts for free.
| Robinhood Rating | 2.9/5.0 |
|---|---|
| ⚡ Free Features | Charts, Commission Free Trading, Watchlists |
| 🏆 Premium Features | Multiple Layouts & Charts, Alerts, Publishing, ad-free |
| 🎯 Best for | Stock, Fx & Crypto Traders |
| 🆓 Free Version | Yes |
| 🌎 Markets Covered | USA |
The only downside is that you cannot do any serious stock analysis using Robinhood. Because it is a mobile-first company, the interface is limited to the size of your phone.
Mobile-first refers to the fact that Robinhood started only as a phone app, not a fully-fledged trading platform. You must do everything via the phone, including opening, funding, and trading.
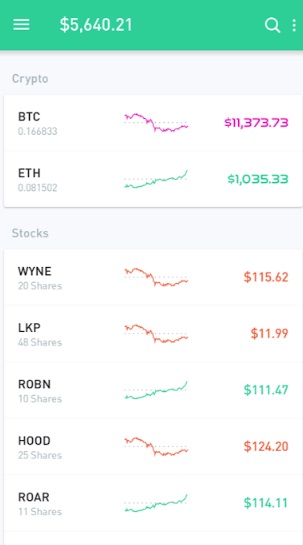
The charts are free but severely limited in functionality. Free trading refers to $0 commissions for Robinhood Financial self-directed individual cash or margin brokerage accounts that trade US-listed securities via mobile devices. Robinhood is a mobile-first company, so if you trade from your smartphone on the major US-listed stocks available through Robinhood, then the trade is free.
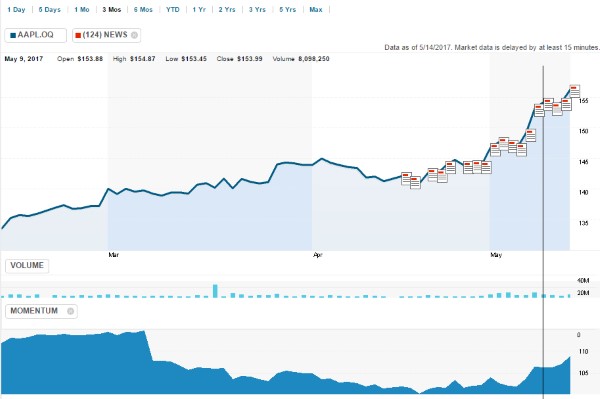
10. Reuters: Free Stock Market News & Charts
With its powerful news reporting and RED Green Candlestick plotting, Reuters has something to offer. However, its lack of a rolling EPS indicator, combined with its lack of trendlines, puts it out of the reckoning for overall leadership.
| Reuters Rating | 2.8/5.0 |
|---|---|
| ⚡ Free Features | Basic Charts, Global News |
| 🏆 Premium Features | Multiple Layouts & Charts, Alerts, Publishing, Ad-free |
| 🎯 Best for | Stock, FX & Crypto Traders |
| 🆓 Free Version | Reuters Markets |
| 🌎 Markets Covered | Global |
I like the ability to plot breaking news for a stock on the chart itself; this sets it apart from the other charting tools. It is an OK service for quickly referencing the global markets and perusing the news, but it is useless for chart analysis.
Final Verdict
Our four test winners are TradingView for global charting and community. Stock Rover for value, income, and growth investors. Benzinga Pro is best for real-time news, and Finviz is best for fast, reliable screening. Finally, don’t forget ChartMill; it is innovative, powerful, and offers full free access to its platform.
The market for free charting services is competitive, but some clear winners offer great free services and additional add-ons for a fee. Ultimately, what you select is down to your needs. If you are a new investor with a few hundred dollars, you certainly will not buy a premium stock charting package for $30 per month; you will use the free stock charting services.
But as you mature and your investment pot grows, you must consider selecting a professional-grade stock charting software package.
Best of luck as you embark on your quest to discover the tools that will empower you.
Related Articles:
- TradingView vs. TrendSpider: Who is the King of Charts?
- StockCharts vs. TradingView: Head-to-Head Comparison
- 30 Best Stock Market Websites for Investors
FAQ
What are the best free stock charts?
The best free stock charts for most traders and investors globally is TradingView. TradingView covers all international stock exchanges and has robust backtesting, excellent charts and indicators, and a powerful stock screener. Add to this a community of 13 million active users, and you have the best free stock charting service.
How to use free stock charts?
To use free stock charts, you can register with either TradingView, Benzinga, or Stock Rover, and you can use their free charts. If you do not want to register, you can use FinViz, which does not require an email or password.
Are there any free real-time live stock charts?
TradingView offers free live stock charts for all US NASDAQ & NYSE stocks supported by the BATS exchange. For real-time live data in other countries, TradingView charges an industry-low $2/mo per exchange. Here is an article on free real-time live chart services.
What are the best free stock charts for swing trading?
For swing trading, our research shows that the best free charts are TradingView, FinViz, and Benzinga Pro. TradingView provides real-time US stock data, Benzinga Pro provides free real-time news, and Finviz recognizes stock chart patterns for swing traders.
Are there any free and reliable alternatives for TradingView?
Good free alternatives to TradingView are Stock Rover, TC2000, FINVIZ, or Benzinga Pro. Each of these alternative services is reliable and delivered by reputable, established companies. See our article I Tested 10 TradingView Alternatives: Here’s the Best
How slow are free stock charts?
Free stock charts do not need to be slow! Free stock charting services typically provide data with a 15-minute delay, but some services like TradingView offer fast real-time charts for all US NYSE & NASDAQ stocks.
Hi, you are correct. I also mentioned it in the article. “Missing trend lines, rolling EPS, and a weak news service do not do it justice. They do also offer, like the other service providers, a monthly Membership service with increased functionality. One drawback is the fact that the charts are not really interactive, this impacts the user experience because you need to keep refreshing the page when adding indicators.”
“StockCharts: Best for Advanced Charts & Experts Analysis” is not free. They want to be paid.
Hello Barry, there is a new stock charting launched by ChartNexus. Its now all web-based. Not only they have delayed market data, but they also have fundamental data and user custom alerts available on the platform as well.
In addition to that, the chart layout is very much customizable based on users preference. Do check them out at:
http://www.chartnexus.com/cnx
Could you have a review on this platform as well?
Thanks.
Hi Neil, thanks I will check it out on next update
Barry
You left out Morningstar charts.
Easily the best I have ever used in terms of simplicity and comparisons.
Not a technical charter’s dream chart but extremely useful nonetheless.
Unfortunately, I believe the classic chart which gave an option for rolling returns, price and growth seems to no longer be supported.
That’s a shame.
Hi Pejman, the clear leader for fundamental analysis is Stock Rover.
I have created a great fundamental system for growth stocks with Stock Rover called LST Beat the Market System.
I manage my portfolio with it and use it for screening. But it is only for US and Canada Stocks and ETFs. For international, it is Metastock with Refinitiv or TradingView.
The Stock Rover review is here, it is the best by far for fundamental analysis, and quite inexpensive.
hi, which sites are good for fundamental analysis of stocks.(which one is the best)?
Hi Harry, for options chains & trading in the US I would go for TC2000. And Yes to access from MAC.
Barry
Hi Barry
Good review – thanks. Can be a nghtmare to select!
I am moving towards Trading View or TC2000. Was put off TC2000 when it was standalone FreeStockCharts.com because it needed Silverlight and my PC at that time could not run it. Does it still need Silverlight? Also, does either of these offer option chains? And finally, I assume that the same layout, watchlists, etc can be accessed through iPad, Mac and Wintel?
Thanks!
Hi Josefine, yes it sure does. Go to this address and you can download TC2000 for free. https://www.liberatedstocktrader.com/tc2000/
Does TC2000 still have a free version? Can’t see there being an option to download a free version.
Hi JD, T2000 also offers widgets to subscribers. has the only other one I know about.
Good backtesting is TradingView and MetaStock. See here.
The very best portfolio tracking is with Stock Rover. https://www.liberatedstocktrader.com/best-stock-backtesting-software-strategies/
Hi Barry –
Amazing work & very useful…thank you.
Not sure if this is your area…but I know TradingView offers access to its tools for those who wish to incorporate their functions within their web. I’m wondering if you know of anyone (TradingView or other) that may also include in their capabilities the ability to create custom technical analysis & charts through scripts/code (that…if possible could either be created by a non-programmer) that may also leverage off their existing technical analysis functions ?
Also…related to #1…do you know if TradingView or other provides any of the following information? :
a. Implied volatility (that could be charted or ideally put input into another formula & charted) ?
b. Options data (eg. greeks) for optionable instruments.
c. Are you aware of any platforms they may have either basic back testing or basic portfolio performance tracking ?
Any thoughts would be greatly appreciated.
All the best
Hi Michael, it is free, but if you want to unlock the real power, you are right you have to pay.
thanks for the input
Barry
Tradingview is a good charting tool. Its not free!!!! Tradingview limits the number of indicators on your charts and the charts you can save.
Why thank you, Thomas, I really appreciate your feedback and I hope it helps you make a good decision.
Barry
Hi Barry,
A very comprehensive and well presented analysis.
I am an old hand considering re-entering the field after much research.
I am not ready to start as the field is far more complex compared to what I was used to .
Thank you for your presentation.
Yours Sincerely
Thomas ( Ret’d)
2311 HRS W S T 25/06/2019