Technical analysis is a key methodology used to predict future asset prices by examining supply and demand. It utilizes historical market data, primarily price and volume, to estimate the future direction of asset prices.
Our ultimate guide to technical analysis, with its 14 videos and detailed examples covering charts, trends, indicators, patterns, and tools, will fast-track your knowledge.
Technical analysis relies on the premise that prices move in trends and that these trends can be identified through the study of market action. It does not consider the company’s underlying financial conditions or the overall economy.
Key Takeaways
- Technical analysis and fundamental analysis are the two cornerstones of asset price prediction.
- It forecasts price movement probabilities based on historical market data and trends.
- Investors use chart patterns and indicators to identify trading signals and assess market conditions.
- Stock price and volume are combined into indicators to assess supply and demand, which helps forecast market direction.
- This analysis considers trading psychology and market sentiment to complement its predictive models.
Technical Analysis Simplified
In simple terms, technical analysis assumes that if a stock price increases and more people buy it at higher prices, the asset price will continue increasing. In contrast, if prices are decreasing and more people are selling than buying, we expect the downtrend to continue.
If the price increases and the number of buyers decreases, we can expect the trend to slow or change direction.
Technical analysis is the study of supply and demand using price direction and the volume of trades.
When plotted as a chart, these price movements are known as price trends, and these trends form patterns over time. Trends, patterns, and indicators are the cornerstone of technical analysis.
What is Technical Analysis?
Technical analysis is a methodology that transforms market price and volume data into charts, patterns, and indicators to interpret supply and demand and, therefore, market sentiment.
It uses charts to interpret market psychology by studying price movements and trading volumes. Many technical analysts find the underlying financial details of individual securities less relevant.
Technical analysis considers market sentiment through supply and demand, which are reflected in the price movements on charts.
Understanding Price Movements
Price movements are the core focus of technical analysis, reflecting all known market information. Analysts monitor price trends and patterns to predict future activity based solely on the security’s historical and current prices.
They do not typically concern themselves with a security’s intrinsic value. Instead, they focus on the patterns and trends that suggest where its price could move next.
The Importance of Volume
Volume, the total number of shares or contracts traded in a given period, is a primary indicator of market strength. High volume suggests a strong interest in a security, indicative of the pressure from supply and demand that will likely propel price movement. Low volume may indicate uncertainty and less reliable price movements, making trends less predictable.
▶️ Video: Understanding Volume
Try TrendSpider, The Trader’s Tool of Choice
Support and Resistance Concepts
Support and resistance levels are critical tools in Technical Analysis. Support is the price level at which demand is considered strong enough to prevent the price from declining further. Resistance, conversely, is the ceiling where selling pressure overcomes buying pressure, and a price increase is halted. These concepts are pivotal in determining the price points at which markets tend to reverse their direction.
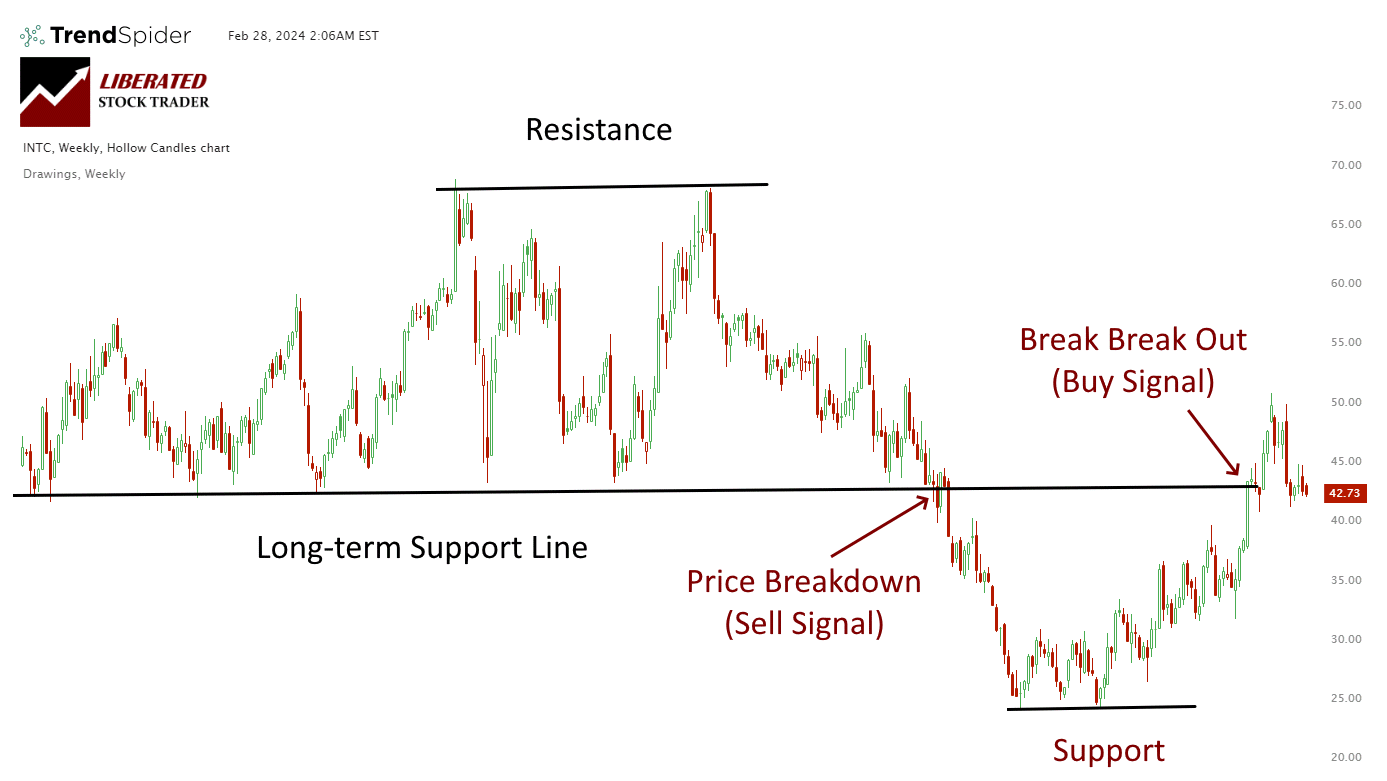
Understanding these basic principles allows one to interpret market dynamics and make more informed trading decisions.
Types of Charts
In technical analysis, charts are crucial in visualizing price movements and market trends over various time frames. Traders and analysts utilize nine chart types to identify patterns and make informed decisions.
Stock chart types include OHLC and Candlestick charts displaying open, high, low, and close prices. Raindrop charts incorporate volume data. Heikin Ashi charts reduce price volatility. Kagi, Line Break, and Point & Figure charts focus on trends without a timeline.
▶️ Video: Stock Chart Types
Video Research Performed with TrendSpider
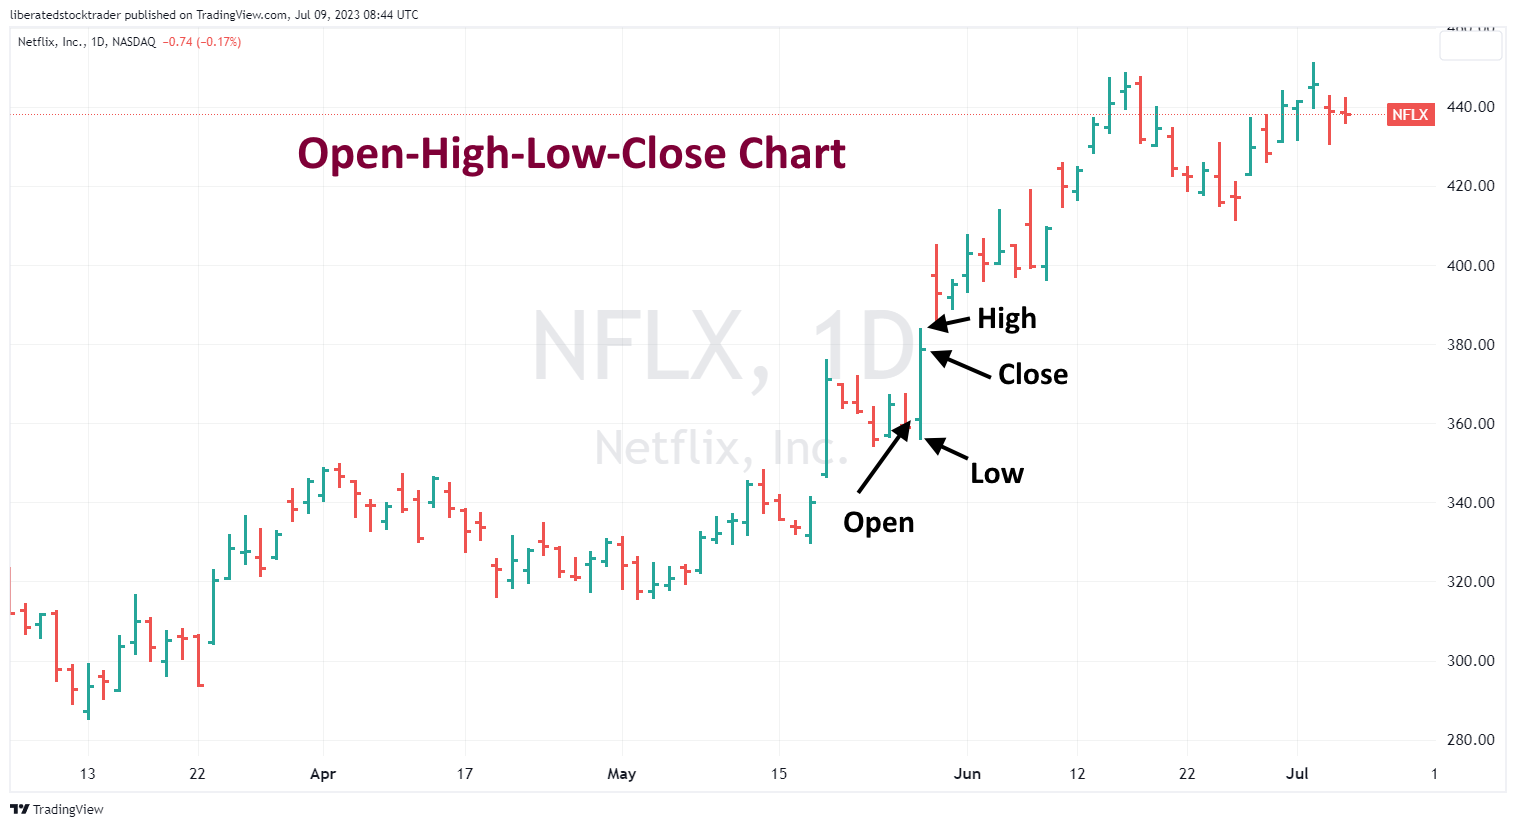
Candlestick Chart Analysis
Candlestick charts are a popular tool for traders due to their extensive information display. Each candlestick represents four key prices: the open, close, high, and low within a specific time frame.
▶️ Video: Candlestick Charts
For instance, a single candlestick may symbolize a day of trading or an hour, depending on the chart’s time scale. Reliable patterns, such as doji or hammer, can signal potential market reversals or continuations.
TradingView 4.8/5⭐ : The Best Trading Platform I’ve Tested in 20+ Years
With lightning-fast charts, powerful pattern recognition, smart screening, backtesting, and a global community of 20+ million traders — it’s a powerful edge in today’s markets.

If you want one platform that gives you an edge, this is it.
Reading Chart Patterns
Analysts discern chart patterns to forecast future price movements. These patterns, found across candlestick, bar, and line charts, can be classified as either continuation or reversal patterns. They rely heavily on the visual analysis of the charting data; familiar patterns include head and shoulders, wedges, and triangles’.
▶️ Video: 12 Chart Patterns
Mastery of chart patterns can enhance an investor’s ability to anticipate market behavior.
Technical Indicators and Oscillators
Technical indicators and oscillators are pivotal tools in technical analysis, providing traders with insights into market trends, momentum, and volume. They are the foundation for making informed trading decisions based on past market performance.
Moving Averages
Moving averages are fundamental indicators that smooth out price data to form a trend-following line. The most common types are the Simple Moving Average (SMA) and the Exponential Moving Average (EMA).
▶️ Video: Moving Averages Indicator
The SMA calculates the average price over a specified number of periods, while the EMA gives more weight to recent prices and reacts more quickly to price changes.
Momentum Indicators
Momentum indicators measure the speed of price changes and help traders identify overbought or oversold conditions.
Momentum indicators are chart overlays used in technical analysis to help traders identify the strength and direction of a stock’s price movement. They work on the idea that a trend will persist until there’s a shift. By examining how fast a stock’s price changes, these indicators can show if a stock is overbought or oversold and predict if a trend will continue or reverse.
There are various momentum indicators, each with pros and cons. Three common ones include RSI, MACD, and Stochastics.
Relative Strength Index (RSI)
Relative Strength Index (RSI) measures the strength of a stock’s price movement over a set period. Ranges from 0 to 100. Readings above 70 signal overbought conditions, and below 30 signal oversold.
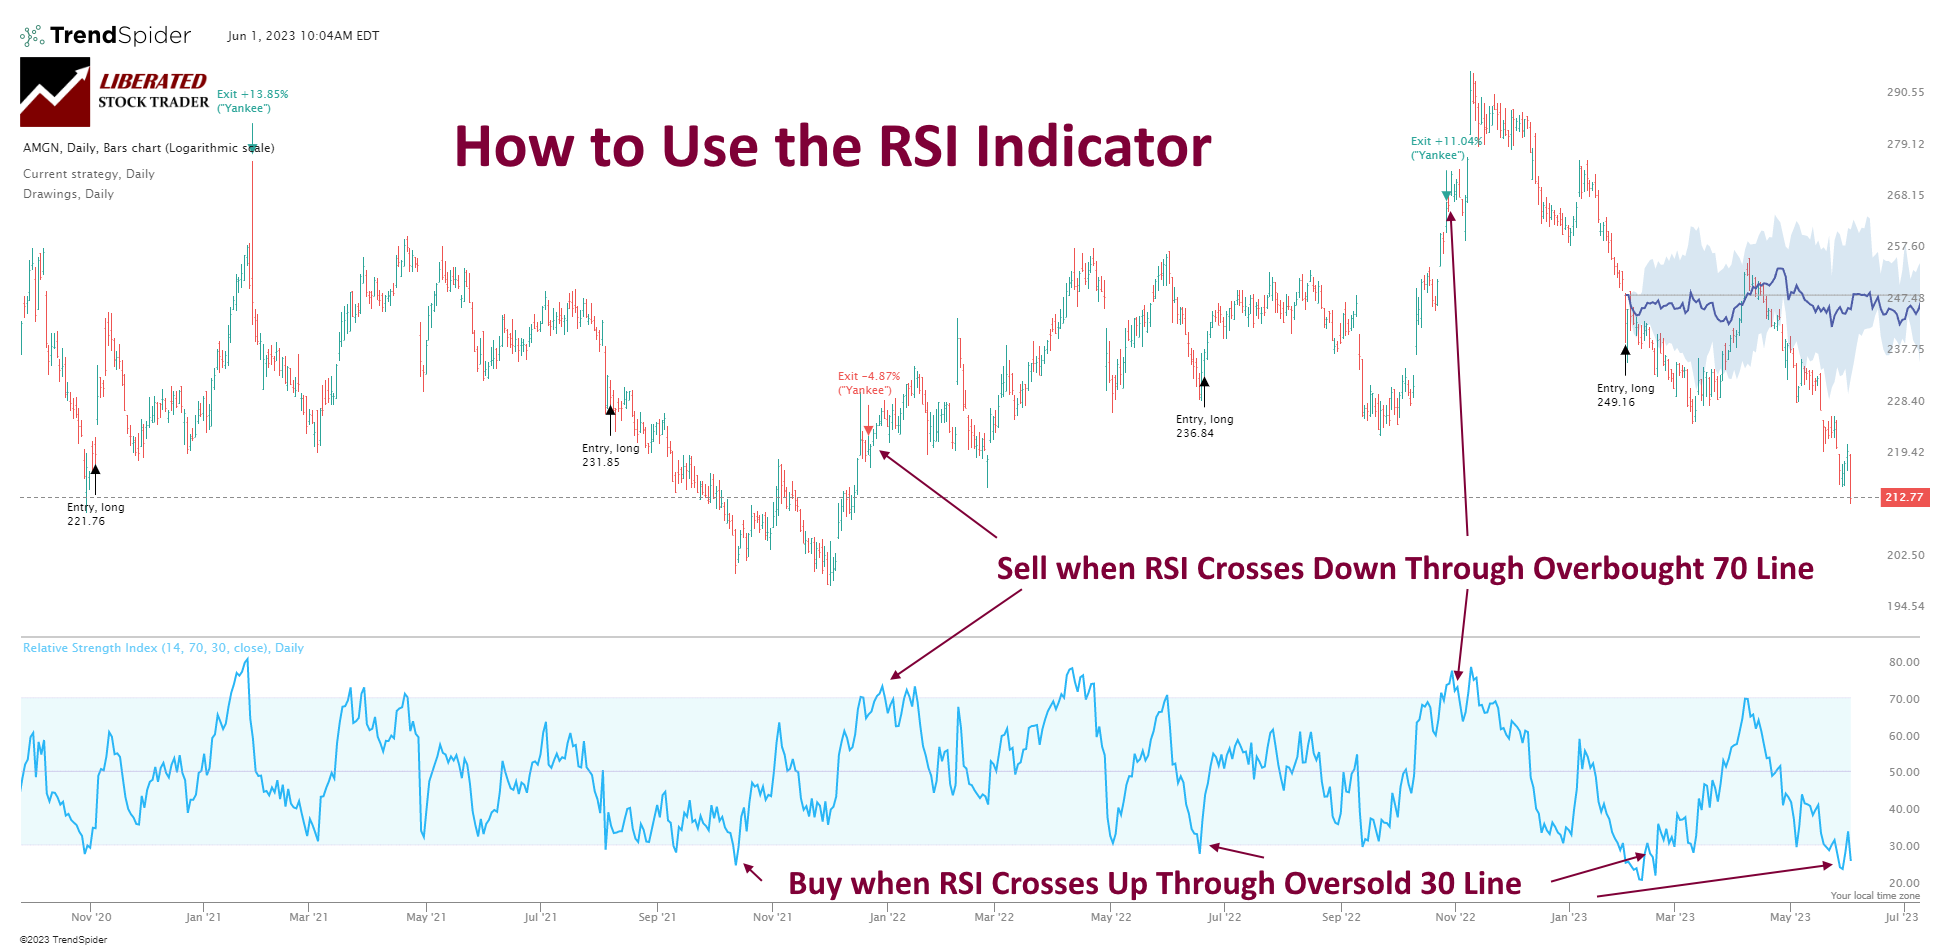
▶️ Video: RSI Indicator
Moving Average Convergence Divergence (MACD)
Moving Average Convergence Divergence (MACD) compares two moving averages of a stock’s price. A positive reading indicates a short-term average above the long-term, a bullish sign. When the MACD histogram is below the center line, it is bearish.
▶️ Video: MACD Indicator
Stochastic Oscillator
Stochastic Oscillator: Gauges a stock’s price compared to its range over a specific period. Scale from 0 to 100. Above 80 means overbought, and below 20 means oversold.
▶️ Video: Stochastics Indicator
Volume and Volatility Indicators
Volume indicators quantify the amount of trading activity and provide insights into the strength of a price move. High volume often indicates strong interest in a stock. Volatility indicators, on the other hand, reflect the rate and magnitude of price changes.
These indicators are indispensable for assessing market sentiment and potential price breakouts or reversals.
Trend Analysis and Forecasting
Trend analysis plays a pivotal role in the technical analysis ecosystem. It gives traders and analysts insights to predict market trends and shape forecasting strategies. This analysis leans heavily on historical data to identify the likelihood of future price movements.
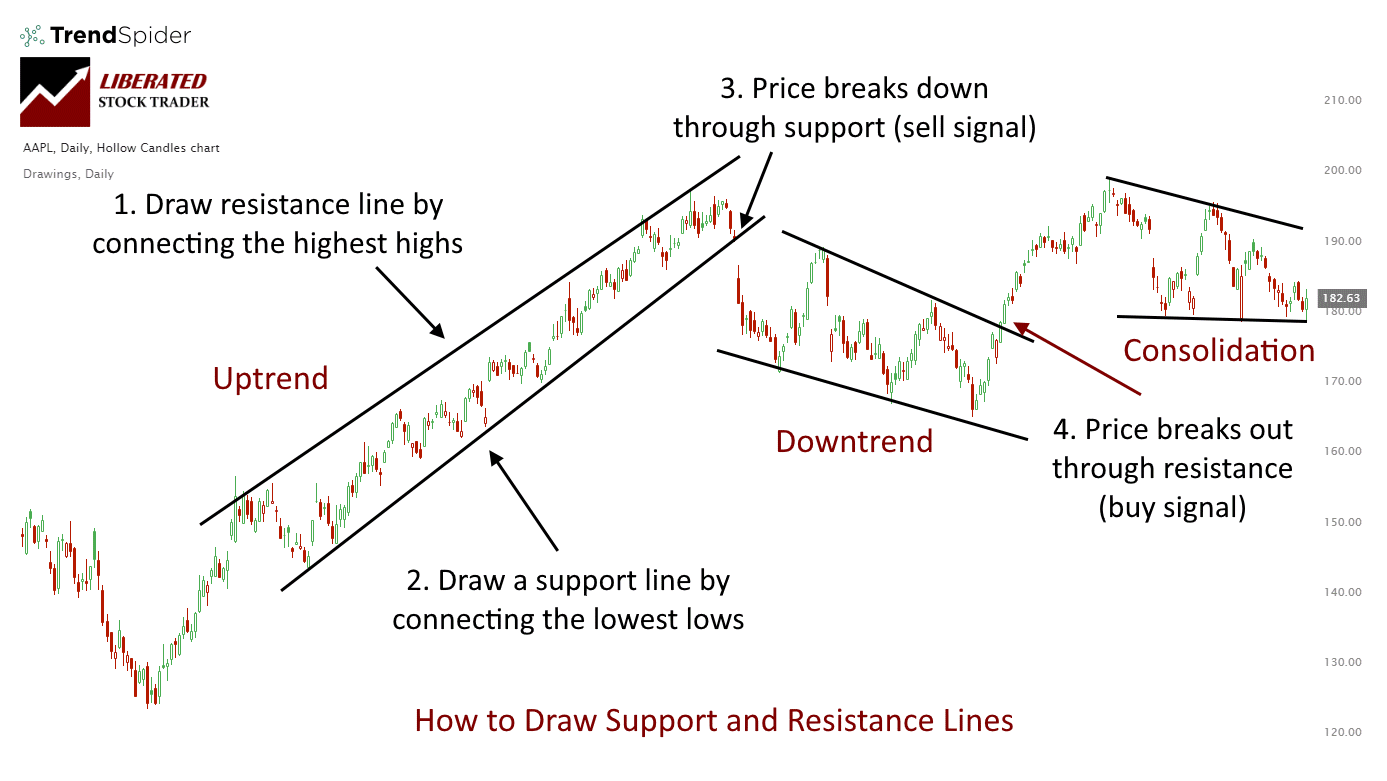
Identifying Trends and Trendlines
Traders pinpoint trends, such as an uptrend or downtrend, by analyzing price movements over time.
Higher highs and higher lows characterize uptrends, whereas downtrends exhibit lower highs and lower lows.
Trendlines are drawn, connecting these highs and lows to visualize the trend’s trajectory and strength. The reliability of these trendlines increases with the number of connecting points, providing a clearer forecast of potential market behavior.
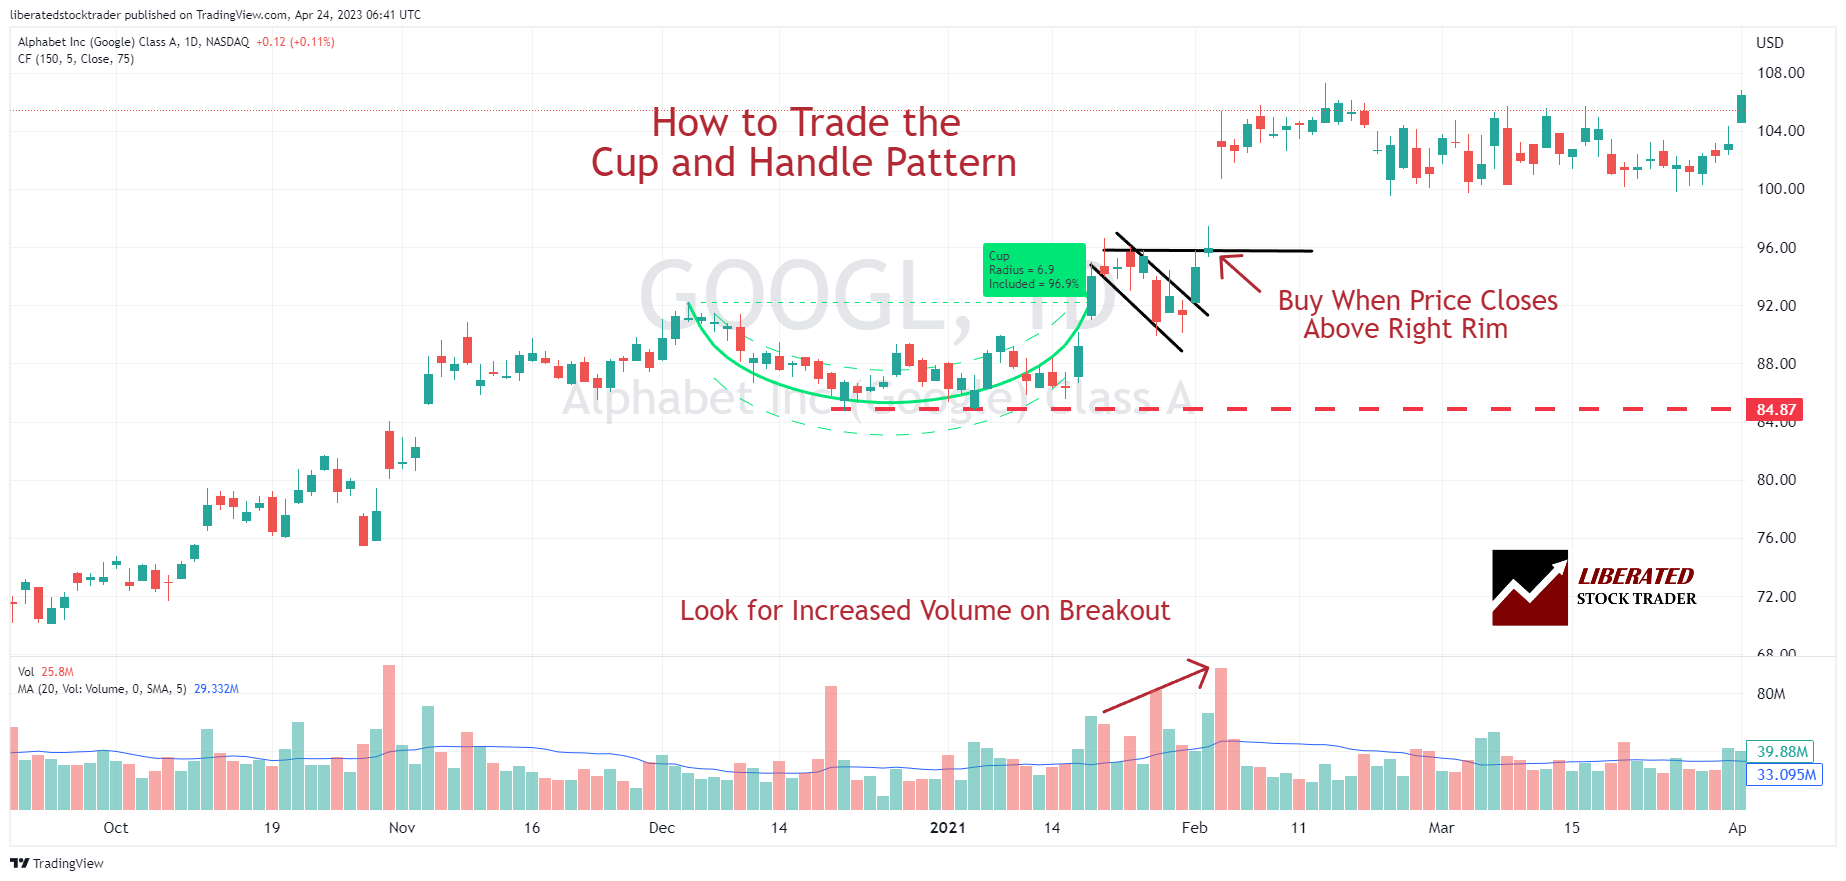
Continuation and Reversal Patterns
Recognizing continuation and reversal patterns is essential for forecasting market directions.
Continuation patterns, like flags or triangles, suggest that the market will persist in its current direction. On the other hand, reversal patterns, such as head and shoulders or double tops, signal that the market trend may change course.
▶️ Video: Reversal Patterns
Dow Theory Fundamentals
Dow Theory lays the groundwork for analyzing market trends. It asserts that market prices reflect all known information.
The theory is categorized into three movements: primary, secondary, and minor. Primary trends last a year or more and represent the broad market direction. Secondary trends are corrective movements within the primary trend, lasting three weeks to three months. Minor trends are short-term fluctuations.
▶️ Video: Dow Theory
Dow Theory posits that a trend continues until a clear reversal occurs, assisting analysts in distinguishing between normal market corrections and actual trend reversals.
Technical vs. Fundamental Analysis
Investors have two primary methods to evaluate potential investments: technical analysis and fundamental analysis. Both have distinct strategies and focus on different market aspects to predict future stock performances.
While technical analysis is often seen as contradictory to fundamental analysis, which focuses on a company’s financial health, most investors integrate both to inform their investment strategies.
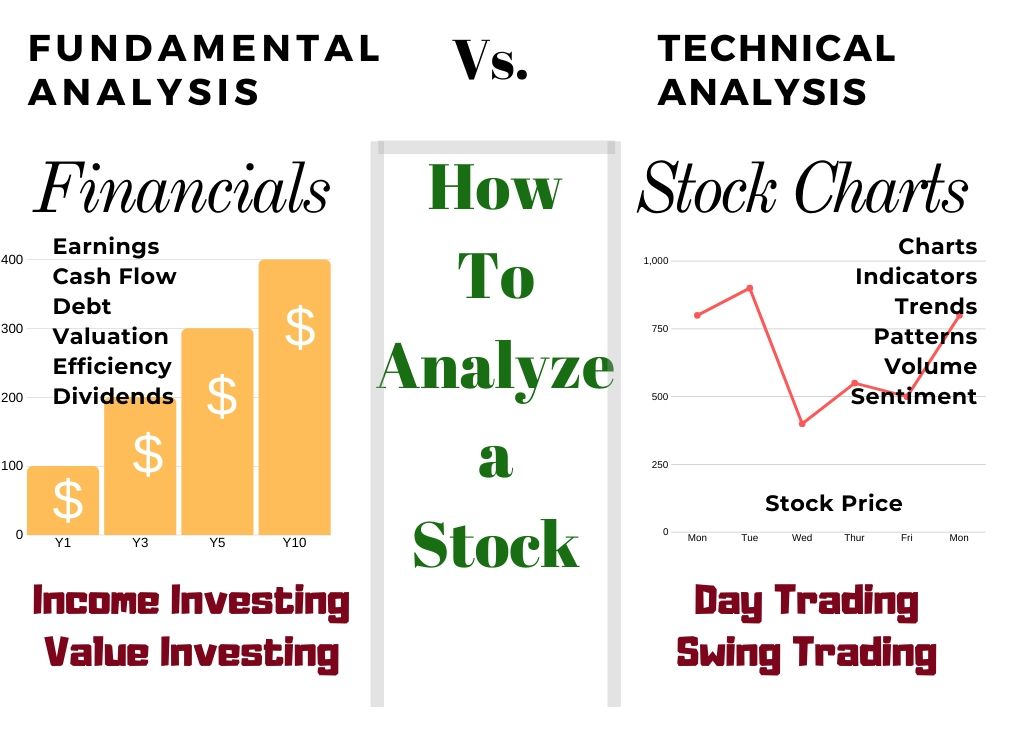
Technical analysis studies price data and volume to forecast future market behavior.
Analysts use charts and various tools to identify patterns and trends that suggest potential market movements. This methodology assumes that the stock price already reflects all known information. Therefore, it focuses on what the price is doing rather than what the company is doing.
Fundamental analysis, in contrast, examines the economy, earnings, management, and sales to determine a company’s intrinsic value.
It scrutinizes financial statements, industry conditions, competitor comparisons, and the economic landscape. Fundamental analysts believe that the stock market may not fully reflect a company’s true value, potentially leading to opportunities to buy undervalued stocks or sell overvalued ones.
Integrating Both Approaches
While some investors may favor one method over the other, integrating both approaches can offer a more rounded perspective on an investment.
For example, an investor could use fundamental analysis to select a company with strong earnings and solid management. Then, they could apply technical analysis to determine the optimal time to execute the trade based on price data trends.
This combined strategy aims to leverage the holistic view of fundamental analysis with the timing precision of technical analysis.
Trading Psychology and Market Sentiment
In the domain of technical analysis, understanding the collective mindset of market participants—trading psychology and market sentiment—is crucial. They influence trading decisions and are pivotal in the success of traders and investors.
Behavioral Finance Insights
Behavioral finance offers valuable insights into how psychological factors and biases affect the financial decisions of traders and investors. It underlines that market participants are not always rational, and cognitive biases and emotions can influence their decisions.
Sentiment Indicators: Fear & Greed
Sentiment indicators are tools used to gauge the mood of the market. Common sentiment indicators are the VIX Volatility, the NYSE Advance-Decline Ratio, and the AAII Sentiment Indicator. All of these are included in our live interactive Fear and Greed Index.
Contrarian approaches involve making trading decisions that go against prevailing market sentiment. For example, if the majority of investors are bullish, a contrarian might take this as a signal that it’s time to sell.
▶️ Video: Bullish Patterns & Sentiment
Bullish Sentiment Patterns: When traders expect upward price movement.
▶️ Video: Bearish Patterns & Sentiment
Bearish Sentiment: When traders anticipate a decline in prices.
Traders often use these indicators to inform their decisions. They look for signs of extreme sentiment, which may suggest potential market reversals.
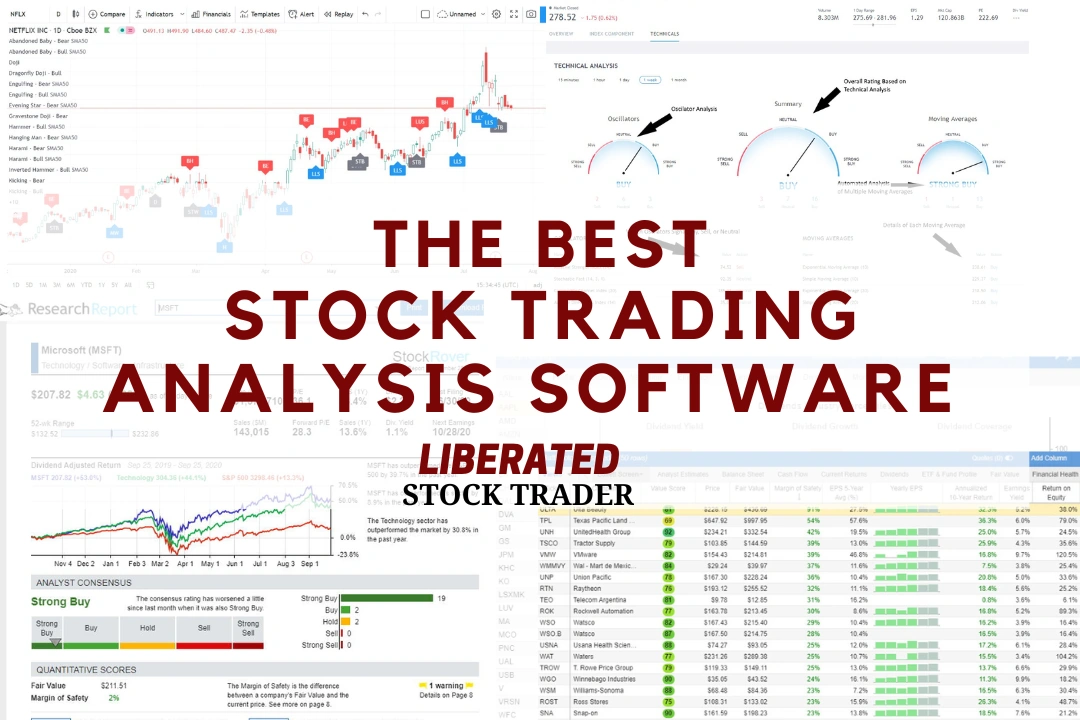
Technical Analysis Tools & Resources
Technical analysis is a methodology for forecasting the direction of prices through the study of complex market data. Fortunately, tools exist that radically simplify the task of analyzing stocks and indexes.
The best technical analysis tools allow you to create trading systems, backtest strategies, and automate trading using artificial intelligence and bots.
Trading Systems and Strategies
Trading systems are structured frameworks that use technical analysis to generate trading signals. These signals help traders identify potential trading opportunities by analyzing market trends and patterns.
TradingView 4.8/5⭐ : The Best Trading Platform I’ve Tested in 20+ Years
With lightning-fast charts, powerful pattern recognition, smart screening, backtesting, and a global community of 20+ million traders — it’s a powerful edge in today’s markets.
If you want one platform that gives you an edge, this is it.
Strategies within these systems are based on a set of rules that dictate when to enter or exit trades. They are often tailored to the risk management preferences of the individual or institution.
Backtesting & Strategy Development
Backtesting is an essential process where traders test their trading systems and strategies against historical data to assess their efficacy. By applying technical analysis to historical trading data, traders can identify how signals would have performed in the past. This helps understand potential risk and return profiles for various assets, including individual stocks and securities.
▶️ Video: Backtesting a Chart Indicator
Testing Performed with TrendSpider, Our Recommended Trading Tool
Automated Trading Bots
Automated trading bots are programs that execute trades on behalf of the trader using predefined trading systems and algorithms.
These bots analyze real-time market data, apply technical analysis to generate trading signals, and execute trades. They often include sophisticated risk management protocols to safeguard against market volatility.
AI in Stock Trading
Artificial intelligence (AI) has significantly impacted the stock trading industry. With advanced algorithms, AI can analyze large data sets and find patterns or trends humans may miss. This results in more accurate predictions and faster decision-making.
Some companies like TrendSpider even developed AI-powered trading bots that can autonomously trade stocks based on market data and historical performance.
Applying Analysis to Different Markets
Technical analysis is not confined to a specific market and can be applied to a range of asset classes.
Whether trading futures, commodities, currencies, or stocks, charting and pattern recognition principles are crucial in identifying potential trades and investment opportunities across these diverse markets.
FAQ
What is the best software for technical analysis of stocks, Forex, and crypto?
After completing thorough testing, we recommend TrendSpider because it can automate the development of backtested trading strategies. It can also auto-trade using bots and connect directly to your broker.
What is technical analysis?
Technical analysis is used to assess investments and spot trading opportunities by analyzing statistical trends in price movements and volume.
How do I start learning stock trading?
At Liberated Stock Trader, we have a range of professional training courses to help you kick-start your knowledge in stock trading. I highly recommend our Liberated Stock Trader Pro course.
How does technical analysis differ from fundamental analysis?
Technical analysis focuses on market patterns and price movements to predict future movements, whereas fundamental analysis looks at financial statements to determine a security's intrinsic value.
What are the four principles of technical analysis?
Technical analysis operates on four principles: the market discounts everything, prices move in trends, history tends to repeat itself, and patterns are identifiable and can be exploited for trading opportunities.
What are common indicators used in technical analysis?
Common indicators in technical analysis include moving averages, Bollinger Bands, relative strength index (RSI), and candlestick charts—these aid traders in identifying support and resistance levels, trends, and potential entry and exit points.
How can technical analysis be applied to trading strategies?
Technical analysis can be applied to trading strategies by providing signals through patterns and indicators. These signals help in the timing of trades. Traders develop systems around these to capitalize on expected price movements.
Can technical analysis be used for all types of securities?
Yes, technical analysis can be applied to any security with historical trading data. This includes stocks, bonds, commodities, and currencies, among others.
What does volume mean in technical analysis?
Volume refers to the number of shares or contracts traded during a given period. It is often used as an indicator of the strength or weakness of a market move, with higher volumes associated with more significant movements.
Is technical analysis better for short-term or long-term trading?
Technical analysis can be used for both short-term and long-term trading; it all depends on the chart's time frame. Short-term traders may look at minutes or hours, while long-term traders may look at days, weeks, or even years.
What is a trend in technical analysis?
A trend refers to the general direction in which a security or market moves. Trends can be upward, downward, or sideways and are a core concept in technical analysis.
Liberated Stock Trader Pro Training
Learn stock market investing with the complete online stock trading course by Barry D. Moore, a certified financial analyst from the International Federation of Technical Analysts (IFTA).
I am Barry D. Moore, a certified financial analyst and head of research at Liberated Stock Trader. Please let me introduce you to my Liberated Stock Trader Pro stock investing course.