After fully testing Seeking Alpha against our 2026 benchmarks, the results show it leads the pack for stock selection, quantitative analysis, research, ratings, and portfolio tools for medium- and long-term investors.
My hands-on lab test results suggest that combining Alpha Picks and Seeking Alpha Premium hits the sweet spot for serious investors. The stock selections and Quant rating are first-class. If you want curated stock recommendations, then Alpha Picks is the right choice.
Test Results & Ratings
After my independent testing, I rate Seeking Alpha 4.35. I confirm that its Alpha Picks service has an excellent track record, significantly outperforming the market since 2022. Additionally, the quant ratings and level of research included in Premium are truly impressive.
My subscription to Alpha Picks provides significant value, saving me a lot of time on research and stock selection. When combined with the Premium service, I can see next-level quant ratings and grades for all stocks.
| Test | Tier | Score | Average |
|---|---|---|---|
| Lab Test Composite Score | AA | 4.35 | 4.21 |
| Pricing Index | AAA | $2.19/day | $2.74/day |
| Value Score (VP) | B | 3.56 | 2.82 |
| Speed & Ease of Use | AAA | 5.00 | 4.50 |
| Chart Analysis Depth Index | B | 3.95 | 3.24 |
| Scanning Performance | C | 1.67 | 3.50 |
| Trading Bot & Auto-Trading Reliability | C | 1.50 | 2.00 |
| AI & Algo Index | B | 3.00 | 2.00 |
| Alert Speed | B | 3.33 | 4.25 |
| Trade Signal Quality | AAA | 5.00 | 0.00 |
| Broker Connectivity & Ecosystem Depth | C | 2.00 | 2.00 |
| Portfolio Tool Performance | AA | 4.30 | 2.80 |
| Financial News Speed & Depth | B | 1.50 | 2.30 |
| Community Utility Index (CUI) | A | 4.25 | 3.00 |
| Support Infrastructure & SLA Audit | B | 3.50 | 4.00 |
Tested using benchmarking system v3.
See the 2026 v3 58-point Seeking Alpha test and benchmarks.
Pros
✔ Alpha Picks outperformed the S&P 500 by 3X since 2022.
✔ Powerful Quant Ratings & Grading systems.
✔ Alpha Picks & Premium bundle is $639 or $53/m, representing good value for money.
✔ Transparent audit of stock-picking performance.
✔ Incredible depth of research.
✔ A large, vibrant, and intelligent community.
✔ Follow top analysts.
Cons
✘ Pro service is expensive for retail investors.
✘ No Fair Value & DCF metrics for value investors.
✘ Investing groups are pricey.

Alpha Picks really stood out. My test real-world benchmarking showed 3-year annual returns of +88%, compared with +26% for the S&P 500. These momentum-based picks outperformed most Wall Street ratings.
Composite Lab Score
Seeking Alpha scores AA 4.35, above the median. That tells you it’s broadly competitive across the full stack of criteria, plus it has two superpowers: Apha Picks stock selection and the Quant Analysis engine in Premium.
The practical takeaway: it’s a “research-and-decision” tool first, not an “execution-and-automation” tool.
| Metric | Calculation | Seeking Alpha | High | Median | Low |
|---|---|---|---|---|---|
| Composite Lab Performance Score (CLPS) | Average for all ratings + 5X Superpower boost for Top 5 killer features | 4.35 | 4.75 | 4.21 | 2.90 |
| Composite Lab Performance Score (CLPS) Overall Test Winners | TradingView 4.75 | TrendSpider 4.72 | Trade Ideas 4.52 |
A median composite score is meaningful here: Seeking Alpha derives it from signal quality, community, and research depth, not from bots/backtesting.
Key Takeaways
- Seeking Alpha Premium’s Quant ratings and stock grading system are excellent.
- Alpha Picks has outperformed the S&P 500 since launch.
- Stock charting is powerful, with over 160 indicators and drawing tools.
- I rate the Premium & Alpha picks bundle as one of the best stock selection services I have ever reviewed, with a 5.00 rating.
- Seeking Alpha has one major competitor – Motley Fool – Find out more: Seeking Alpha vs. Motley Fool Test: Winner Revealed.
Features
| ⚡ Seeking Alpha Features ? | Charting, Pre-built Screeners, Live Webinars, Community |
| 🏆 Unique Features ? | Alpha Picks Winning Track Record, Quant Ratings, Top Analysts with Audited Performance |
| 🎯 Best for | Stock & ETF Investors |
| ♲ Subscription | Yearly |
| 💰 Price | $24 | $41/m |
| 💻 OS | Web Browser |
| 🎮 Trial | 7 Day Premium Trial |
| ✂ Discount | -21% Alpha Picks & Premium Bundle |
| 🌎 Region | USA |


My Verdict
Alpha Picks currently has 44 active recommendations, 38 are winners with an average gain of 121%, and there are also 6 losers with an average loss of 15%. That’s an impressive track record, though it’s only been three years so far.
Premium’s Quant Ratings are really unique and powerful, which is why I would recommend bundling Premium with Alpha Picks. The charting and screening tools are good, but competitors such as TrendSpider and TradingView offer superior solutions for technical traders.
The Seeking Alpha bundle deal is compelling at $639 for Premium plus Alpha Picks. If you’re serious about investing and want both research muscle and curated picks, this combo’s hard to beat.
Pro digs deeper with investment research, though honestly, I didn’t feel like I needed all that as an individual investor.
I appreciate that you can follow Seeking Alpha’s top analysts, who each have an audited track record and provide professional analysis and research. I tracked their calls and, yeah, they lined up with real stock performance more often than not.
Is Seeking Alpha Premium Worth It?
Yes, I believe Seeking Alpha Premium is a great value for money for the level of research and Quant Ratings you get. I have combined Premium and Alpha Picks because I want to open options contracts on its stock selections and sprinkle those recommendations into my long-term portfolio.
Pricing Index
Pricing Index is not a 0–5 rating anymore—it’s dollars. Seeking Alpha’s $2.19/day (for Alpha Picks & Premium Bundle) is cheaper than the median $2.74/day, and the sub-metrics show why: the effective monthly cost isn’t extreme, and the price-per-feature is solid.
| Metric | Calculation | Seeking Alpha | High | Median | Low |
|---|---|---|---|---|---|
| Cost-per-day | $/day on an annual plan. Minimum viable plan with real-time exchange data | $2.19/day | $9.99/day | $2.74/day | $0.74/day |
| $ per feature | Effective Monthly Cost /Total Features | $6.64 | $23.37 | $6.64 | $1.94 |
| Effective Monthly Cost (EMC) | EMC = (Plan price + required real-time data fees + any required add-ons) / month | $40.00/mo | $303.87/mo | $83.32/mo | $22.50/mo |
The key here is fit: you’re paying for quantitative research depth and high-performance idea flow, not pro-grade execution tooling.
| Product | My Rating | Best Feature | Best For | Price |
|---|---|---|---|---|
| Alpha Picks | 4.8 ★ | Quantitative stock picks | Passive investors | $449/y |
| Premium | 4.6 ★ | Quant ratings access | Active researchers | $269/y |
| Pro | 4.2 ★ | Analyst coverage | Professional traders | $2400/y |
| Alpha Picks & Premium Bundle | 4.7 ★ | Picks & Quant Ratings | Retail Investors | $639/y 21% Discount |
Seeking Alpha breaks pricing into three tiers, so you can pick what fits your style and budget. Here’s how it shakes out right now:
- Seeking Alpha Premium is the entry-level paid plan at $299 per year—though right now it’s $269 with a $30 discount.
- Alpha Picks is $499 annually, but there’s a $449 first-year promo (so, $50 off).
- Seeking Alpha PRO is the top tier at $2,400 a year, with a $99 first-month trial if you want to test the waters.
- If you bundle Premium and Alpha Picks, it’s $639 for the first year—that’s $159 off the regular combined price.
Value Score (VP)
Seeking Alpha’s Value Score is 3.56, above the median 2.82. That typically happens when a tool delivers high perceived utility per dollar, and the scores indicate it is good value for money.
| Metric | Calculation | Seeking Alpha | High | Median | Low |
|---|---|---|---|---|---|
| Value Score (VP) | 30% Off/Best Plan Cost. Compared to the total features and ranking | 3.56 | 4.37 | 2.82 | 2.06 |
| Value Rank | Effective Monthly Cost /Total Features Percentile Ranking | 2.00 | 5.00 | 2.00 | 1.00 |
| Feature Quality | Tool Rating | 3.70 | 4.19 | 3.14 | 2.00 |
| Feature Breadth | Total # of core features | 12.00 | 17.00 | 12.00 | 8.00 |
| Feature Depth | Total # of Premium Features | 3.75 | 4.38 | 3.00 | 2.00 |
| Device Support Depth | Count of Devices supported (Web, PC, Mac, IOS, Android). 1 Point Each | 3.00 | 5.00 | 3.00 | 0.00 |
| Value Score Test Winners | TradingView 4.37 | TrendSpider 4.20 | Trade Ideas 4.05 |
Value Score is the “will I actually use what I’m paying for?” test. Seeking Alpha scores well because it’s not trying to be everything; it concentrates value into research, ratings, and idea discovery, things many investors use weekly.
Trade Signal Quality
This is Seeking Alpha’s headline win: AAA 5.00, far above the median 0.00. In this framework, that means audited, structured signals/picks that go beyond generic “buy/sell” widgets.
Alpha Picks are high-conviction, market-outperforming stocks backed by the Quant team.
| Metric | Calculation | Seeking Alpha | High | Median | Low |
|---|---|---|---|---|---|
| Signal Alpha & Predictive Efficacy | Audited trade signals and performance over time. | 5.00 | 5.00 | 0.00 | 0.00 |
| Trade Signal Quality Test Winners | Trade Ideas 5.00 | Seeking Alpha 5.00 | Tickeron 5.00 | Motley Fool 5.00 |
This is the category that justifies paying for Seeking Alpha—if you actually use the signals/picks in your process.
That makes it especially valuable for investors who want a disciplined funnel: shortlist candidates, pressure-test the thesis, and act with higher confidence. If you want rapid-fire intraday signals, this isn’t that; it’s higher-level decision support.
Alpha Picks
Alpha Picks AAA 5.00 is Seeking Alpha’s premium stock recommendation service, designed to deliver high-conviction, long-term investment ideas backed by the platform’s proven Quant Ratings and fundamental analysis.
If you want specific stock recommendations and buy and sell signals, then Alpha Picks is for you.
Each month, subscribers receive two curated stock picks that score highly on value, growth, and profitability metrics—typically companies with strong earnings momentum and solid financial health. The service aims to outperform the S&P 500 by focusing on fundamentally sound businesses rather than short-term trades.
Each recommendation comes with a detailed research report explaining the investment thesis, key risks, and performance updates, making Alpha Picks an appealing option for investors seeking data-backed, transparent, and disciplined stock selection without the noise of daily market speculation.
Seeking Alpha’s Quant Team is the engine behind the platform’s data-driven investment tools, responsible for developing the Quant Ratings, Factor Grades, and algorithmic models that power much of its analysis. This team of financial engineers and quantitative analysts combines fundamental data, earnings trends, and market performance metrics to create objective, real-time evaluations of thousands of stocks.
Their systematic approach ensures that every rating and grade is grounded in measurable financial evidence rather than opinion. By continuously refining their models and integrating new data sources, the Quant Team helps Seeking Alpha maintain its edge as a quantitative research platform, giving investors access to institutional-level analytics in an accessible, retail-friendly format.
Alpha Picks Track Record
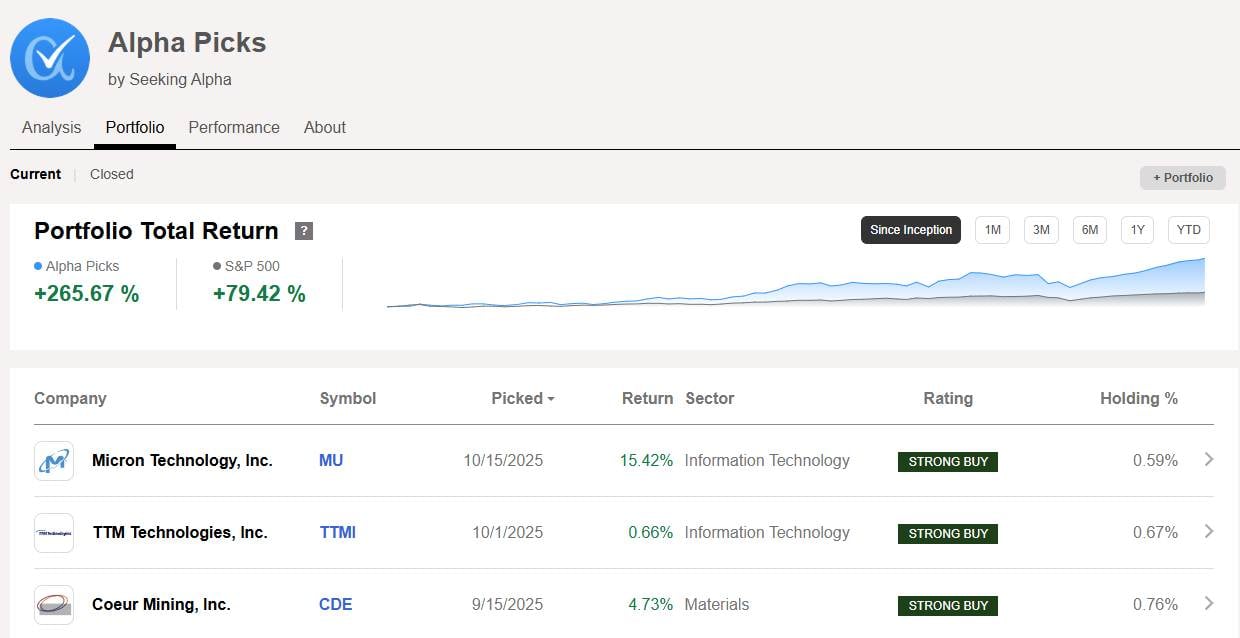
Alpha Picks has delivered impressive results since launching in July 2022. Their reported portfolio return sits at +265%, while the S&P 500 returned +79% in the same period.
The Alpha Picks portfolio showcases some remarkable success stories, particularly in the technology and industrial sectors. Standout performers like AppLovin (APP) with an astounding 1,376% return and Celestica (CLS) with 1,095% and 302% gains highlight the system’s ability to identify high-growth stocks early.
Other top performers include Powell Industries (POWL) at 603%, Sterling Infrastructure (STRL) at 508%, and Uber (UBER) up 154%, reflecting the strength of Seeking Alpha’s quant-driven selection process across multiple industries.
Many of these winners also maintain Strong Buy or Hold ratings, showing consistent confidence from both the Quant model and analyst community.
Some Alpha Picks Examples:
| Stock | Return | Date |
|---|---|---|
| AppLovin (APP) | +1,376% | 11/15/2023 |
| Celestica (CLS) | +1,095% | 10/16/2023 |
| Powell Indistries (POWL) | +603% | 5/15/2023 |
| Q2 Holdings | -41% | 12/2/2024 |
However, the results also demonstrate that not all picks outperform, underlining the inherent volatility and risk of stock selection. While the portfolio’s weighted exposure leans toward technology and industrials, a few consumer and financial names—such as PayPal (PYPL) at −18.6% and Q2 Holdings (QTWO) at −41.6%—have lagged. This mix of extraordinary winners and modest underperformers reflects a balanced yet high-risk, high-reward approach, where the top selections more than offset weaker picks.
Overall, the data suggests that Alpha Picks can deliver exceptional returns, particularly for long-term investors who diversify and stay disciplined through market swings. The service is pretty new—just about 2.5 years old—so it hasn’t really faced every type of market yet.
All the success rate numbers come straight from Seeking Alpha’s own reported performance through 2025.
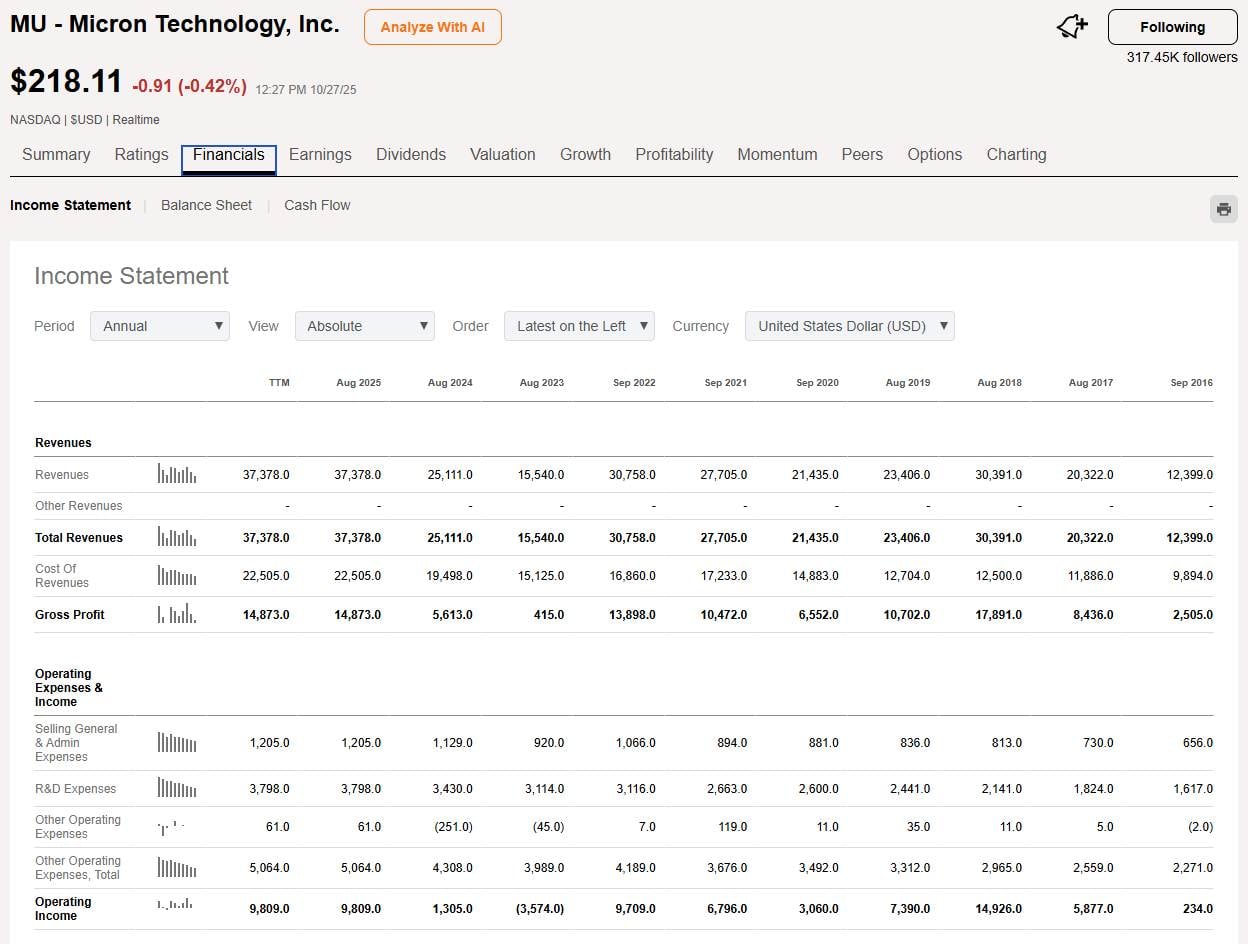
Premium Quant Ratings & Factor Grades
Seeking Alpha Premium AAA 5.00 gives you a full suite of stock research tools that really change the way you analyze investments. It’s $239 for your first year and $299 after that.
Seeking Alpha’s Quant Ratings system is a data-driven approach that simplifies stock selection by scoring equities across five critical factors: Valuation, Growth, Profitability, Momentum, and EPS Revisions.
Each stock receives a grade from A+ to F in each category, based on how it compares statistically to peers in the same sector. These factor grades are then weighted and combined into an overall Quant Rating, which classifies a stock as Strong Buy, Buy, Hold, Sell, or Strong Sell. The system is updated daily, ensuring that changes in earnings estimates, price movements, and financial performance are reflected in near real time—making it a dynamic screening and ranking tool for both short- and long-term investors.
Seeking Alpha claims its Quant Ratings beat the market, and I do not doubt it. With over 10 years of backtesting, their ‘Strong Buy’-rated stocks have consistently outperformed the S&P 500 by a significant margin. Backtesting is never 100% guaranteed, so I would like to see the audited track record of all ratings over the last decade.
Below you can see its Factor Grades that rate each stock on a scale from A+ to F for value, growth, profitability, and momentum. This level of granularity is impressive and well thought out.

What sets Seeking Alpha’s Quant Ratings apart is their objectivity and transparency. Unlike traditional analyst ratings, which can be influenced by sentiment or qualitative bias, the Quant model is entirely algorithmic and grounded in measurable financial data. For investors looking to uncover outperforming stocks or avoid overvalued traps, these grades offer a clear, comparative edge.
Seeking Alpha Pro Research
Seeking Alpha Pro gives you everything in Premium, plus exclusive analyst content for serious investors. Pro adds institutional-quality research and off-the-radar investment ideas to the Premium base. It’s for people who want access to information you won’t find just anywhere.
Exclusive Pro Features:
- Short-selling research and analysis
- Exclusive analyst investment ideas
- Notable calls from hedge fund managers
- Advanced institutional data access
- Priority customer support
The short-selling research is what really sets Pro apart. You’ll get analysis on overvalued companies, which is a nice counterbalance to the usual buy-side focus.
Pro members see curated investment ideas from Seeking Alpha’s best analysts, and these often spotlight smaller names the big shops miss. The Notable Calls feature shows what hedge fund managers and Wall Street pros are moving on. It’s a peek into what the big money’s thinking.
It’s their most comprehensive plan, but it comes with a hefty $2,400 annual price tag.
Speed & Ease of Use
Seeking Alpha scores AAA 5.00, beating the median 4.50. That’s a “low friction” score: fast time-to-chart, low multimonitor latency, and minimal click depth. This is one of Seeking Alpha’s most visible wins: you feel the speed every day.
| Metric | Calculation | Seeking Alpha | High | Median | Low |
|---|---|---|---|---|---|
| Speed & Use Index Rating | Average of Time to Chart Performance, Multimonitor Chart Speed & 3 Click | 5.00 | 5.00 | 4.50 | 3.25 |
| Time to Chart Speed (Seconds) | Seconds from clicking the icon to a fully loaded chart with 200 price bars & 2 indicators. | 1.93 | 17.03 | 4.70 | 1.55 |
| Time to Chart Performance | Speed to Chart Points | 5.00 | 5.00 | 4.50 | 3.00 |
| Multi-Chart Latency | milliseconds | 198 | 667.00 | 209.00 | 10.00 |
| Multimonitor Chart Speed | Multi-Chart Sync Points | 5.00 | 5.00 | 4.00 | 2.00 |
| 3-Click Rule Test | Number of Clicks to place a trade or launch a scan | 2 | 6.00 | 3.00 | 2.00 |
| 3 Click Rule: Ease of Use | 5 Click Points. Each click > 3 = 1 minus point | 5.00 | 5.00 | 5.00 | 2.00 |
| Speed & Ease of Use Test Winners | TradingView 5.00 | Stock Rover 5.00 | Seeking Alpha 5.00 |
Speed & ease isn’t about “cool features”—it’s about whether you keep using the tool after the honeymoon. Seeking Alpha’s score reflects a simple workflow: get to the chart quickly, scan key info, and move on.
Chart Analysis Depth Index
Seeking Alpha’s chart depth score is 3.95, comfortably above the median 3.24. It’s not trying to beat a charting-native platform, but it does offer meaningful technical analysis depth for a research-first product.
| Metric | Calculation | Seeking Alpha | High | Median | Low |
|---|---|---|---|---|---|
| Chart Analysis Depth | Total avg chart types, indicator counts, and custom indicators. | 3.95 | 5.00 | 3.24 | 2.01 |
| Chart Types | Total Count of Chart Types Available | 21.00 | 38.00 | 10.00 | 1.00 |
| Indicators | Total Count of Built-In Indicators | 160.00 | 400.00 | 100.00 | 40.00 |
| Custom Code Indicators | Exists 5 points | 0.00 | 5.00 | 0.00 | 0.00 |
| Chart Pattern Recognition & Accuracy Test Winners | TrendSpider 4.88 | Trade Ideas 4.62 | TradingView 3.98 |
The “depth” is real, but the ceiling is clear: no custom scripting means you’re limited to built-ins.
Advanced Charts
Seeking Alpha’s Advanced Charts offer a surprisingly comprehensive set of tools for serious technical analysis, featuring over 130 indicators, overlays, and drawing tools.
The charting interface supports all major chart types—including Renko, Point & Figure, and Heiken Ashi—giving traders the flexibility to analyze price action from multiple perspectives. Users can customize timeframes, apply multi-indicator setups, and annotate directly on charts, making it a versatile tool for identifying trends, breakouts, and reversal patterns.
While Seeking Alpha is primarily known for its fundamental insights, the advanced charting suite bridges the gap by delivering professional-grade technical functionality within the same research environment.
I love the stock comparison tool. You can line up six companies side-by-side, see all the ratings at once, and spot differences fast. Premium also works nicely for portfolio monitoring. I get alerts when new analysis drops for my holdings and breaking news notifications, too.
Scanning Performance
Seeking Alpha scores 1.68, well below the median 3.50. This may seem like a poor rating, but the scanner in Premium is actually very good if you want to screen for Seeking Alpha Quant metrics.
It has a solid 84 scannable metrics, and a lightning-fast 135 milliseconds to scan the S&P 500.
| Metric | Calculation | Seeking Alpha | High | Median | Low |
|---|---|---|---|---|---|
| Scanning Performance Points | Total avg: Scanner performance points, criteria points, custom code points | 1.68 | 5.00 | 3.50 | 2.00 |
| Scanner Performance (ms) | Milliseconds to search the entire S&P 500 across 5 different criteria. | 168.00 | 100.00 | 156.00 | 500.00 |
| Scanning Speed Points | Rating | 4.00 | 5.00 | 60.00 | 0.00 |
| Scanning Criteria & Depth | Total Criteria Count | 84.00 | 450.00 | 80.00 | 18.00 |
| Scanning Criteria & Depth Points | Scanning Criteria 0.0125 points per criterion | 1.04 | 5.00 | 1.00 | 0.23 |
| Custom Code Scanning | Exists 5 Points | 0.00 | 5.00 | 0.00 | 0.00 |
| Scanning Performance Test Winners | Stock Rover 5.00 | TradingView 4.83 | TrendSpider 4.67 |
In practice, it means the platform isn’t optimized for multi-criteria market-wide scanning the way dedicated screeners are. This is the “don’t force it” category: Seeking Alpha is not the tool you use to grind thousands of technical scan variations.
Seeking Alpha’s stock screener integrates smoothly with its Quant Ratings, Factor Grades, and author analysis, making it a convenient research tool for investors focused on fundamentals. It allows users to filter stocks by key metrics such as valuation ratios, dividend yield, sector, and market cap—providing a quick, data-driven snapshot of market opportunities. For those already using Seeking Alpha’s ecosystem, the screener offers a cohesive way to connect quantitative insights with community-driven analysis.

However, the screener’s functionality is limited compared to more advanced platforms like Finviz, Stock Rover, or TradingView. It lacks deeper features such as multi-factor backtesting, technical indicators, and custom formula filters, which restrict its usefulness for active traders and data-heavy investors. While solid for basic fundamental screening, it falls short for those seeking granular control or advanced strategy testing.

Portfolio Tool Performance
Seeking Alpha lands a AA 4.30 above the median. It’s competent for portfolio tracking and monitoring, alerting, and innovative health checking. The portfolio layer is “useful,” not “elite.” It supports monitoring decisions more than engineering them.
| Metric | Calculation | Seeking Alpha | High | Median | Low |
|---|---|---|---|---|---|
| Portfolio Health & Risk Analysis | Total Avg: Portfolio Metrics Coverage and Feature Depth | 4.30 | 4.80 | 2.80 | 2.00 |
| Portfolio Tool Performance Test Winners | Stock Rover 4.80 | Portfolio 123 4.80 | Seeking Alpha 4.30 |
This category is about staying honest: understanding concentration, income exposure, and portfolio health without turning your process into a spreadsheet job. If you want correlation matrices, factor exposures, Monte Carlo, and rebalancing automation, pair with a portfolio-native tool. If you want “keep me aware and informed,” Seeking Alpha works well.
With Seeking Alpha’s portfolio management tools, I can do far more than just track my holdings—I can actually understand their performance and risk profile. The feature I find most useful is the Portfolio Health Score, which grades my portfolio across valuation, growth, profitability, and momentum using the same quantitative model behind Seeking Alpha’s Quant Ratings.
It gives me a clear, data-driven snapshot of how strong or vulnerable my investments are compared to the broader market. Combined with personalized news, earnings alerts, and real-time updates, the portfolio dashboard helps me spot weaknesses, uncover new opportunities, and keep my portfolio balanced all in one place.
Financial News Speed & Depth
Seeking Alpha scores 3.50, above the median 2.30 for speed. This is a “news terminal vs analysis platform” distinction: you get depth and commentary, but not wire-speed delivery. However the depth of the news covered, through its own editors, and in the form of trending topics, rates it AA 4.50.
| Metric | Calculation | Seeking Alpha | High | Median | Low |
|---|---|---|---|---|---|
| Financial News Speed | Total avg: News Speed and Depth | 3.50 | 4.25 | 2.30 | 1.50 |
| Depth of News | Total sources, journalists, and analysis reports. 0-5 points based on percentile ranking. | 4.50 | 4.50 | 3.50 | 2.00 |
| Financial News Speed & Depth Test Winners | MetaStock 5.00 | Benzinga Pro 5.00 | Scanz 5.00 |
News speed only matters if you trade the first move. Most investors don’t—and they shouldn’t pretend they do. Seeking Alpha’s profile fits the second phase: understanding what matters, what’s noise, and what changes fundamentals. The real edge is depth: analysis that helps you decide whether a headline changes your thesis or is just volatility bait.
Seeking Alpha pushes out news updates to everyone, no matter your subscription. Their news feed is quick, but not real-time, and covers earnings, market moves, sector headlines, you name it.
They pull news from all over and put it on one dashboard. That alone saves me a lot of time compared to bouncing between different finance sites.

Premium and Pro members get extra perks, like personalized news feed alerts tied to your portfolio and watchlists, and sent via email. They also send out newsletters with top stories and analysis, either daily or weekly, depending on your subscription.
Because the platform links news to my portfolio, I automatically receive updates on my holdings. That’s way more relevant than generic headlines.
AI & Algo Index
Seeking Alpha scores 3.00, above the median 2.00. The nuance: it earns this via algorithmic depth + transparency, not an “AI layer.” It’s systematic in its quant ratings frameworks, but not AI-native.
| Metric | Calculation | Seeking Alpha | High | Median | Low |
|---|---|---|---|---|---|
| Algorithmic Intelligence & AI Tier Index | Sum of Algo Depth, AI Layer & Transparency Points | 3.00 | 5.00 | 2.00 | 1.00 |
| Algo Depth | Algo Depth | 2.00 | 2.00 | 1.50 | 1.00 |
| AI Layer | AI Layer | 0.00 | 2.00 | 0.00 | 0.00 |
| Transparency | Transparency | 1.00 | 1.00 | 1.00 | 0.00 |
| AI & Algo Index Test Winners | TrendSpider 5.00 | Trade Ideas 4.50 | Tickeron 4.50 |
In Context: AI & Algo scores only matter if they change decisions. Seeking Alpha’s advantage is systematic evaluation: you’re not relying solely on vibes, headlines, or a single analyst’s conviction.
Alert Speed
Seeking Alpha scores 3.33, below the median 4.25. That’s typical: it’s not trying to be an ultra-low-latency market alerting engine. The value is relevance and analysis, not millisecond speed. Don’t interpret this as “bad alerts”—interpret it as “not an alert-first platform.”
| Metric | Calculation | Seeking Alpha | High | Median | Low |
|---|---|---|---|---|---|
| Alert Speed | Total avg: Concurrent Alerts, Alert Stream Richness, and Alert Speed. | 3.33 | 5.00 | 4.25 | 3.25 |
| Concurrent Alerts | How many concurrent alerts (1 point per 50, to a max of 5 points) | 2.00 | 5.00 | 2.00 | 0.00 |
| Concurrent Alert Count | How many alerts can you set? | 20.00 | 2000.00 | 100.00 | 10.00 |
| Alert Streams | 1 point per stream. Email, Webhook, SMS, and App alert. Multifactor/multi-condition alerts. | 3.00 | 5.00 | 4.00 | 2.00 |
| Alert Speed Rating | 0-5 points based on latency and speed | 5.00 | 5.00 | 3.50 | 2.00 |
| Alert latency (ms) | Fast alerts under 50ms. Average alert latency. | 300.00 | 60.00 | 275.00 | 300.00 |
| Alert Speed Test Winners | TradingView 4.67 | TrendSpider 4.33 | Benzinga Pro 4.33 |
The best use is portfolio and thesis monitoring—news, rating changes, and research updates that affect conviction—not microsecond entries. If you want market-structure alerts, pair it with a real-time alert platform and let Seeking Alpha handle the why behind the move.
Broker Connectivity & Ecosystem Depth
Seeking Alpha scores 2.00, right on the median. That may look surprising, but it reflects ecosystem utility (coverage + integration posture) rather than “click-to-execute trading.”
| Metric | Calculation | Seeking Alpha | High | Median | Low |
|---|---|---|---|---|---|
| Broker Integration Performance & Depth | Total avg: Broker Count and Asset Coverage | 2.00 | 5.00 | 2.00 | 1.00 |
| Broker Integration | Total number of brokers integrated for direct, live trade execution. | 0.00 | 30.00 | 5.00 | 0.00 |
| Asset Coverage | Stocks, Options, FX, USA Exchanges, International Exchanges. 1 Point Each | 4.00 | 5.00 | 5.00 | 1.00 |
| Total number of brokers integrated | Total count | 0.00 | 1200.00 | 5.00 | 0.00 |
| Broker Connectivity & Ecosystem Test Winners | TradingView 5.00 | MetaTrader 5.00 | TrendSpider 4.43 |
Practically: Seeking Alpha is not where you execute. It’s where you decide.
In Context: Broker connectivity matters when your tool is the cockpit. Seeking Alpha is more like the intelligence desk: research, ratings, and decision support you can carry into your broker.
Community Utility Index (CUI)
Seeking Alpha scores A 4.25, well above the median 3.00. This category concerns whether the community improves decision-making (quality, responsiveness, and structure), not raw social engagement.
This is a real differentiator if you benefit from counter-arguments and diverse theses.
| Metric | Calculation | Seeking Alpha | High | Median | Low |
|---|---|---|---|---|---|
| Community Utility Index (CUI) | Total Avg: Activity and Value | 4.25 | 4.25 | 3.00 | 1.00 |
| Community Activity | Total Active users, avg posts, avg response times. 0-5 points based on percentile ranking. | 4.00 | 5.00 | 2.00 | 1.00 |
| Value of Community | Expertise, moderation, and signal-to-noise. 0-5 points based on percentile ranking. | 4.50 | 4.50 | 4.00 | 2.00 |
| Community Utility Index Test Winners | TradingView 5.00 | MetaTrader 5.00 | Trade Ideas 4.75 |
In Context: Community value shows up when it saves you from bad decisions. Seeking Alpha’s strength is not just volume, it’s that you can often find a smart opposing thesis quickly, plus detailed debate on valuation, catalysts, and risk.
Follow Top Analysts
Seeking Alpha’s “Follow Top Analysts” feature empowers investors to tap into the insights of the platform’s highest-performing contributors and Wall Street professionals. Each analyst is ranked based on their track record of stock performance, accuracy of ratings, and consistency over time, allowing users to identify and follow those with proven results. By subscribing to top analysts, investors receive real-time alerts on new stock ideas, upgrades, or downgrades—helping them stay ahead of market moves.

This feature transforms Seeking Alpha into a social investing hub, blending crowd wisdom with verified expertise, and giving users the ability to learn from and act on the strategies of consistently successful market voices.
Support Infrastructure & SLA Audit
Seeking Alpha scores 3.50, just under the median of 4.00. The channel access is solid, but the “time-to-human” expectation falls short of the benchmark’s “instant chat in under 2 minutes” standard.
| Metric | Calculation | Seeking Alpha | High | Median | Low |
|---|---|---|---|---|---|
| Support SLA Audit: Time-to-Human Benchmarks | Average of Support Communication Channels & Support Response Time Scores | 3.50 | 5.00 | 4.00 | 3.00 |
| Support Communication Channels | Communication Channels (The “Access” Scale) | 4.00 | 5.00 | 4.00 | 2.00 |
| Support Response Times | Response Times (The “SLA” Scale) | 3.00 | 5.00 | 4.00 | 3.00 |
| Stated SLA & Tested Outcomes | — | ~24 Hours | < 5 Minutes | < 5 Minutes | < 24 Hours |
| Support Infrastructure & SLA Audit Winners | TrendSpider 5.00 | TC2000 5.00 | ThinkorSwim 4.75 |
Support isn’t “bad”—it’s just not built like a trading terminal’s live ops desk.
Compared To Similar Products
Seeking Alpha goes head-to-head with platforms like Motley Fool’s Stock Advisor, TradingView, Trade Ideas, and Stock Rover. The most similar service is Motley Fool’s Stock Advisor, which has a similar performance track record and has been running since 2002. I rate Seeking Alpha’s research and quant ratings as superior to Motley Fool’s.
Trade Ideas also provides specific stock picks and buy-and-sell signals, but they are primarily for day traders and are based on technical analysis. Stock Rover provides deep automated research and stock ratings, but no specific stock picks. Finally, TradingView has buy and sell gauges (based on technicals) for all stocks, but no stock selection service.
| Features? | Seeking Alpha | Trade Ideas | Stock Rover | Motley Fool | TradingView |
|---|---|---|---|---|---|
| Best for: | Investors | Traders | Investors | Investors | Traders |
| Stock Picks & Signals | ✔ | ✔ | ✘ | ✔ | ✘ |
| Buy & Sell Signals | ✔ | ✔ | ✘ | ✔ | ✔ |
| Large Community | ✔ | ✘ | ✘ | ✘ | ✔ |
| Financial Screening? | ✔ | ✘ | ✔ | ✔ | ✔ |
| 10-Year Financials | ✔ | ✘ | ✔ | ✘ | ✘ |
| Portfolio Management? | ✔ | ✘ | ✔ | ✘ | ✘ |
| Research Reports | ✔ | ✘ | ✔ | ✘ | ✘ |
| Chart Pattern Recognition? | ✘ | ✔ | ✘ | ✘ | ✔ |
| Financial News? | ✔ | ✔ | ✔ | ✔ | ✔ |
| Region | USA | USA | USA | USA | Global |
I’ll admit, Motley Fool does a great job for beginners. Their style is friendly and easy to follow. But if you want deeper analysis or institutional-grade research, Seeking Alpha’s got the edge.
Yahoo Finance is fine for basic data and headlines, but it just doesn’t go as deep as Seeking Alpha Premium. The Quant ratings and crowdsourced research on Premium give you way more actionable info, at least in my experience.
The comments and author interactions on Seeking Alpha feel more like a professional community.
Premium’s mobile app also offers better portfolio tracking and alert options than Yahoo’s.
Final Thoughts
I think Seeking Alpha Premium offers great value for the in-depth research and Quant Ratings it provides. I’ve paired Premium with Alpha Picks because I like to open options contracts based on its stock selections and incorporate those recommendations into my long-term portfolio.