Our 58-point scientific TC2000 lab test, audit, and benchmarking include speed, accuracy, value, and feature depth with data-driven precision.
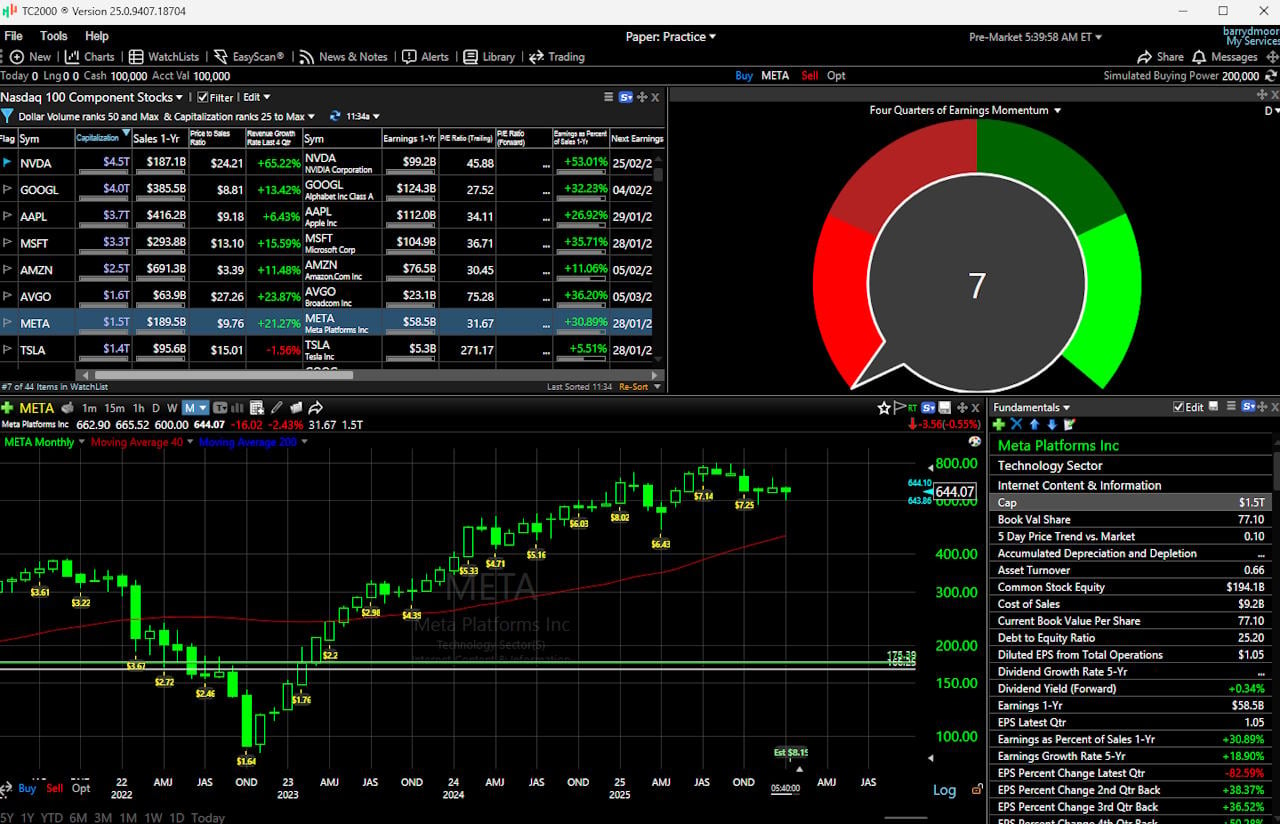
TC2000 is a desktop-first trading platform that’s built around one core promise: reduce friction between idea → scan → chart → decision → execution.
In my lab benchmarks across 17 categories, it earns a Composite Lab Performance Score of 4.30, slightly above the Median competitor (4.21). That headline score is driven by strong scanning, excellent multi-chart performance, reliable alerts, and best-in-class support responsiveness—while it materially underperforms the benchmark field on true strategy backtesting and AI/algorithmic layers.
Composite Lab Performance Score
TC2000 scores 4.30, slightly above the Median competitor (4.21) and within striking distance of the best-in-class ceiling (4.75). What holds TC2000 back from the very top isn’t trading usability—it’s the research engine behind systematic testing and AI/algo tooling.
| Metric | What It Measures | Calculation | TC2000 | High | Median | Low |
|---|---|---|---|---|---|---|
| Composite Lab Performance Score (CLPS) | Overall benchmark outcome | Avg of all ratings + 5× superpower boost | 4.30 | 4.75 | 4.21 | 2.93 |
| Composite Lab Performance Score (CLPS) Overall Test Winners | TradingView 4.75 | TrendSpider 4.72 | Trade Ideas 4.52 |
The Composite Lab Performance Score (CLPS) summarizes how well a platform performs across the full set of categories a trader typically relies on—charting, scanning, alerts, automation pathways, broker connectivity, support, and more. In practice, CLPS is a proxy for how often a tool helps (or slows) you during real trading weeks, not just feature checklists.
In Context: My audit notes consistently describe TC2000 as a platform that feels “built for trading,” not “built for experimentation.” If you spend most of your time acting on setups (rather than building new models), that design bias can be a net advantage.
Best for: active traders who need fast charting + scanning + execution flow.
Not ideal for: traders whose edge is built on heavy strategy simulation and iterative backtests.
Pair it with: a dedicated backtesting/quant tool if you’re strategy-first.
TC2000 Benchmarked Lab Scores
| Test | Tier | Score | Average |
|---|---|---|---|
| Lab Test Composite Score | AA | 4.30 | 4.21 |
| Pricing Index $/day | AA | $2.74 | $2.74 |
| Value Score (VP) | B | 3.39 | 2.82 |
| Speed & Ease of Use | AAA | 4.83 | 4.50 |
| Chart Analysis Depth Index | B | 3.78 | 3.17 |
| Chart Pattern Depth & Accuracy | C | 2.58 | 2.73 |
| Scanning Performance | AA | 4.32 | 3.38 |
| Backtesting Performance | C | 0.00 | 3.38 |
| Trading Bot & Auto-Trading Reliability | B | 3.00 | 2.50 |
| AI & Algo Index | C | 1.50 | 2.00 |
| Alert Speed | A | 4.00 | 3.67 |
| Trade Signal Quality | C | 0.00 | 0.00 |
| Broker Connectivity & Ecosystem Depth | C | 2.73 | 2.00 |
| Portfolio Tool Performance | C | 2.90 | 2.80 |
| Financial News Speed & Depth | B | 3.50 | 2.30 |
| Community Utility Index (CUI) | B | 3.50 | 3.25 |
| Support Infrastructure & SLA Audit | AAA | 5.00 | 3.75 |
If you’re deciding whether TC2000 fits your trading style, the key is to match the tool to your workflow: TC2000 is engineered for active, decision-heavy trading (where speed and clarity matter), not research-heavy systematic strategy development.
Verdict
TC2000 is a high-performance trading workstation built for traders who care about speed, scanning depth, clean execution workflows, dependable alerting, and operational reliability. If you’re discretionary and active, especially running multiple charts and scans, TC2000’s strengths show up every trading day.
If your trading style depends on systematic backtesting or AI-driven strategy generation, TC2000 should be your “front-end execution and scanning platform,” paired with a dedicated research engine for strategy validation.
Reasons to Consider TC2000
- Fast, low-friction trading workflow: Strong Speed & Ease of Use (4.83) with elite multi-chart responsiveness (10ms sync).
- Scanner-first capability: High Scanning Performance (4.32) with strong criteria depth and fast scan latency.
- Practical, scalable alerting: Alert Speed (4.00) supports active monitoring with meaningful capacity and delivery options.
- Best-in-class support responsiveness: Support Infrastructure (5.00) reduces operational risk for active traders.
Reasons to Avoid / Pair With Another Tool
- Backtesting is a major gap: Backtesting Performance is 0.00 vs Median 3.38. If strategy simulation is central, pair with Portfolio123 / TrendSpider / Trade Ideas.
- Pattern automation is not a leader: Chart Pattern Depth & Accuracy (2.58) is slightly below Median; pair with a pattern-discovery leader if you rely on automated patterns.
- AI layer is minimal: AI & Algo Index (1.50) reflects deterministic logic rather than AI-native discovery; pair with AI-forward tooling if that’s part of your edge.
Pricing Index
TC2000 lands exactly on the Median at $2.74. That means it’s neither a bargain leader nor an outlier in terms of per-feature premium. The practical reader takeaway is simple: you buy TC2000 for workflow and speed, not because it’s the lowest cost way to cover every feature category.
| Metric | What It Measures | Calculation | TC2000 | High | Median | Low |
|---|---|---|---|---|---|---|
| Pricing Index | Daily cost baseline | $/day on annual plan (min viable + data) | $2.74 | $9.99 | $2.74 | $0.74 |
| $ per feature | Cost efficiency | Effective Monthly Cost / Total Features | $5.95 | $23.37 | $5.95 | $1.94 |
| Effective Monthly Cost (EMC) | True monthly cost | Plan + data + required add-ons/month | $83.32 | $303.87 | $83.32 | $22.50 |
My audit notes point to TC2000’s “value” being realized only when you actually use its strengths: scanning, multi-chart workflows, and execution. If you’re mostly doing light research and occasional chart checks, you can often get comparable value for less.
This category is not about “cheap vs expensive.” It’s about cost efficiency, what you pay relative to the features you get, and what an average competitor delivers at a similar spend. Pricing & Value Index is anchored by the effective monthly cost (EMC) and the “$ per feature” efficiency, then summarized via a percentile ranking score.
Best for: traders who will actively use scanning, alerts, and execution features on a weekly basis. Additionally, if you choose TC2000 Brokerage for trading, you get TC2000 for free.
Not ideal for: casual investors who want maximum research breadth at minimum cost.
Value Score (VP)
Value Score (VP) answers a different question than pricing: “How good is the product relative to what it offers?” It weighs Feature Quality (60%), Feature Depth (30%), and Device Support (10%). This is important because many tools look “feature-rich” but don’t deliver consistent quality, depth, or usability.
TC2000’s VP is 3.39, comfortably above the Median competitor (2.82). That’s what you want to see in a platform you’ll use during active market hours: strong enough product quality that you’re not fighting the interface or second-guessing tool stability.
| Metric | What It Measures | Calculation | TC2000 | High | Median | Low |
|---|---|---|---|---|---|---|
| Value Score (VP) | Overall product value | 60% Quality + 30% Depth + 10% Device | 3.39 | 4.37 | 2.82 | 1.70 |
| Value Rank | Relative standing | Percentile ranking | 3.75 | 5.00 | 2.50 | 1.00 |
| Feature Quality | “How well it works.” | Avg of feature-quality ratings | 2.94 | 4.16 | 2.97 | 2.00 |
| Feature Breadth | Feature coverage | Count of meaningful core features | 14 | 17 | 12 | 9 |
| Feature Depth | Capability depth | Percentile ranking | 3.75 | 4.75 | 3.00 | 1.00 |
| Device Support Depth | Cross-device utility | Web/PC/iOS/Android points | 5.00 | 5.00 | 2.00 | 1.00 |
| Value Score Test Winners | TradingView 4.37 | TrendSpider 4.20 | Trade Ideas 4.05 |
In Context: My audit notes describe TC2000 as a tool that “stays out of your way.” That matters if your trading plan requires you to move quickly: a platform can be brilliant on paper and still be a poor value if it adds friction or stalls at the wrong time.
Best for: discretionary traders who want a reliable toolset and a stable UI.
Not ideal for: traders who need deep AI features or heavy research tooling in one platform.
Speed & Ease of Use
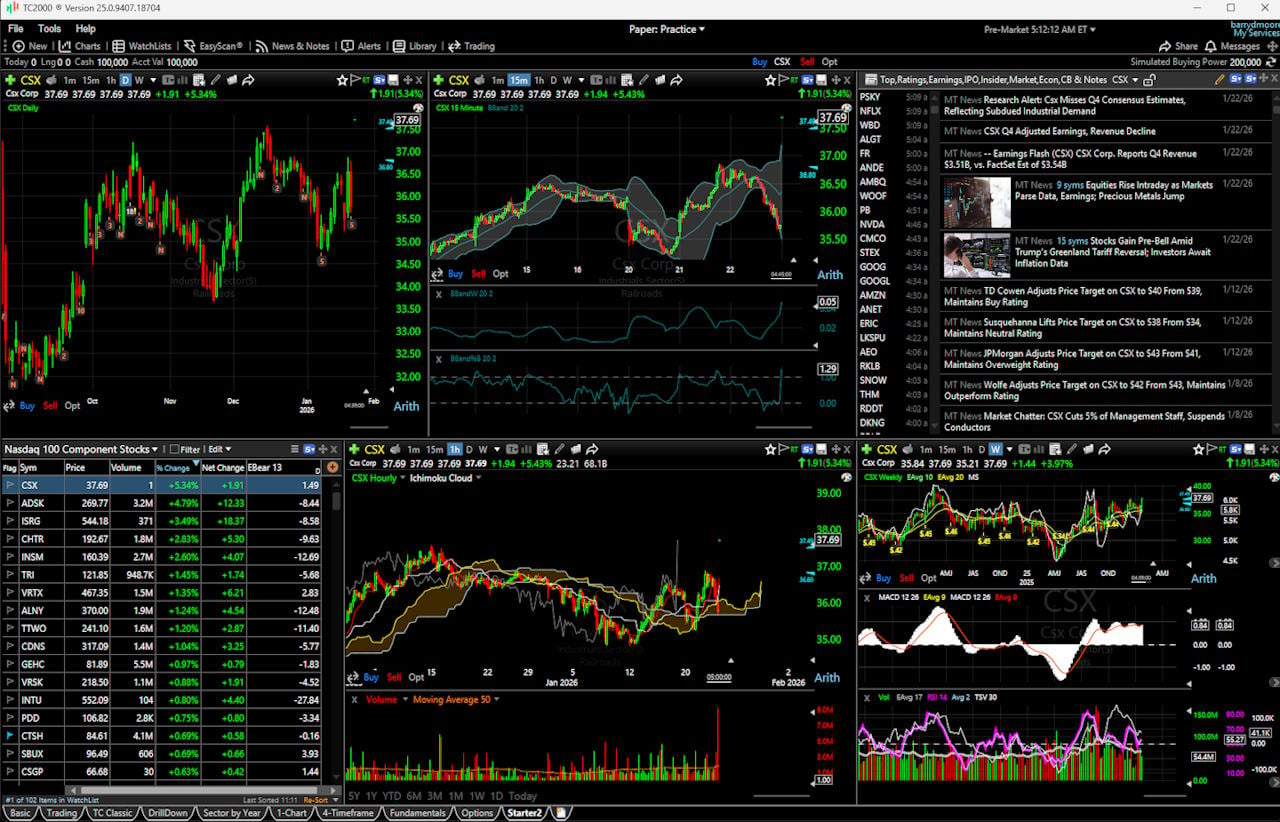
TC2000 scores 4.83, better than the median (4.50). The most meaningful datapoint for active traders is multi-chart latency: TC2000 is effectively the fastest multimonitor sync delay (10ms), which is exactly what you want when running 4+ charts and expecting the platform to feel “local.” Plus, it passes the 3-click rule and requires zero data feeds configuration.
| Metric | What It Measures | Calculation | TC2000 | High | Median | Low |
|---|---|---|---|---|---|---|
| Speed & Use Index Rating | Practical speed/usability | Avg of 3 sub-scores | 4.83 | 5.00 | 4.50 | 3.30 |
| Time to Chart Speed (Seconds) | Time to usable chart | Click → loaded chart + indicators | 7.30s | 17.03s | 4.70s | 1.60s |
| Time to Chart Performance | Speed points | Threshold scoring | 4.50 | 5.00 | 4.50 | 3.00 |
| Multi-Chart Latency (ms) | Multi-chart sync delay | Delay syncing 4 charts | 10ms | 667ms | 209ms | 10ms |
| Multimonitor Chart Speed | Latency points | Threshold scoring | 5.00 | 5.00 | 3.50 | 0.00 |
| 3-Click Rule Test | Workflow friction | Clicks to trade/launch scan | 3 | 6 | 3 | 2 |
| 3 Click Rule: Ease of Use | Friction score | Penalty beyond 3 clicks | 5.00 | 5.00 | 5.00 | 2.00 |
| Speed & Ease of Use Test Winners | TradingView 5.00 | Stock Rover 5.00 | Seeking Alpha 5.00 |
This category measures how quickly you can get to a decision-ready chart and maintain responsiveness across multiple charts—the real “cost” of software isn’t subscription price, it’s the delay and friction it introduces during time-sensitive moments.
In Context: My audit notes call TC2000 the “gold standard” for native responsiveness once running. For the reader, this matters most if you trade breakouts, momentum, or fast intraday setups—where the platform’s feel can influence entries and discipline.
Best for: multi-monitor traders and intraday workflows.
Not ideal for: web-first traders who rarely run complex chart layouts.
Chart Analysis Depth Index
Chart depth isn’t just “how many chart types exist.” It’s a blend of (1) chart-type variety, (2) indicator library depth, and (3) whether you can extend the platform with custom logic. The reason this matters is simple: technical traders evolve, and you want a platform that can support new methods without forcing a migration.
TC2000 scores 3.78, above the Median (3.17). It doesn’t lead on chart-type count (it’s not trying to), but it performs strongly on indicator depth and custom coding availability.
| Metric | What It Measures | Calculation | TC2000 | High | Median | Low |
|---|---|---|---|---|---|---|
| Chart Analysis Depth Index | Overall charting depth | Avg chart + indicators + coding | 3.78 | 5.00 | 3.17 | 0.50 |
| Chart Types | Chart variety | Total count | 7 | 38 | 10 | 1 |
| Chart Depth | Chart variety score | 0.3 points per chart | 2.10 | 5.00 | 3.00 | 0.30 |
| Indicators | Built-in indicators | Total count | 170 | 400 | 116 | 0 |
| Indicator Depth | Indicator score | 0.025 points per indicator | 4.25 | 5.00 | 2.90 | 0.00 |
| Custom Indicator Coding | Extendability | Available = 5 points | 5.00 | 5.00 | 2.50 | 0.00 |
| Chart Analysis Depth Index Test Winners | TradingView 5.00 | MetaStock 5.00 | Optuma 5.00 |
In Context: My audit notes describe TC2000 as “deterministic and stable”—great for traders who want consistent charting plus the ability to write formulas without living inside a complex scripting ecosystem.
Best for: technical traders who want strong indicators + custom logic in a fast UI.
Not ideal for: traders who want maximum chart-type experimentation and novelty.
Chart Pattern Depth & Accuracy
Automated pattern recognition is only valuable when it does two things: covers enough patterns to matter and stays accurate enough that traders trust it. Many traders abandon pattern engines because they generate noise, over-trigger, or miss context.
TC2000 scores 2.58, slightly below the Median (2.73). The story here is not accuracy—TC2000’s accuracy score is solid (90%)—it’s breadth: the platform’s pattern library is relatively small and especially limited on trend/price patterns in this benchmark set.
| Metric | What It Measures | Calculation | TC2000 | High | Median | Low |
|---|---|---|---|---|---|---|
| Pattern Recognition Efficacy & Accuracy | Overall pattern automation | Avg depth + accuracy | 2.58 | 4.88 | 2.73 | 0.00 |
| Total Patterns | Pattern breadth | Count of patterns recognized | 20 | 226 | 57.5 | 0 |
| Pattern Recognition Depth | Breadth score | 0.33 points per pattern | 0.66 | 5.00 | 1.90 | 0.00 |
| Candle Patterns Recognized | Candlestick set | Count | 20 | 172 | 20 | 0 |
| Chart Price & Trend Patterns Recognized | Trend/price patterns | Count | 0 | 54 | 16 | 0 |
| Accuracy | Correctness | Percent accurate | 90% | 95% | 89% | 0% |
| Pattern Recognition Accuracy | Accuracy points | 0.05 per % accurate | 4.50 | 4.75 | 4.48 | 0.00 |
| Chart Pattern Recognition & Accuracy Test Winners | TrendSpider 4.88 | Trade Ideas 4.62 | TradingView 3.98 |
In Context: My audit notes align with the numbers: TC2000 is more “scan logic + visual confirmation” than “automated discovery.” If you already know what you’re looking for, that’s fine. If you want the tool to proactively surface patterns, it’s not a leader.
Best for: traders who scan conditions and confirm patterns visually.
Not ideal for: traders who want automated pattern discovery to drive their watchlist.
Scanning Performance
Scanning is where many traders win or lose time. A scanner needs two things: speed (so it updates when the market changes) and depth (so you can express your strategy conditions). A scanner that’s fast but shallow is a toy; a scanner that’s deep but slow is frustrating.
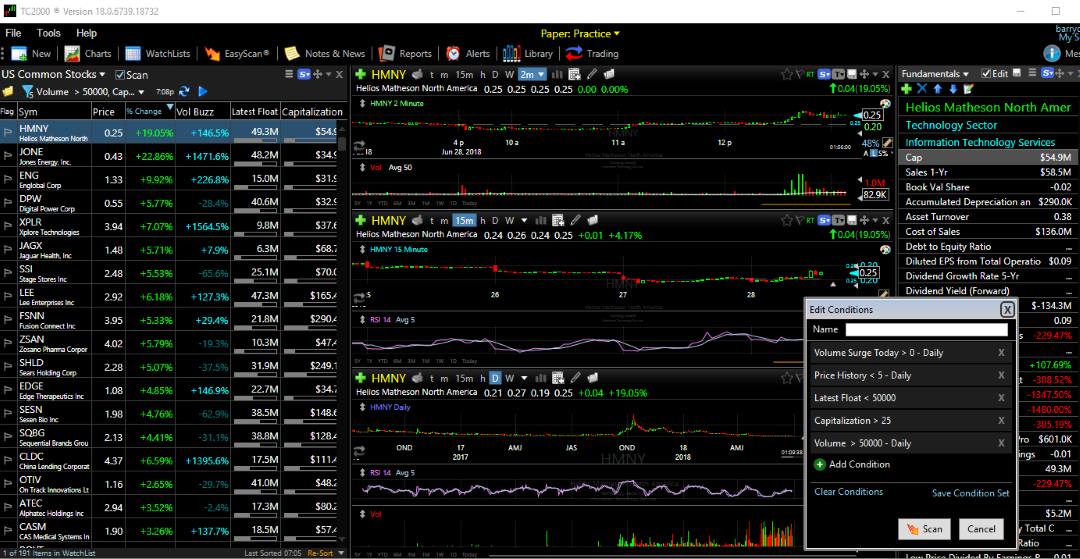
TC2000 scores 4.32 vs the Median (3.38). The key datapoints: strong raw scan speed (157ms) and high-quality criteria depth (276 criteria) with custom-code scanning supported.
| Metric | What It Measures | Calculation | TC2000 | High | Median | Low |
|---|---|---|---|---|---|---|
| Market Scanning Latency & Depth | Overall scanning capability | Avg speed + criteria + code | 4.32 | 5.00 | 3.38 | 0.80 |
| Scanner Performance (ms) | Raw scan time | S&P 500 across 5 criteria | 157ms | 2500ms | 300ms | 7ms |
| Scanning Speed (Points) | Speed score | Threshold scoring | 4.50 | 5.00 | 4.00 | 1.00 |
| Scanner Auto-Refresh Rate (seconds) | Refresh cadence | Not scored (context) | 1s | 60s | 1s | 0s |
| Scanning Criteria Count | Strategy expressiveness | Total criteria fields | 276 | 675 | 200 | 30 |
| Scanning Criteria & Depth (Points) | Criteria score | 0.0125 points per criterion | 3.45 | 5.00 | 2.50 | 0.80 |
| Custom Code Scanning | Programmability | Exists = 5 points | 5.00 | 5.00 | 5.00 | 0.00 |
| Scanning Performance Test Winners | Stock Rover 5.00 | TradingView 4.83 | TrendSpider 4.67 |
In Context: My audit notes highlight TC2000’s scanning as “trader-native”: it supports practical condition building without feeling laggy. If your workflow relies on generating opportunities from the market (rather than watching a fixed list), this is one of TC2000’s strongest advantages.
Best for: active traders who depend on scanning to find setups daily.
Not ideal for: investors who rarely scan and mostly read research.
Backtesting Performance
Backtesting is the difference between “I think this works” and “I have evidence this works.” In my benchmarks, this category evaluates speed, no-code testing availability, coded testing, reporting quality, and whether you can test baskets/portfolios.
TC2000 scores 0.00 versus the Median (3.38). For the reader, this has a clear implication: TC2000 is not the tool you choose if your process depends on validating strategies with historical simulation. It can still be excellent as an execution and scanning platform—but you’ll need another tool for strategy research.
| Metric | What It Measures | Calculation | TC2000 | High | Median | Low |
|---|---|---|---|---|---|---|
| Quantitative Backtesting Fidelity | Overall backtesting depth | Avg of 5 sub-scores | 0.00 | 4.90 | 3.38 | 0.00 |
| Backtesting Speed (ms) | Raw simulation speed | 10y daily / 2m 5-min | – | 6000ms | 302ms | 7ms |
| Backtesting Speed (Points) | Speed points | Threshold scoring | 0.00 | 5.00 | 4.25 | 0.00 |
| No Coding Required | No-code testing | 5 points if yes | 0.00 | 5.00 | 5.00 | 0.00 |
| Flexible Coding Backtesting | Coded testing | Exists = 5 points | 0.00 | 5.00 | 5.00 | 0.00 |
| Backtesting Report Quality (Points) | Reporting depth | 0.05 per 1% criteria | 0.00 | 5.00 | 2.25 | 0.00 |
| Multi-Stock Basket Backtesting | Portfolio simulation | Exists = 5 points | – | 5.00 | 5.00 | 0.00 |
| Backtesting Performance Test Winners | Optuma 4.94 | TrendSpider 4.88 | MetaStock 4.81 |
In Context: My audit notes reinforce what the score says: TC2000 is optimized for live workflows. If your edge requires rigorous testing, treat TC2000 as the “trading workstation,” and run research elsewhere.
Best for: discretionary traders who validate setups with scanning + charts.
Not ideal for: systematic traders who need backtests to approve trades.
Pair it with: TrendSpider for strategy validation.
Trading Bot & Auto-Trading Reliability
This category is about how safely and realistically a tool supports automation—ranging from “alerts only” to “native execution,” plus the sophistication of the strategy engine and operational reliability signals.
TC2000 scores 3.00 vs Median 2.50. The nuance matters: TC2000 can support condition-driven execution workflows, but it is not a “bot platform” in the modern sense (webhook ecosystems, bot orchestration, AI-native execution).
| Metric | What It Measures | Calculation | TC2000 | High | Median | Low |
|---|---|---|---|---|---|---|
| Automated Execution & Bot Reliability | Automation readiness | Sum of sub-metrics | 3.00 | 4.50 | 2.50 | 0.00 |
| Automation Path | How automation is executed | 0–2 rubric | 2.0 | 2.0 | 1.0 | 0.0 |
| Strategy/Bot Sophistication | Logic depth | 0–2 rubric | 1.0 | 2.0 | 1.5 | 0.0 |
| Operational Assurance | Reliability posture | 0–1 rubric | 0.0 | 1.0 | 0.0 | 0.0 |
| Bot & Auto-Trading Reliability Test Winners | TrendSpider 4.50 | Trade Ideas 4.00 | Tickeron 4.00 |
TC2000’s best automation use case is “structured execution,” where you still control the process and reduce mistakes—not hands-off bot farming. For many traders, that’s the safer and more sustainable approach.
Best for: traders who want conditional execution workflows without bot complexity.
Not ideal for: traders who require webhook-driven automation stacks and orchestration.
AI & Algo Index
AI & Algo Index distinguishes three things: (1) algorithmic depth, (2) presence of an AI layer, and (3) transparency/validation. The practical question for readers is: Does the tool help you generate better decisions (and can you trust how it got there)?
TC2000 scores 1.50 vs Median 2.00. That’s exactly what you’d expect from a deterministic, trader-centric platform: it has logic and scripting, but no meaningful AI layer as a core capability.
| Metric | What It Measures | Calculation | TC2000 | High | Median | Low |
|---|---|---|---|---|---|---|
| Algorithmic Intelligence & AI Tier Index | Overall AI/algo tier | Algo depth + AI + transparency | 1.50 | 5.00 | 2.00 | 1.00 |
| Algo Depth | Strategy/model depth | 0–2 rubric | 1.0 | 2.0 | 1.5 | 1.0 |
| AI Layer | AI presence | 0–2 rubric | 0.0 | 2.0 | 0.0 | 0.0 |
| Transparency | Explainability | 0–1 rubric | 1.0 | 1.0 | 1.0 | 0.0 |
| AI & Algo Index Test Winners | TrendSpider 5.00 | Trade Ideas 4.50 | Tickeron 4.50 |
In Context: My audit notes frame this as a design choice: TC2000 is built for traders who want deterministic tools and personal control. If you specifically want AI-driven discovery, TC2000 isn’t built to compete there.
Best for: traders who prefer rule-based tools and transparency over AI layers.
Not ideal for: traders seeking AI-native forecasting, signals, or strategy synthesis.
Alert Speed
TC2000 scores 4.00 vs Median 3.67—a meaningful edge for active traders. The platform supports a high concurrent alert capacity (1,000) and a practical mix of delivery options, which is what you need if alerts are central to your workflow.
| Metric | What It Measures | Calculation | TC2000 | High | Median | Low |
|---|---|---|---|---|---|---|
| Alert Trigger Latency & Delivery Speed | Overall alert utility | Avg of 3 scores | 4.00 | 4.67 | 3.67 | 2.30 |
| Concurrent Alerts | Capacity score | 1 point per 50 (max 5) | 5.00 | 5.00 | 5.00 | 5.00 |
| Concurrent Alert Count | Raw capacity | Count / Unlimited | 1000 | 2000 | 875 | 400 |
| Alert Streams Richness | Delivery breadth | 1 point per stream (max 5) | 3.00 | 5.00 | 2.00 | 1.00 |
| Alert Speed Rating | Practical speed | 0–5 rating | 4.00 | 5.00 | 3.00 | 1.00 |
| Alert Speed Test Winners | TradingView 4.67 | TrendSpider 4.33 | Benzinga Pro 4.33 |
Alerts matter because they compress attention: instead of watching everything, you watch what matters. My benchmark scores alerting on (1) capacity, (2) delivery channel richness, and (3) real-world speed.
In Context: My audit notes emphasize that TC2000 alerts are “platform-grade”—built for active monitoring and decision flow. If you rely on alerts to reduce screen time and increase discipline, this is a strong category for TC2000.
Best for: traders who run many alerts and act intraday.
Not ideal for: automation-heavy traders who require webhooks as the primary delivery path.
Trade Signal Quality
This category measures whether the platform provides audited, actionable buy/sell signals as a core product feature. Many traders want signals; many others prefer a toolkit. The score tells you which you’re buying.
TC2000 scores 0.00, matching the Median (0.00). In other words: TC2000 is not a “signal provider.” It’s a platform for traders who generate signals themselves.
| Metric | What It Measures | Calculation | Tool | High | Median | Low | Category Winner |
|---|---|---|---|---|---|---|---|
| Signal Alpha & Predictive Efficacy | Built-in signals | Audited signals vs gauges | 0.00 | 5.00 | 0.00 | 0.00 | Trade Ideas, Tickeron, Motley Fool, Seeking Alpha |
In Context: My audit notes align: TC2000 is designed to help you build a repeatable trading workflow—scans, charts, alerts, execution—not to tell you what to buy or sell.
Best for: self-directed traders building their own setups.
Not ideal for: traders who want plug-and-play signals.
Broker Connectivity & Ecosystem Depth
TC2000 scores 2.73, above the Median (2.00). The headline nuance: TC2000 strongly supports live trading, but its breadth of broker integration is limited compared to ecosystem-heavy platforms.
| Metric | What It Measures | Calculation | TC2000 | High | Median | Low |
|---|---|---|---|---|---|---|
| Asset & Data Coverage Index | Overall connectivity | Avg of scored sub-metrics | 2.73 | 5.00 | 2.00 | 0.67 |
| Live Trading | Can execute trades | 5 points if yes | 5.00 | 5.00 | 5.00 | 0.00 |
| Total number of brokers integrated | Broker breadth | Raw count | 2 | 1200 | 2 | 0 |
| Broker Integration | Broker depth score | 0.1 point per broker (max 5) | 0.20 | 5.00 | 0.20 | 0.00 |
| Asset & Data Coverage | Market breadth | Stocks/Options/FX/US/Intl | 3.00 | 5.00 | 2.00 | 2.00 |
| Broker Connectivity & Ecosystem Test Winners | TradingView 5.00 | MetaTrader 5.00 | TrendSpider 4.43 |
In Context: TC2000 is a clean execution workflow rather than a broker marketplace. If you already have a preferred broker path, that can be enough. If you constantly switch brokers or require broad routing, this won’t be a strength.
This category blends (1) live trading support, (2) breadth of broker integrations, and (3) breadth of asset/data coverage. It matters because a tool can be great at analysis but still be awkward for execution, or locked into a narrow broker ecosystem.
Best for: traders who want integrated execution and don’t need broad broker routing.
Not ideal for: traders who prioritize multi-broker ecosystems.
Portfolio Tool Performance
Portfolio tools matter more for investors and swing traders than for pure day traders. This category measures how well the platform helps with risk metrics, correlation insight, dividend/portfolio health reporting, and overall portfolio “dashboard” quality.
TC2000 scores 2.90, slightly above Median (2.80). That suggests it’s useful for tracking and basic portfolio management, but not a replacement for dedicated portfolio analytics platforms.
| Metric | What It Measures | Calculation | Tool | High | Median | Low | Category Winner |
|---|---|---|---|---|---|---|---|
| Portfolio Health & Risk Analytics | Overall portfolio depth | Category score | 2.90 | 4.80 | 2.80 | 2.00 | Stock Rover, Portfolio123 |
| Health Check & Reporting Depth | Depth of coverage | % critical metrics covered | 37/80 (46.2%) | 76/80 (95.0%) | 36/80 (45.0%) | 20/80 (25.0%) | Stock Rover, Portfolio123 |
In Context: TC2000’s portfolio view is practical, but not “institutional-grade analytics.” If you need correlations, Monte Carlo, deep rebalancing workflows, or factor-style reporting, you’ll want a dedicated portfolio tool.
Best for: traders who track positions alongside scanning and charts.
Not ideal for portfolio optimization and risk modeling workflows.
Pair it with: Stock Rover / Portfolio123 for advanced portfolio analytics.
Financial News Speed & Depth
News tools matter when catalysts move the price. This category measures whether the platform can deliver news in a way that’s usable for trading: alerts, filtering, watchlist relevance, and speed relative to primary wires.
TC2000 scores 3.50, well above Median (2.30). It’s not a wire terminal, but it has MT Newswire, which is meaningfully better than platforms where news is effectively an afterthought.
| Metric | What It Measures | Calculation | TC2000 | High | Median | Low |
|---|---|---|---|---|---|---|
| Financial News Speed & Quality Rating | News trading utility | Weighted rubric | 3.50 | 5.00 | 2.30 | 0.00 |
| Seconds of delay vs primary wires | Raw speed range | App vs wire feeds | 20s–60s | < 1s | 60s–120s | Hours/Days |
| Financial News Speed & Depth Test Winners | MetaStock 5.00 | Benzinga Pro 5.00 | Scanz 5.00 |
In Context: TC2000’s news value is “workflow integration”—useful context and filtering rather than ultra-low-latency scalp triggers. If you trade earnings reactions, upgrades/downgrades, or catalyst breakouts, this category matters.
Best for: traders who use news as catalyst context alongside scanning.
Not ideal for: pure news scalpers who require terminal-grade speed.
Community Utility Index (CUI)
Community is not about popularity—it’s about whether the community produces usable IP: scans, layouts, strategies, code, and practical workflow improvements. A strong community can reduce learning time and improve execution quality.
TC2000 scores 3.50, above Median (3.25). The community is stable and useful, but it’s not the kind of “massive open-source signal ecosystem” that scripting-social platforms dominate.
| Metric | What It Measures | Calculation | TC2000 | High | Median | Low |
|---|---|---|---|---|---|---|
| Community Utility Index | Overall community value | Avg size + contribution | 3.50 | 5.00 | 3.25 | 1.80 |
| Active Community Size | Crowd density | 0–5 scale | 3.50 | 5.00 | 3.00 | 2.00 |
| Quality of Community Contribution | Practical IP quality | 0–5 scale | 3.50 | 5.00 | 3.50 | 1.50 |
| Community Utility Index Test Winners | TradingView 5.00 | MetaTrader 5.00 | Trade Ideas 4.75 |
In Context: TC2000’s community value as “legacy bulletin boards” with experienced user guidance. If you want a community that ships constant new code/strategies, other ecosystems are stronger.
Best for: traders who want practical platform usage help and stable peer knowledge.
Not ideal for: traders seeking a constant stream of community-built algorithms.
Support Infrastructure & SLA Audit
Support is an underrated trading edge: it reduces operational risk. When tools break during market hours, support quality determines whether you lose minutes, hours, or days.
TC2000 scores 5.00, decisively above Median (3.75) and at the top of the benchmark set. This is one of the clearest “trust” signals in my dataset.
| Metric | What It Measures | Calculation | TC2000 | High | Median | Low |
|---|---|---|---|---|---|---|
| Support SLA Audit: Time-to-Human Benchmarks | Overall support posture | Avg channels + response | 5.00 | 5.00 | 3.75 | 1.00 |
| Support Communication Channels | Access scale | 0–5 rubric | 5.00 | 5.00 | 3.50 | 1.00 |
| Support Response Times | Time-to-human | 0–5 rubric | 5.00 | 5.00 | 4.00 | 1.00 |
| Stated SLA & Tested Outcomes | Real-world outcome | Raw stated/tested | < 15 Minutes | – | – | – |
| Support Infrastructure & SLA Audit Winners | TrendSpider 5.00 | TC2000 5.00 | ThinkorSwim 4.75 |
In Context: This a practical buying reason: if you’re an active trader, the cost of bad support is not annoyance—it’s missed trades, broken alerts, and avoidable operational losses.
Best for: traders who value reliability and fast time-to-human support.
Not ideal for: occasional traders who rarely need support.