We use independent 58-point tests in our research. We may earn commissions with our links, this never affects our ratings.
My lab tests show that the best beginner trading platforms are TradingView, TrendSpider, and Finviz. TradingView leads in price, community, trading, and charting; Finviz for easy screening and charting; and TrendSpider for AI-automated trendline and pattern recognition.
I have fully paid subscriptions to each of the recommended platforms and have been using them for years. I know what features and benefits are perfect for new traders and investors.
Editors’ Picks for Best Beginner Trading Platforms
TradingView: Winner Best Trading Platform for Beginners
TrendSpider: Automated Stock Charts Analysis for Beginners
TC2000: Easy to Use Charts & Great Resources For Beginners.
Finviz: Fast Free Stock Charts & Screening For Beginners
Our winner for best trading platform for beginners is TradingView because it is free, has 20 million users generating educational content, and is incredibly easy to use. TrendSpider uses AI and smart algorithms to detect stock chart patterns and trendlines on multiple timeframes, helping novice traders learn quickly and effectively.
Finviz is also great for beginners, as it provides useful trading data in a simple format and includes chart-pattern screening.
Finally, TC2000, the software I learned to trade with, is intuitive and offers integrated chart-based trading through the TC2000 Brokerage.
1. TradingView: Winner Best Trading Platform for Beginners
My research shows that TradingView is ideal for beginners, as it is an excellent platform for learning to trade. The TradingView community helps educate and inspire traders, and, best of all, the platform is free and easy to use, yet powerful enough to grow with you on your learning path.
TradingView is the world’s premier trading platform, trusted by over 20 million active traders. It offers a seamless blend of powerful charting tools, advanced screening features, and in-depth analysis, covering a wide range of assets, including stocks, indices, ETFs, and cryptocurrencies.
TradingView provides best-in-class technical analysis tools to analyze financial markets. It offers heatmaps, super charts, indicators, strategy development tools, and backtesting capabilities.
Its vibrant community of traders shares ideas, strategies, and custom indicators, making it an invaluable resource for learning and collaboration.
I actively use TradingView daily; it is a key tool in my portfolio and great for beginners and experienced traders. That means the platform will grow with you. TradingView has excellent social integration, chat, news, and the ability to follow other investors and view and share trade ideas. In addition to global stock exchange data, TradingView is the best platform for global stock trading and charting.
TradingView Platform For Beginners
TradingView runs on PCs, Macs, Tablets, and Smartphones and requires zero installation; it simply works. The Market data is huge, covering nearly all Stock Markets. It includes stocks, ETFs, Futures, foreign exchange, and bonds, all at no extra cost, which means outstanding value for money and excellent support options.
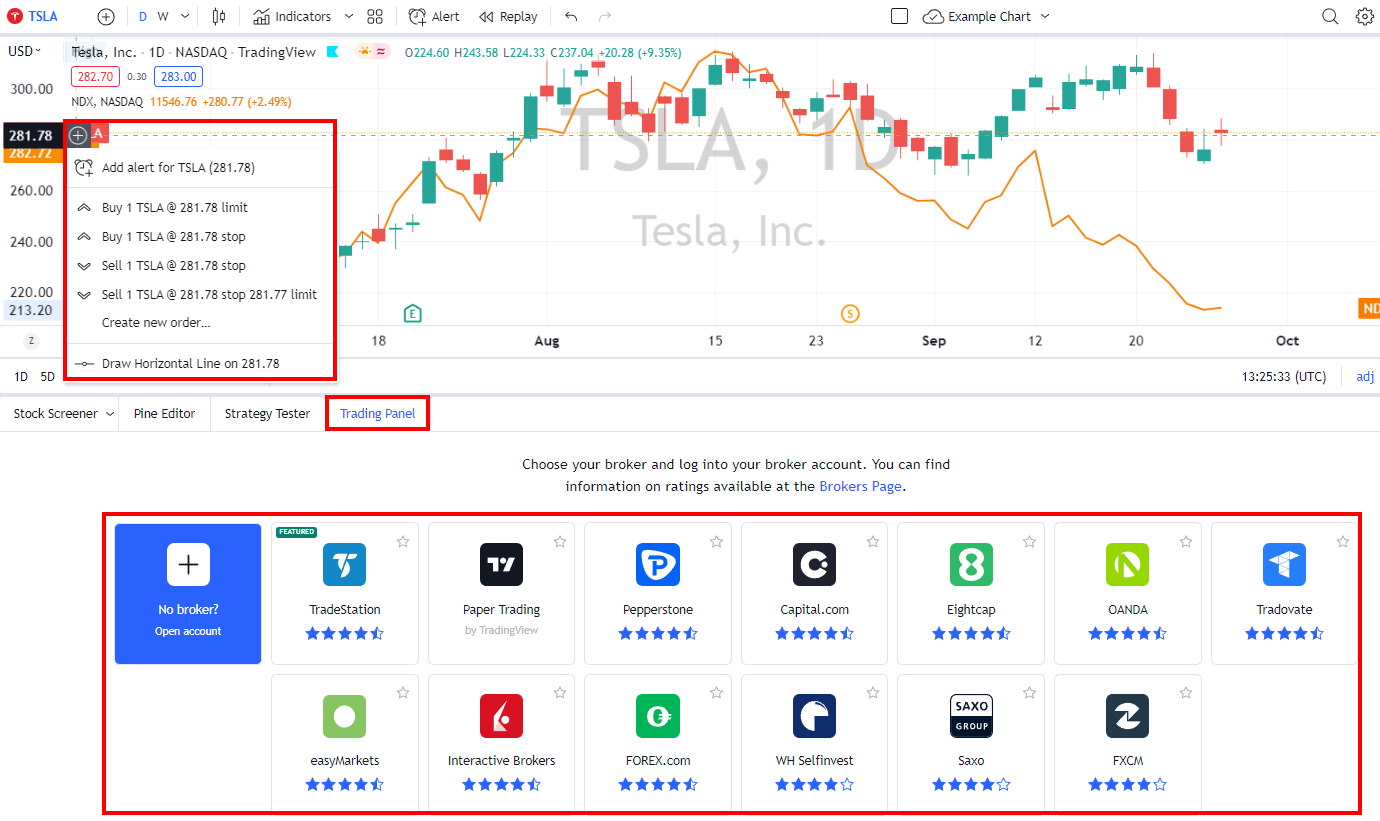
Testing TradingView’s Broker Integration, Depth and Trading from Charts
Testing TradingView’s Backtesting & Strategy Development. Very fast single-stock backtesting with Pine Script.
Also, a huge benefit is that the data speed and coverage are mind-blowing, covering literally every stock market on the planet, and not just stocks, but a lot more.
What Can I Trade Using TradingView?
TradingView makes trading easy for beginners by allowing you to trade stocks, forex, futures, currencies, and bonds globally from a single account. Trade Management. TradingView makes trading simple because it offers broker integration in every country, lets you place trades on charts, and handles profit and loss reporting and analysis.
Why is TradingView Perfect For Beginners?
TradingView is perfect for beginners because it has a thriving community of thousands of creators and analysts who provide stock charts, ideas, and thoughtful educational content that helps novices learn quickly. You can follow me on TradingView to read my market analysis and educational articles.
Chart, Scan, Trade & Join Me On TradingView for Free
Join me and 20 million traders on TradingView for free. TradingView is a great platform for connecting with other investors, sharing ideas, creating charts, and engaging in live chat.
TradingView is built with social media at the forefront, and it is simply the best way to share and learn socially. Forget StockTwits; TradingView is the best. Fully integrated chat systems and forums are excellent ways to share your drawings and analysis with any group or forum at the click of a button.
TradingView is an excellent way to generate trade ideas or learn from other traders. You have to try it and see it in action to understand the power of the implementation. However, I always warn you to be careful of who you listen to; you should always make up your own mind.
They have also thoughtfully integrated a Kiplinger newsfeed, Stocktwits, and various FX newsfeeds. It is a great package with a social-first development methodology, powerful economic statistics, and a solid newsfeed.
Connecting to TradingView makes you realize it is developed for the community. You can look at community trade ideas, post your charts and ideas, and join countless groups covering everything from bonds to Cryptocurrency.
Screening For Beginners & Experienced Traders
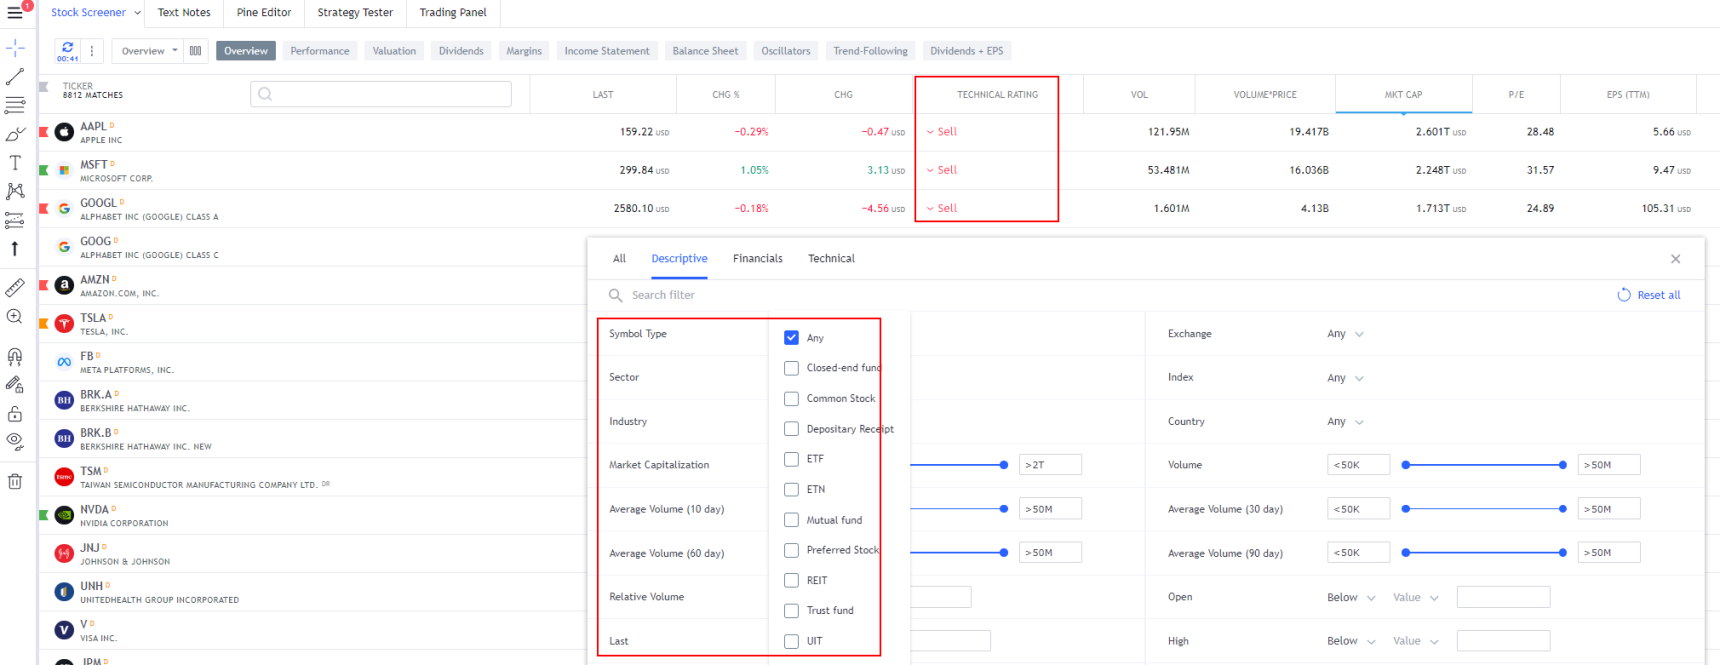
TradingView makes it easy to find stocks to trade because its screener is simple yet powerful. The list of financials you can scan and filter on is truly huge. Any idea you have based on fundamentals will be covered. Watchlists include performance, valuation, dividends, margins, income statements, and balance sheets. You can set the watchlist and filters to refresh every minute.
TradingView vs. Stock Charts: TradingViews Screener
TradingView Stock Screener comes complete with 150 fundamental and technical screening criteria. All the usual criteria are there, such as EPS, Quick Ratio, Pre-Tax Margin, and PE Ratio (forward and trailing 12-month). However, it also goes deeper with more esoteric criteria, such as the number of employees, goodwill, and enterprise value.
Another great thing about the screener implementation is that it is highly customizable; you can configure the columns and filters exactly how you like.
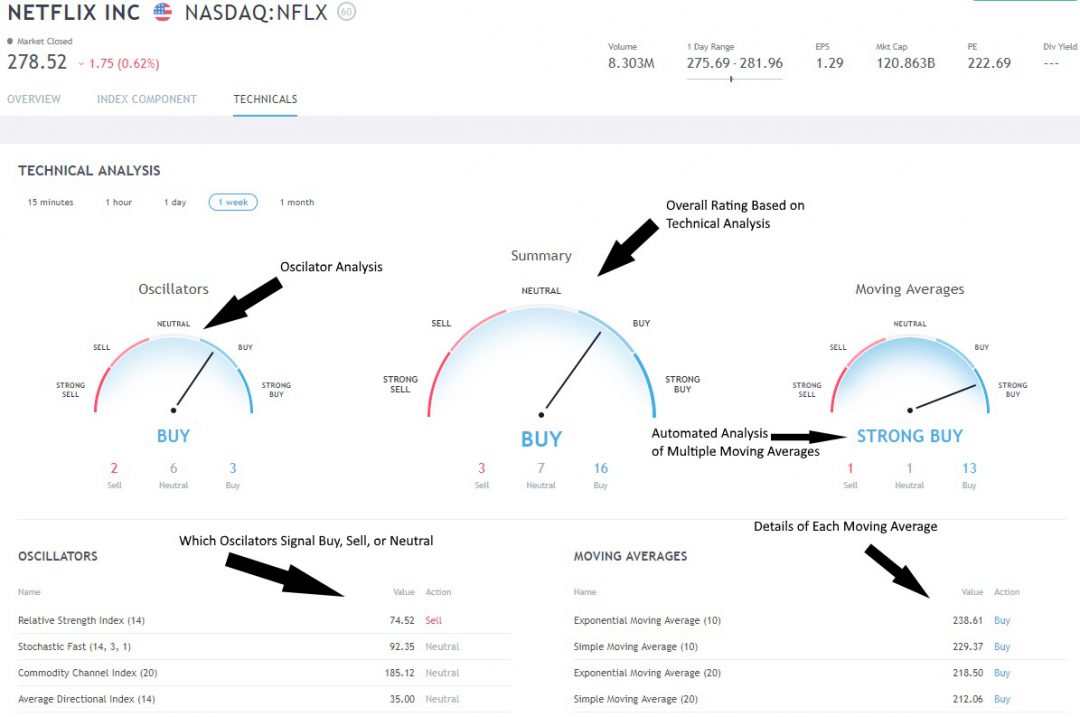
Most people do not want to learn in-depth how each indicator works. This innovation allows you to save time by getting an instant readout of which indicators are bullish, bearish, or neutral.
This is well implemented because two key technical analysis indicators are moving averages based on price and oscillators based on price or volume.
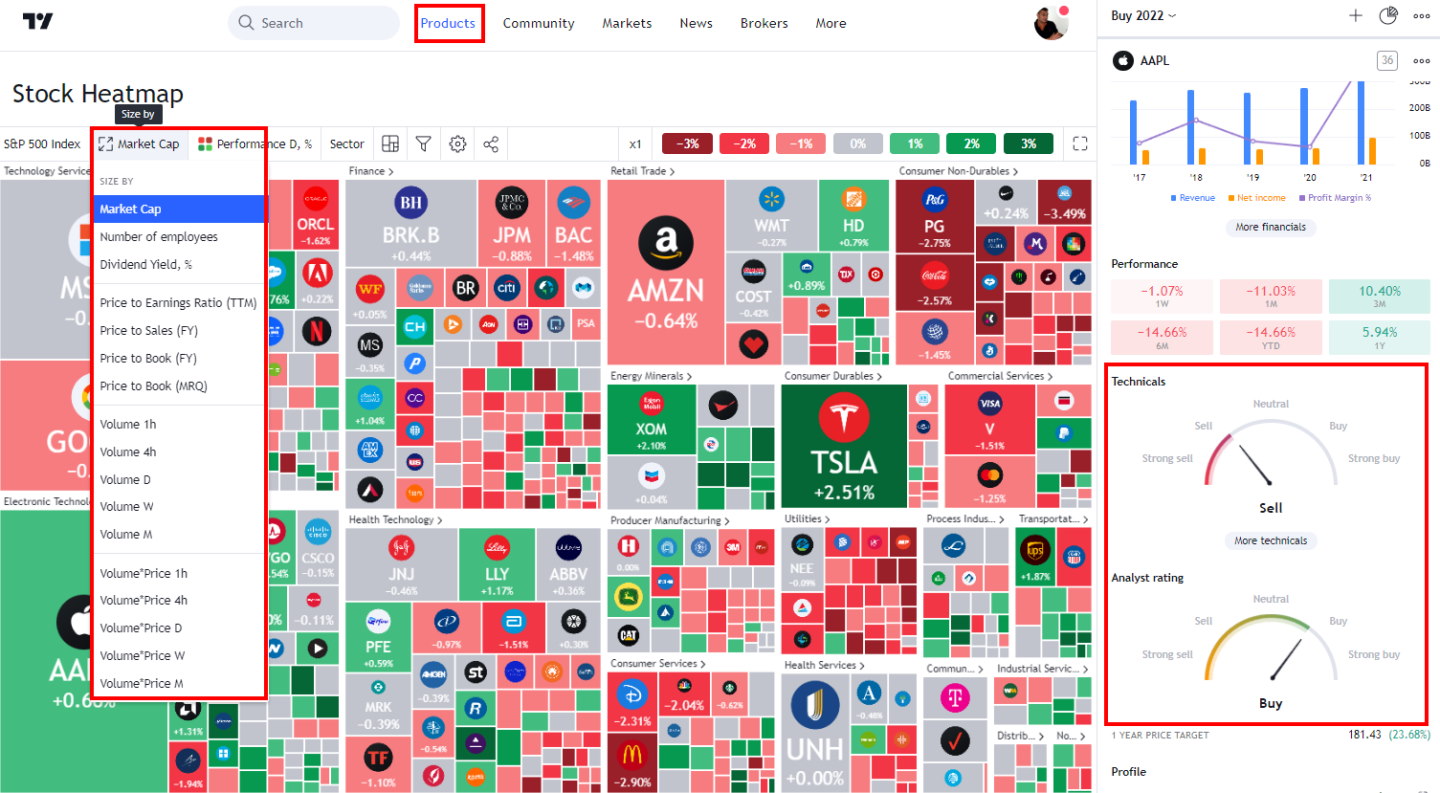
TradingView has implemented an innovative automatic technical analysis rating system that accurately suggests whether an indicator is Buy, Sell, or Neutral.
When you view a chart, you can click “Technicals,” and you are presented with three gauges. The left gauge shows the oscillating indicators, such as relative strength, stochastics, and average directional index. On the right, you have a selection of moving averages, simple, exponential, and even the Ichimoku cloud.
Each indicator is then averaged to give an overall Buy, Sell, or Neutral Rating. It is an excellent implementation of automated technical analysis designed with the user in mind.
2. Simple Yet Advanced Charts
I was incredibly impressed with the Kagi, Heikin Ashi, and Renko Charts offering, including Point and Figure and Line Breaks. The user community has also developed indicators as exotic as the Moon Phase (see chart below).
With this selection of charts, you have everything you need as an advanced trader. You also get Level II insight, which is fully integrated with the Premium membership. Well done, TradingView.
Did I mention the charts are fast and beautiful?
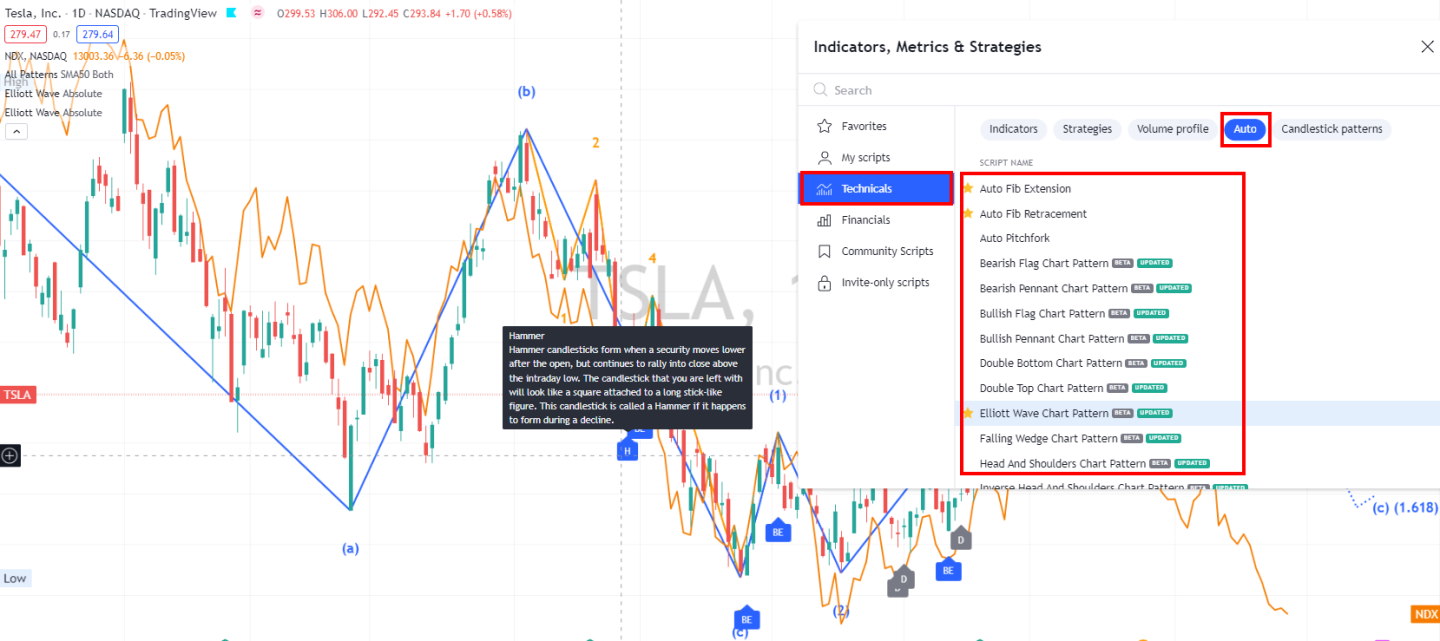
They have also implemented the Darvas Box, Elliot Wave, and Point & Figure Charts for the technical analyst. Overall, this is an excellent package.
3. TradingView Alerts on Indicators & Drawings
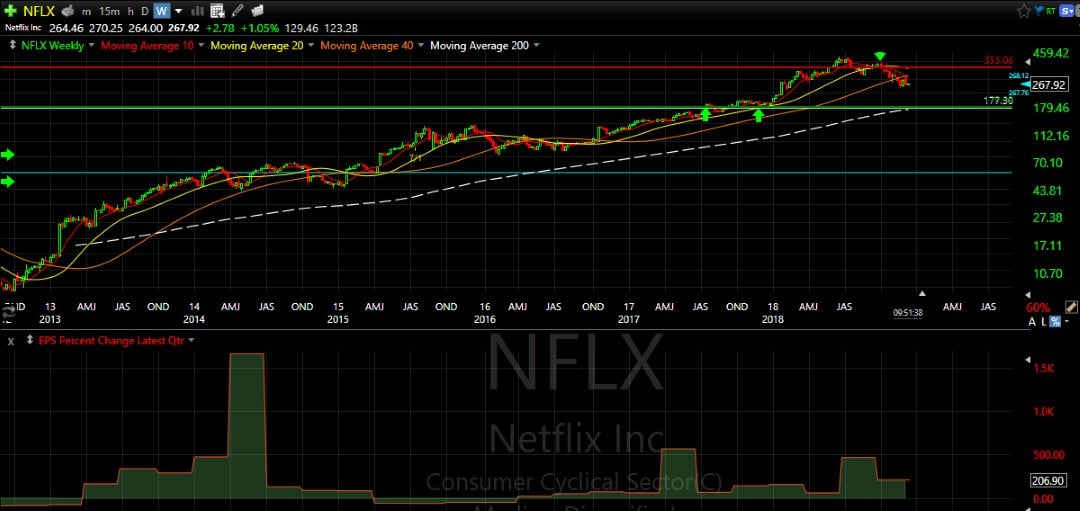
TradingView alerts are immediate notifications that are triggered when the market meets your custom criteria. For example, “Alert me if Netflix crosses $200 up”. You can place alerts on indicators, prices, or trendlines; it is extremely flexible. All users can get visual popups, audio signals, email alerts, and email-to-SMS alerts. A premium plan subscriber can also get real-time alerts.
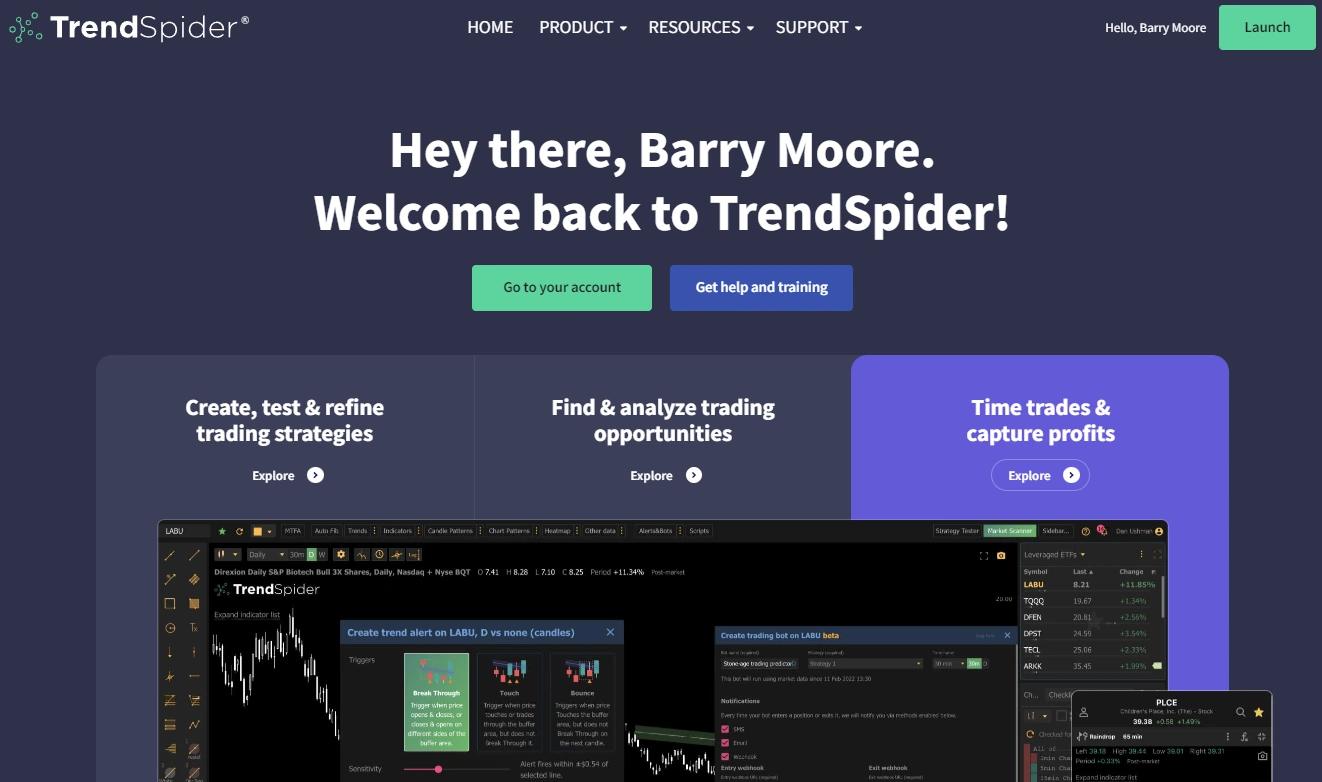
2. TrendSpider: Automated Stock Charts Analysis
Trendspider is perfect for beginners because it does everything for you: chart analysis, drawing trendlines, tweaking indicators, and scanning news and analyst ratings.
My research reveals that TrendSpider is an excellent choice for US traders seeking AI-driven tools for charting, pattern recognition, and backtesting across stocks, indices, futures, and currencies. The platform stands out by automatically detecting trendlines, Fibonacci levels, and candlestick patterns. With its robust backtesting capabilities and multi-timeframe analysis, TrendSpider is particularly well-suited for seasoned technical traders looking to refine their strategies.
TrendSpider stands out by leveraging AI and machine learning to streamline traders’ workflow, bringing automated trend and pattern recognition to the forefront. With TrendSpider, traders gain access to advanced analysis and strategy-testing capabilities, surpassing manual efforts in both scale and efficiency.
★ TrendSpider July 4th Sale is Live
Save 38% on TrendSpider
Our Top Rated 4.72 ⭐ Trading Tool ✅ Leader in AI Trading & Chart Pattern Recognition ✅ Scanning & Auto-Trading
Charts, Watchlists, Screening, Free Real-time Data
🏆 Unique Features ?
AI Automated Trendlines, Fibonacci, Candlestick Pattern Recognition, Auto-Bot Trading, Code-free Powerful Backtesting, Launch and Train Personal AI Models with Strategy Lab.
TrendSpider’s automated trendline detection saves newbies a lot of time, speeds up morning trade preparation, and improves accuracy. The TrendSpider algorithm uses mathematical methods to correlate all bars on a chart and draw lines.
As a technical analyst, this is how you are supposed to do it; the more times a price touches the trend line and reverses, the stronger the trend. Therefore, it is more predictive if a price breaks through strong support and resistance areas.
If you do not like a trend that the AI has used, you can manually delete it or fine-tune it. With this capability, you can complete trendline analysis on any chart in a few seconds.
Key Benefits For Beginners
TrendSpider stands out with its automated identification of candlestick patterns, trendlines, and chart patterns, which is great for beginners.
It makes strategy development accessible for beginner traders with simple point-and-click backtesting that automatically shows buy and sell signals on the chart.
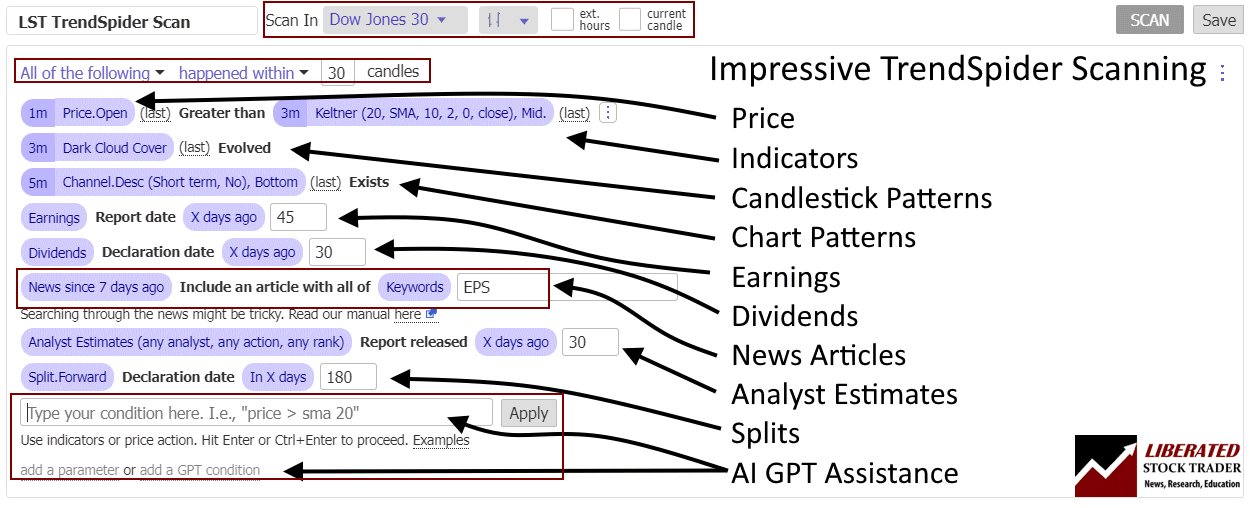
TrendSpider has rolled out an AI-powered assistant that lets you just type what you want, and it’ll handle the rest.
Additionally, TrendSpider helps you search for financial news, analyst estimates, rating changes, and insider trades.
What blew me away is that the TrendSpider team has found an elegant way to combine the masses of computed data into a single chart.
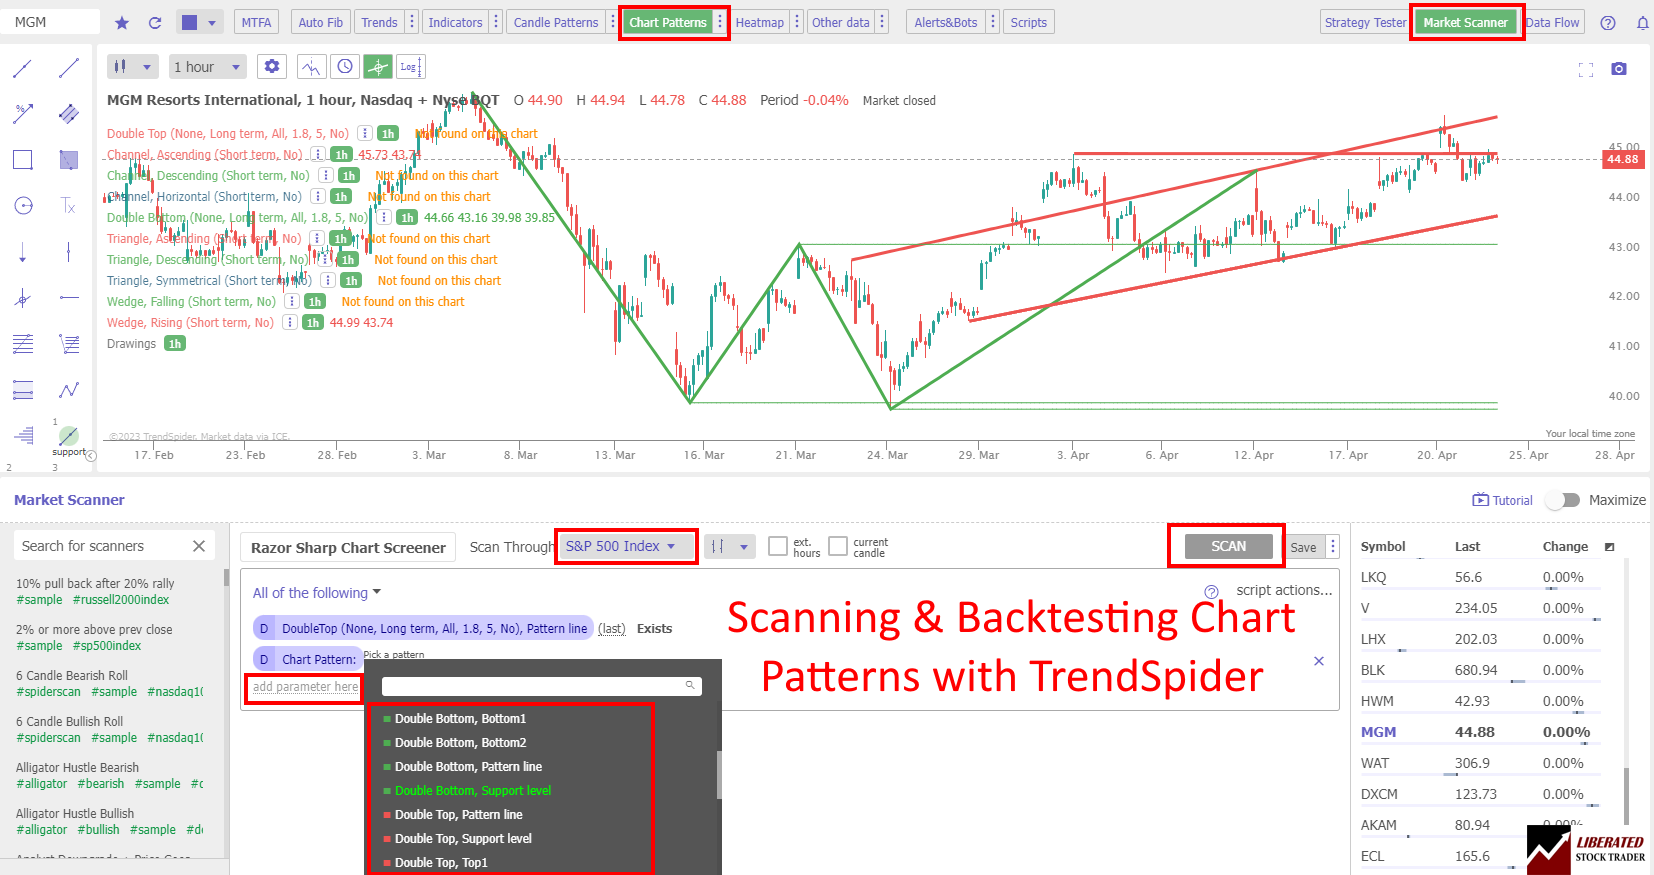
Showcasing TrendSpider’s powerful automation, intuitive charting, and robust backtesting features.
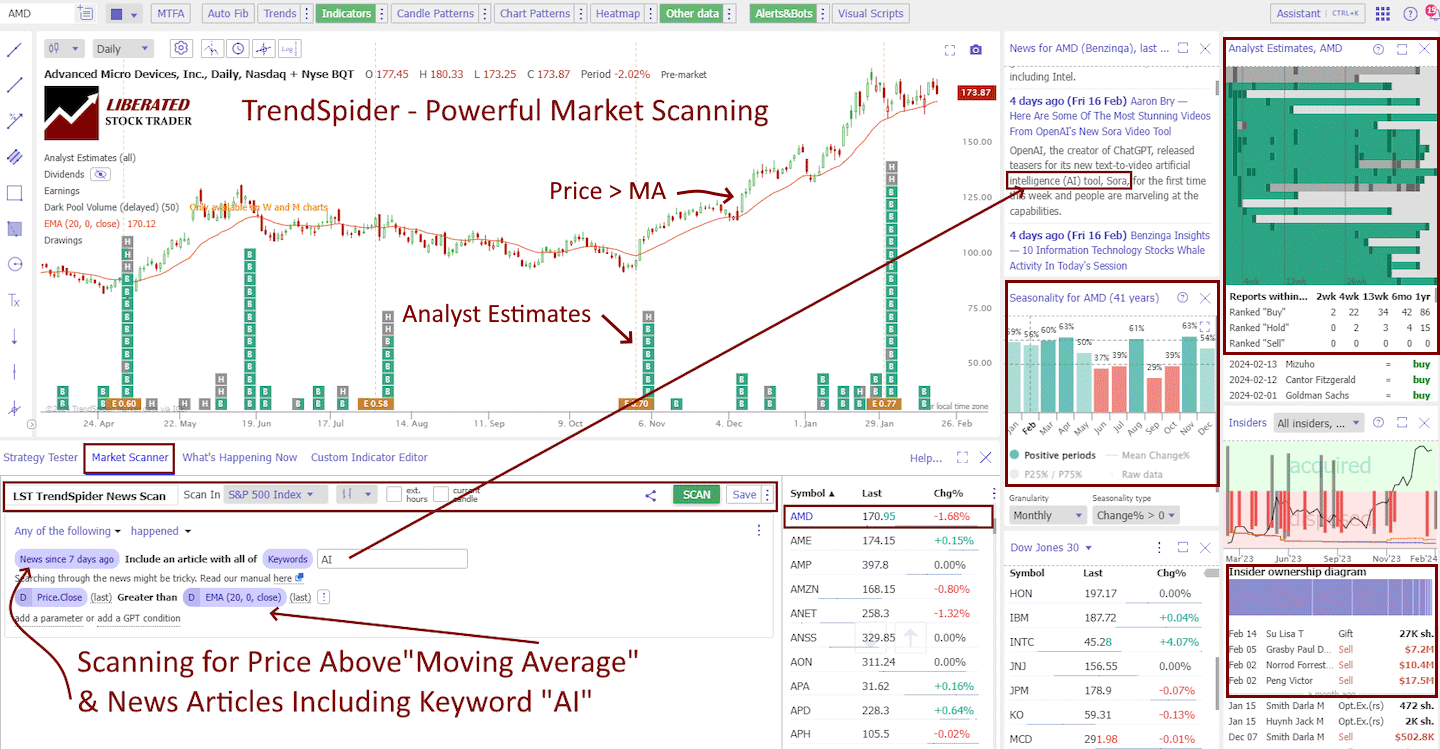
Testing TrendSpider’s powerful multi-layered screening and scanning features. Note: No Coding Required.
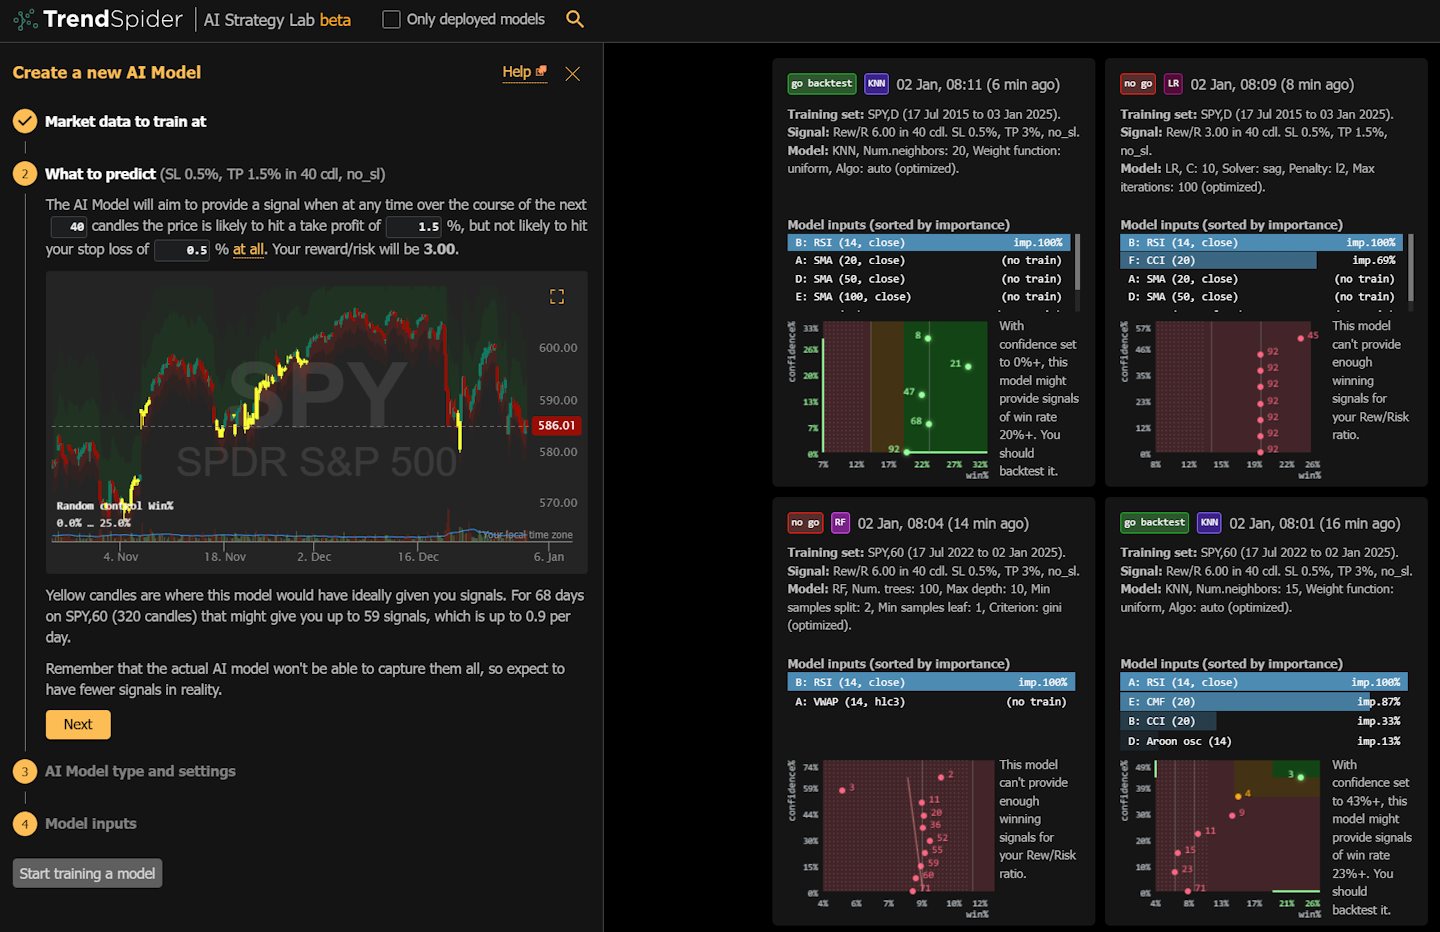
My Full Subscription to TrendSpider: TrendSpider gets a top score for Algo & AI, and is Leading the AI Trading Race
Testing: Screening for price, indicators, news, analyst ratings, seasonality, and insider activity using TrendSpider.
Benchmarking: Using TrendSpider’s AI pattern recognition for scanning and backtesting.
TrendSpider Testing Screenshot: My AI Trading Models. Top Marks for TrendSpider AI
We have focused on what is unique about Trendspider; it is designed for a specific purpose, taking the guesswork and painstaking hours of analysis away from traders. It is great for beginner and experienced traders who want to quickly find patterns and key levels.
The automated trendlines have been particularly useful in finding trade entry signals and key take-profit zones. The software is also great for backtesting strategies and accurately generates performance reports. Overall, our TrendSpider review shows that it has become a valuable tool that many traders use to succeed in the stock market.
3. TC2000: Easy to Use Charts & Screening
TC2000 is a great pick for beginners, offering excellent screening tools and trading features, all supported by top-notch customer service and live educational seminars across the USA.
My testing of TC2000 highlights its impressive real-time stock scanning, advanced charting, and customizable indicators, making it a powerful tool for US stock and options traders. It also offers seamless broker integration with TC2000 Brokerage and sophisticated technical analysis features, such as options strategy charting and trade execution.
However, TC2000 falls short in its backtesting capabilities and in the advanced AI trading features offered by platforms like TrendSpider and Trade Ideas. It lacks cutting-edge tools such as AI stock trading and pattern recognition, which provide traders with a significant advantage.
TC2000 is a great choice for beginner investors with a basic understanding of financial ratios and technical signals. TC2000 enables you to quickly create EasyScans to identify trading opportunities based on simple yet effective criteria.
TC2000 has long been one of my favorite tools. I have been a Platinum service subscriber for over 20 years. I started learning stock trading as a beginner with TC2000. TC2000 is an endlessly customizable and scalable platform that offers everything an investor in stocks, exchange-traded funds, and options would need.
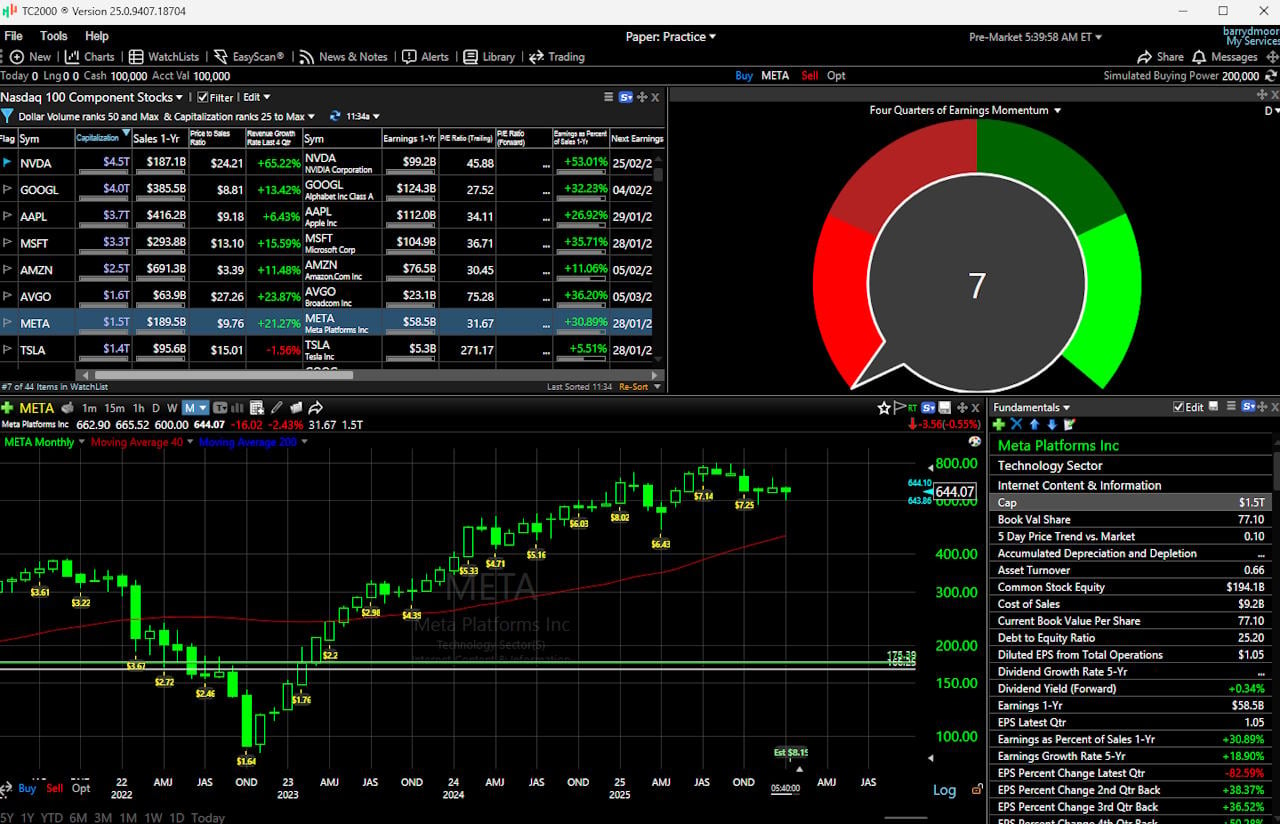
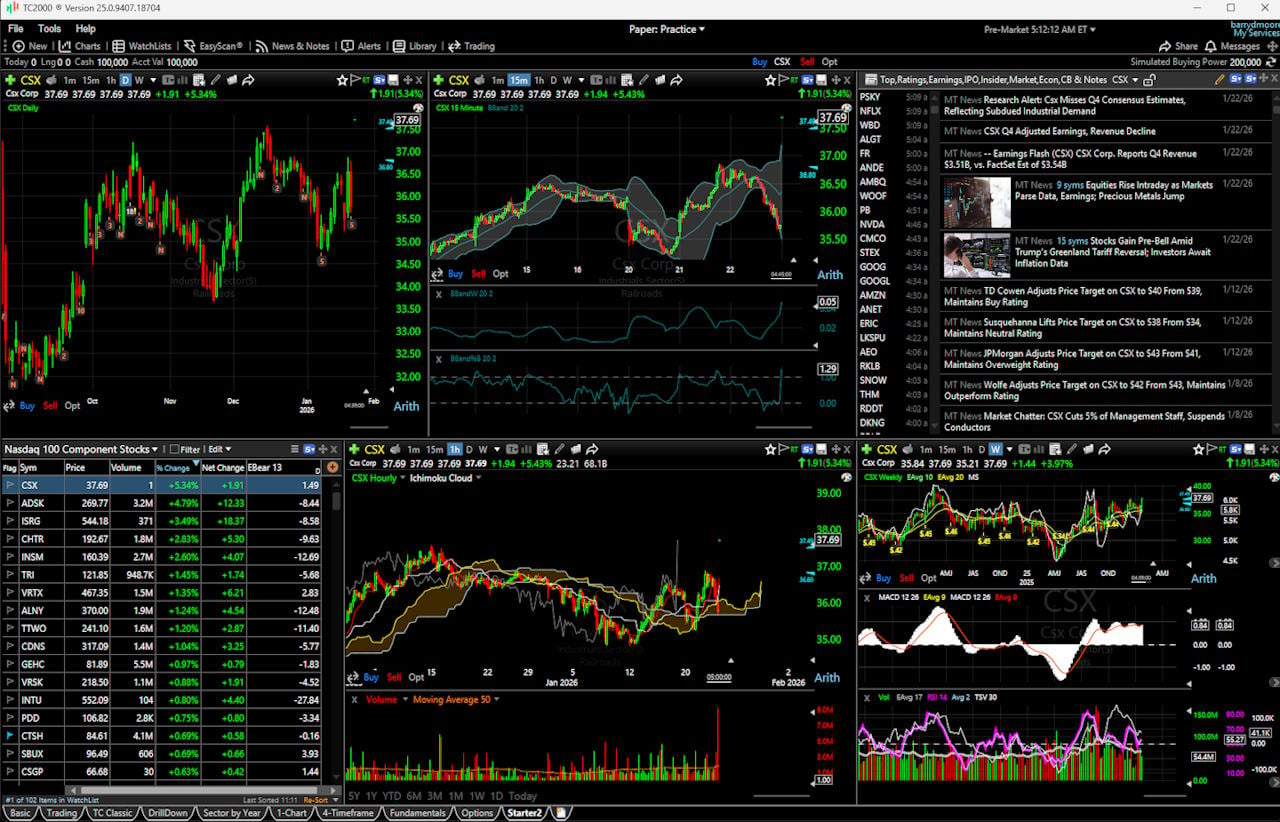
Testing TC2000 fundamental charts and real-time market gauges.
Testing TC2000 with multi-chart layouts and a newsfeed.
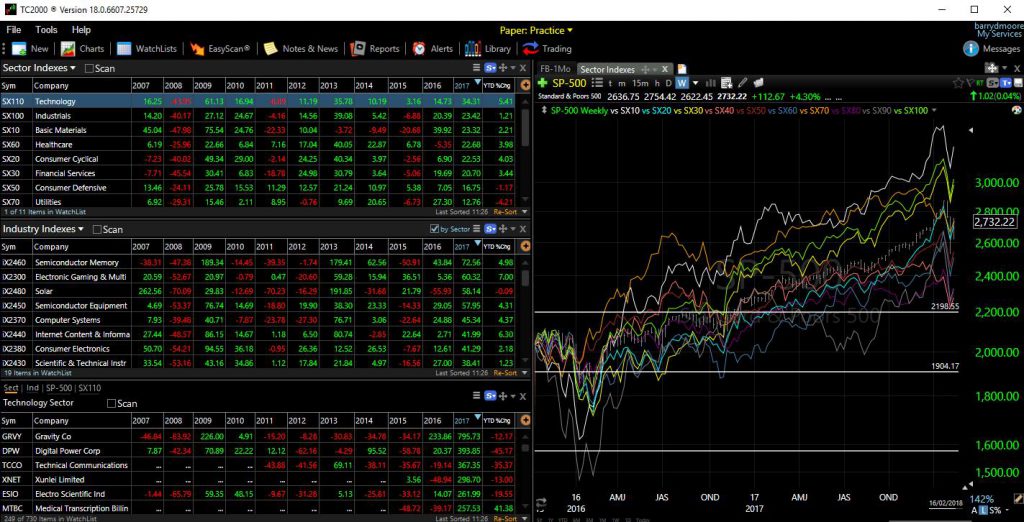
Testing TC2000’s Sector Analysis Workspace
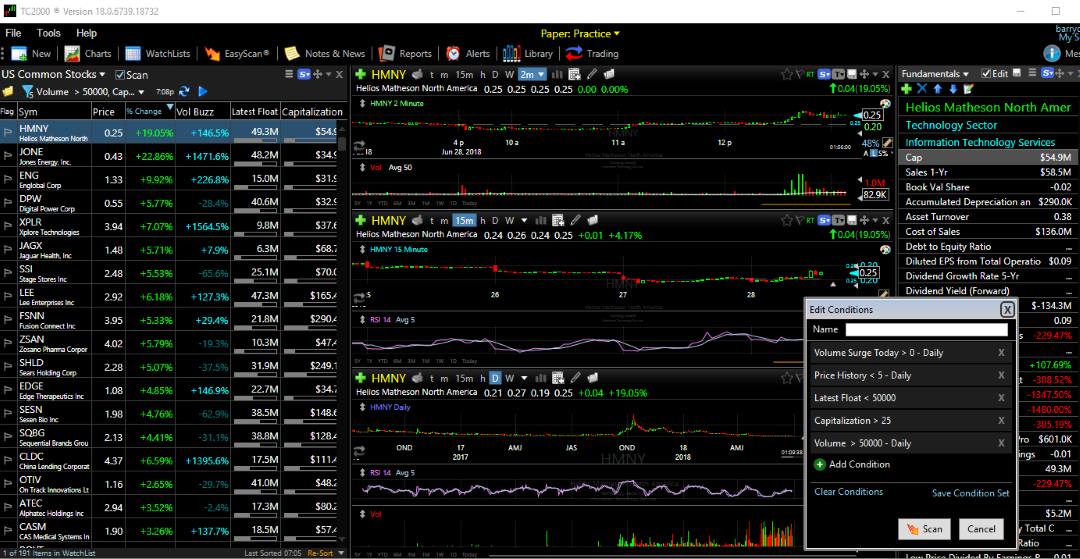
Testing Scanning. TC2000 Scanning is flexible, fast, and can be used with or without coding.
Exploring the endlessly customizable stock screening and watchlist management features in TC2000
Chart Depth Testing: Plotting Fundamentals on Charts with TC2000
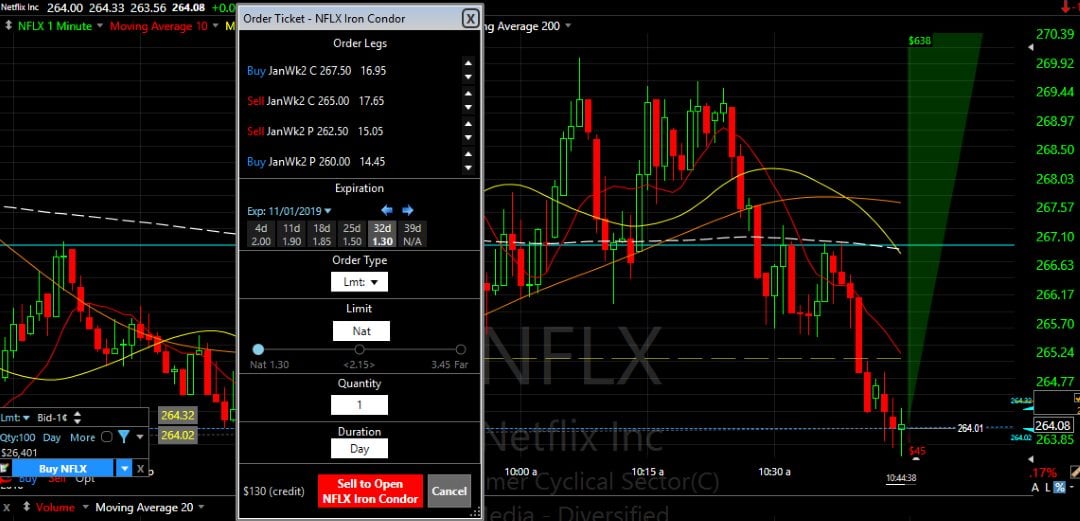
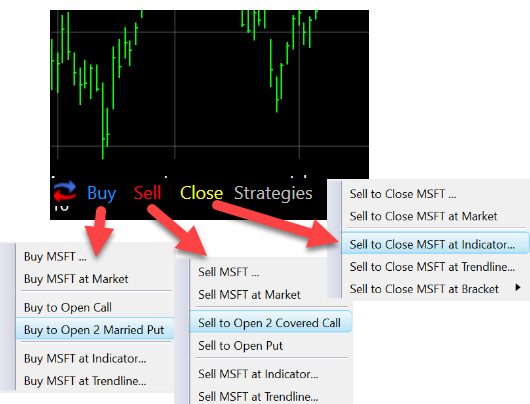
Opening Complex Options Trades in TC2000
Testing Trading: TC2000 is a clear leader in Options trading, with many advanced strategies built into the charts.
TC2000 Trading Platform For Beginners
I have been using TC2000 since 1999, and I can say the software is first-class and reliable. TC2000 runs natively on the PC. It is fast, responsive, and simple to use. The software’s resolution enables intricate design details that other development platforms cannot match. It downloads very quickly, and installation is a breeze.
TC2000 Support & Customer Service
Support is excellent on the forums, via email, or the phone. When you call, you will get straight through to skilled personnel in the US. I have never had an issue that was not resolved more or less immediately.
If you have not selected a Brokerage, consider TC2000 Brokerage; they offer competitive rates. This means you get full integration to trade stocks and options directly from your charts, a huge bonus.
This is a great solution if you trade U.S. Stocks, ETFs, or Mutual Funds. Worden also provides regular, high-quality live training seminars and tours the USA with free live training seminars for subscribers.
TC2000 Training & Education
The Worden Brothers in-house training team has hundreds of online video webinars available instantly. But even better than that, they seem to be on a more or less ongoing roadshow, with free live seminars across the United States. One of my students recently wrote to me about how great the training was and how much she learned. If you are based in the US or can travel, attending one of the scheduled seminars is well worth it.
Fundamental Scanning and Screening
Make no mistake: if you want fundamental stock screeners in real time, layered with technical screens integrated into live watch lists connected to your charts, TC2000 is a power player.
I selected TC2000 as my tool of choice back in 1999 because it offered the best implementation of fundamental scanning, filtering, and sorting on the market. Twenty years later, they are still a leader in this section.
EasyScan Fundamental & Technical Screener Dashboards
They offer 192 fundamentals to choose from, but even better, you can create custom indicators based on them with a few clicks.
You can then overlay the indicators directly on the charts, opening a new world of technical and fundamental analysis. Again, TC2000 gets 10 out of 10.
Technical Chart Analysis
TC2000 has an excellent array of technical indicators and drawing tools; all the big ones are there, from OBV, RSI, and Bollinger Bands to Fibonacci Fans and Andrews Pitchfork. With over 240 different indicators, you will have plenty to play with.
Here is a setup I use to find divergences in stock price and supply and demand volume; it is very reliable because it uses a mix of price, volume, and price/volume indicators.
Ease Of Use – Perfect For Beginner Traders
TC2000 is easy to use and yet very powerful. The interface design strikes the right balance between looking great and being instantly useful.
A heavy focus on watchlist management, flagging stocks, making notes, and powerful scanning makes it easy to use and master. The software setup takes only a few minutes and runs perfectly across devices.
Instant Usability.
If you want to run a quick test to see how easy TC2000 is to use, try the following.
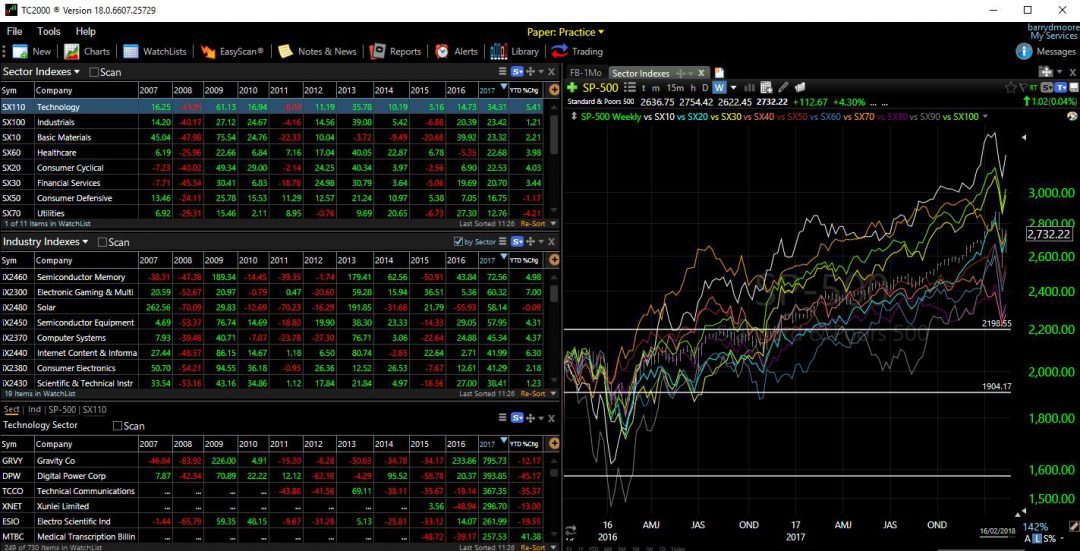
In 5 Clicks, you have this great industry-sector drill-down.
tc2000 Sector Analysis Drill Down
I have drilled down into the Technology sector in the chart above, and instantly we see the industry indexes: Semiconductor, Gaming, Solar, etc. What is nice is that we see to the right the sector’s relative performance versus the S&P 500.
Instantly, you can see which sectors outperform the market in 5 clicks.
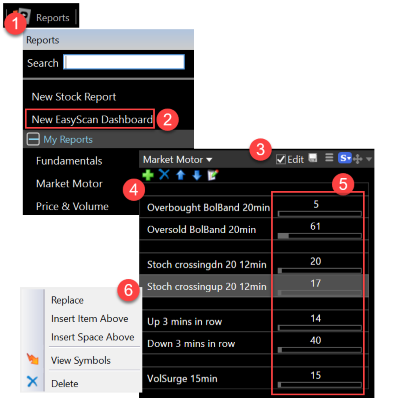
Easy Scan Dashboards
EasyScan Dashboards are reports that track multiple EasyScans at once. Counts are continuously updated to see stocks move between your scans, which is great for beginners to get a feel for the market.
Click the report button on the toolbar at the top of TC2000.
Click to create a new EasyScan Dashboard.
Click the checkbox to toggle edit mode on and off.
With edit mode turned on, click the + button to add your custom EasyScans to the dashboard.
Counts are updated in real-time (if you have real-time data).
Right-click on any scan to make edits or view the watchlist of passing stocks.
Summary – TC2000 Great For Beginners
I thoroughly enjoyed “growing up” as a trader with TC2000; it is a first-class platform with a team built on integrity, value for money, and cutting-edge technology that unleashes investing opportunities.
Finviz is a great choice for beginners because it provides lightning-fast free stock charting, screening, and stock chart pattern recognition. Finviz lets investors visualize vast stock market data with heatmaps and money flows on a single screen.
After hands-on testing, I found Finviz to be a powerful free stock screener, with swift market heatmaps and impressive stock chart pattern recognition.
Thanks to ongoing enhancements to its charting capabilities, Finviz remains a relevant and powerful tool in stock analysis. Through my testing, I found Finviz to be an exceptional free resource, offering intuitive heatmaps, speedy stock screening, and seamless chart pattern recognition.
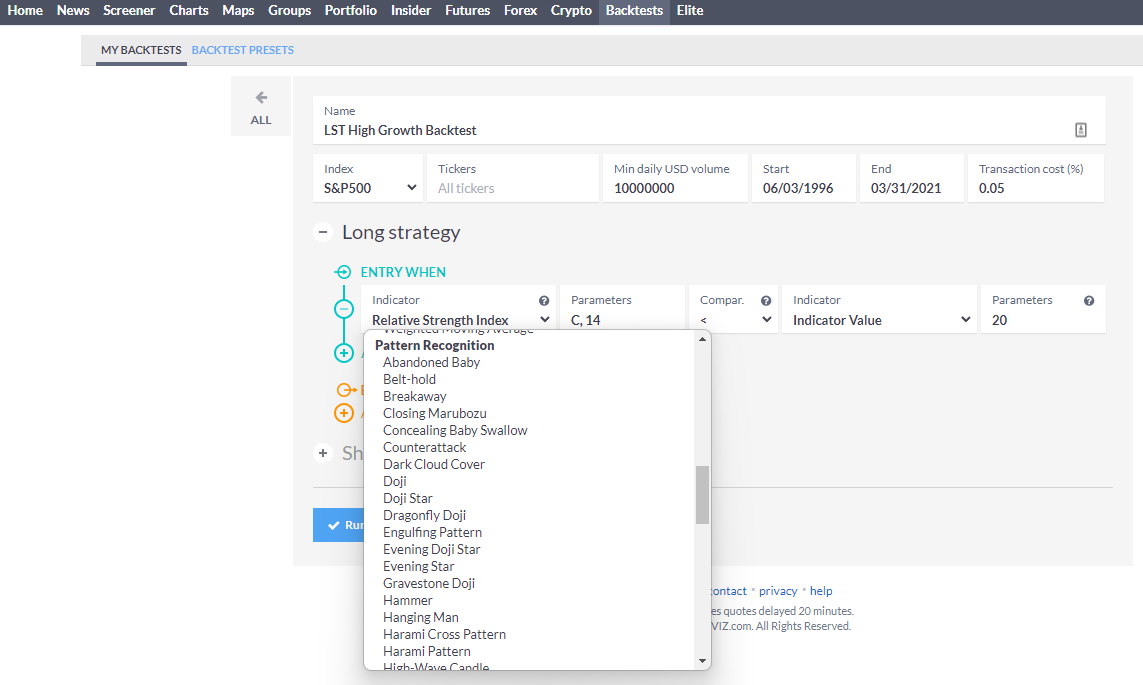
For those seeking more advanced features, Finviz Elite delivers value at $299 per year, providing real-time data and robust backtesting tools.
Finviz’s elite service provides real-time market data and enables up to 24 years of backtesting across multiple combinations of 102 technical indicators. Finviz is designed for individual investors, enabling them to screen for stocks, see which are on the move, and track their performance in real time.
Finviz is ideal for beginner investors because it is free, fast, and easy to use. Beneath the simplicity is a workhorse that displays an incredible amount of useful data, including news, insider trading, financials, and beautiful charts.
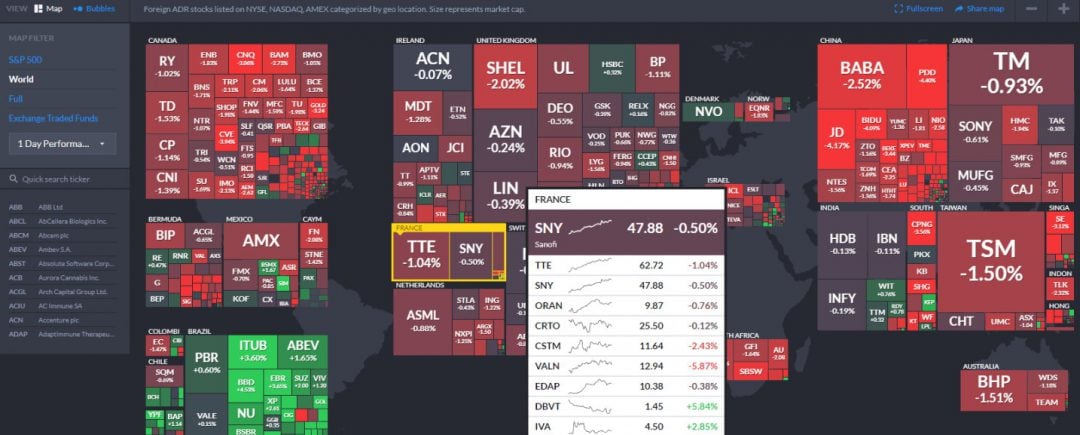
Finviz Heatmaps Are Great for Beginners
The Finviz heatmaps are the show’s star, providing a view of US or global stock markets. Finviz manages to cram the entire world’s moving stocks onto a single-page heatmap at lightning speed, which is impressive. Hovering your mouse over a ticker symbol shows the stock’s current performance, a mini line chart, and the company’s direct competitors.
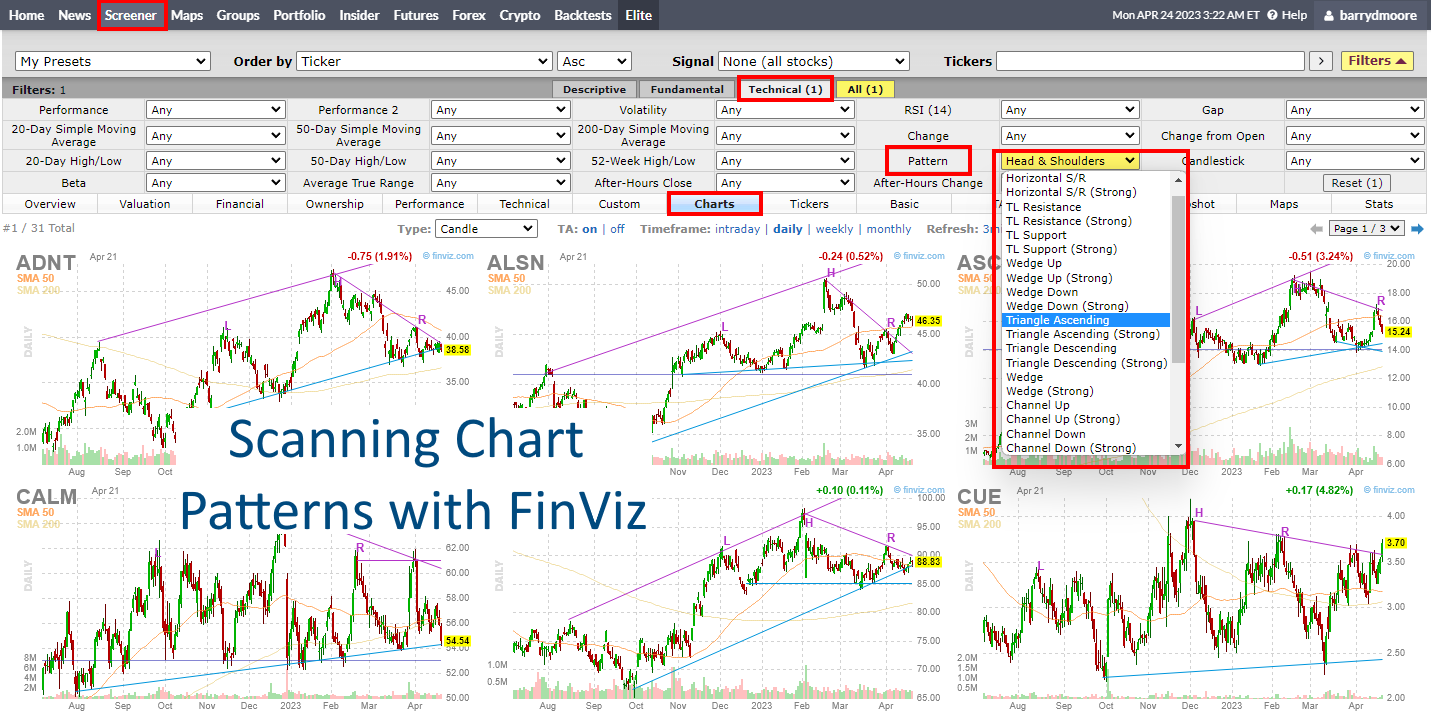
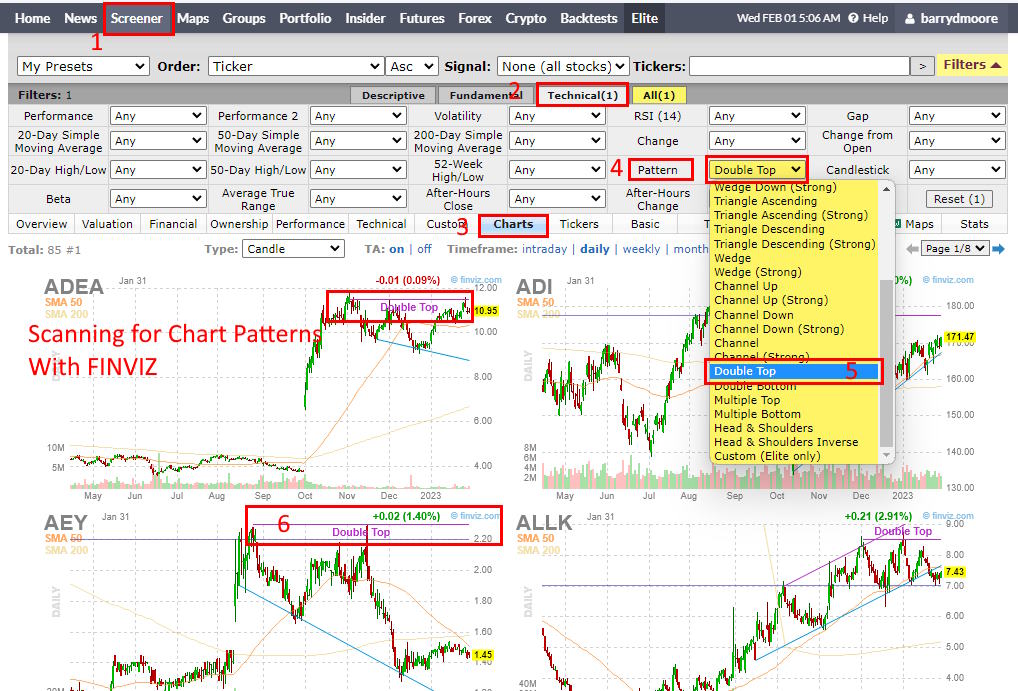
Scanning and Pattern Recognition with FinViz
Set Up Stock Chart Pattern Scanning with Finviz
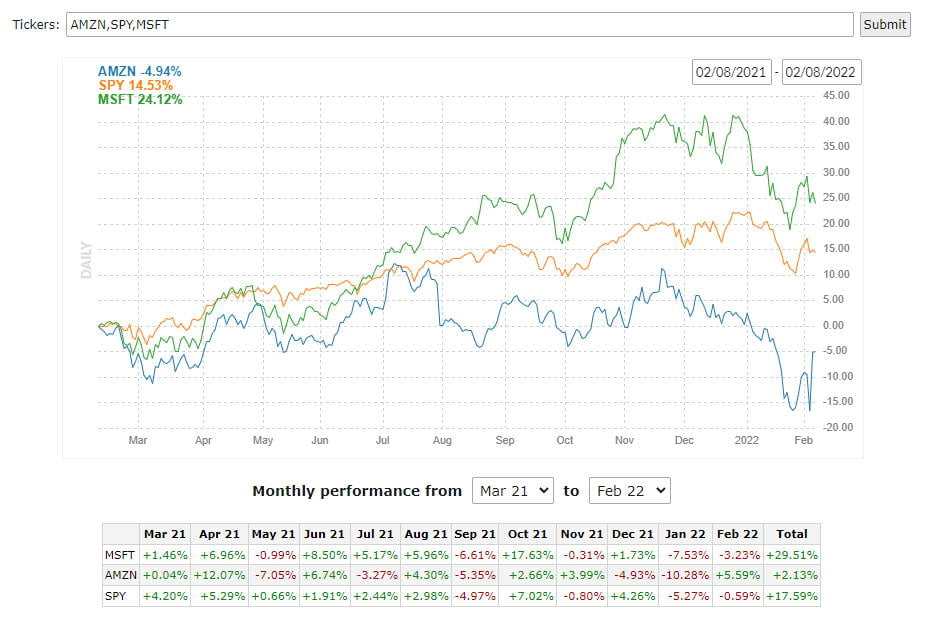
Finviz Review: Comparison Charts
Finviz Elite: Establishing a Backtest
Finviz Heatmaps: Excellent stock heatmaps that visualize the world’s exchanges, including pop-up mini-charts.
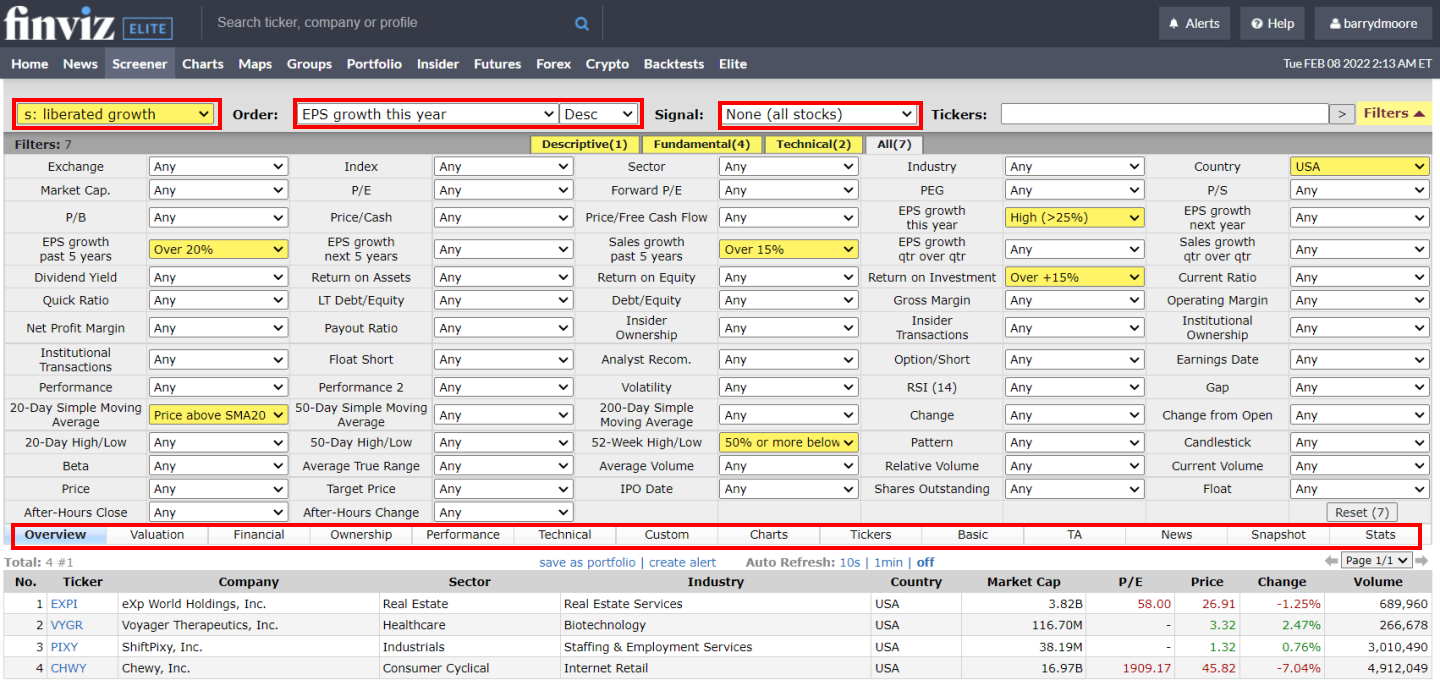
Finviz Review: Stock Screening with 67 Criteria
Viewing the Finviz stock heatmaps based on analyst recommendations reveals how biased institutional analysts are, with 70% of stocks flagged as positive.
Finviz allows you to visualize markets based on stock price performance, volume, P/E, PEG, Dividend Yield, Float, EPS, and even analyst recommendations. You can double-click a stock to jump directly to the company’s individual data and chart. The whole process is extremely fast and efficient.
Finviz Free Stock Charting
Looking at stock charts on Finviz is different from using other stock software. Whereas MetaStock and TradingView provide hundreds of fundamental technical analysis indicators, Finviz focuses on basic pattern recognition on daily charts and a small handful of overlays and indicators.
I like Finviz’s automatic trendline recognition and how it identifies price patterns such as wedges, triangles, double tops, and channels; this is a big advantage for pattern traders.
The free Finviz service is worth using, with excellent heatmaps, a free global stock-screening service, good news aggregation, and insider-trading information. What more do you expect for free? Our Finviz review shows it provides incredibly fast stock screening, heatmaps, and stock chart pattern recognition. If you want to visualize a large amount of stock data and find investments quickly, Finviz is definitely worth it.
If you want the best social community to learn to trade, your only choice is the TradingView platform. If you are a beginner trader who wants a simple yet powerful visual trading platform, then FinViz is the right choice. If you want AI algorithms to do the hard work for you, TrendSpider is the best. If you want great stock market screening and trading from charts, then choose TC2000.
FAQ
What is the best trading platform for beginners?
TradingView is our choice for the best trading platform for beginners because it has millions of active users sharing educational content, an easy-to-use interface, and the price starts at free. Plus TradingView will grow with you as your skills develop.
What features are important to look for in a beginner trading platform?
Beginner traders should look for an easy-to-use user interface, plenty of charting tools, a free plan, and a trading community to learn from. I use TradingView, and you can follow me for market analysis and educational content.
Are there any free trading platforms?
Yes, the best free trading platforms are TradingView, Finviz, Stock Rover, TC2000, and Yahoo. But if you're serious about trading, I recommend TradingView. It offers more features, tools, and educational content than any other platform. Plus, it has a free trial period, so you can ensure it meets your needs before committing to a subscription plan.
Is TradingView suitable for beginners?
Yes, TradingView is an excellent platform for beginner traders due to its easy-to-use visual interface and wide range of features, such as stock screening and technical analysis tools.
What is FinViz used for?
FinViz is a visual platform geared towards novice traders that offers sophisticated yet simple market analysis tools, charts, indicators, and alerts. It also has basic pattern recognition and backtesting in its Elite plan.
How can I use TrendSpider as a beginner trader?
TrendSpider offers automated AI-driven algorithms that can help you quickly analyze markets and make decisions based on data-driven insights. Beginner traders can use this to make quicker decisions without manually analyzing each trade opportunity.
Is TC2000 better than FinViz?
While both offer robust charting features, TC2000 shines with its advanced scanning capabilities. If you find yourself requiring simple data-driven insights, Finviz is the better-suited option.
With a wealth of experience spanning 25 years in stock investing and trading, Barry D. Moore (CFTe) is an author and Certified Financial Technician (Market Analyst) recognized by the International Federation of Technical Analysts (IFTA). Notably, he has also held executive positions in leading Silicon Valley corporations IBM Corp. and Hewlett Packard Inc.
2 COMMENTS
thank you John
Have never seen a better, more detailed, more logical, more useful review of investment services!
This website uses cookies to improve your experience while you navigate through the website. Out of these cookies, the cookies that are categorized as necessary are stored on your browser as they are essential for the working of basic functionalities of the website. We also use third-party cookies that help us analyze and understand how visitors use this website. These cookies will be stored in your browser only with your consent. You also have the option to opt-out of these cookies by leaving the website.
We do not use cross-site tracking cookies or advertising networks, just the basic analytics and session data.
Necessary cookies are absolutely essential for the website to function properly. This category only includes cookies that ensures basic functionalities and security features of the website. These cookies do not store any personal information.
Cookie
Type
Duration
Description
__stripe_mid
Persistent
1 month
This cookie is set by the Stripe payment gateway. This cookie is used to enable payment on the website without storing any payment information on a server.
__stripe_sid
Session
30 minutes
This cookie is set by the Stripe payment gateway. This cookie is used to enable payment on the website without storing any payment information on a server.
_ga
Analytics
2 years
This cookie is installed by Google Analytics. The cookie is used to calculate visitor, session, campaign data and keep track of site usage for the site's analytics report. The cookies store information anonymously and assign a randomly generated number to identify unique visitors.
_gat
Performance
1 minute
This cookie is installed by Google Universal Analytics to throttle the request rate to limit the collection of data on high traffic sites.
_gid
Analytics
1 day
This cookie is installed by Google Analytics. The cookie is used to store information of how visitors use a website and helps in creating an analytics report of how the wbsite is doing. The data collected including the number visitors, the source where they have come from, and the pages viisted in an anonymous form.
cookielawinfo-checkbox-non-necessary
Persistent
1 month
This cookie is set by GDPR Cookie Consent plugin. The cookie is used to store the user consent for the cookies.


thank you John
Have never seen a better, more detailed, more logical, more useful review of investment services!