My rigorous testing shows the best free stock screeners are Stock Rover, TradingView, and Finviz. For premium screening, TrendSpider, Stock Rover, and Trade Ideas are at the forefront.
My top-rated stock scanner is TrendSpider; its powerful real-time pattern recognition and backtesting are perfect for US traders. For financial screening, Stock Rover is ideal for long-term US dividend, value, and growth investors.
Top Ranked Stock Screeners
After comprehensive hands-on testing, I have identified the best stock screeners as Stock Rover 5.00, TrendSpider 4.67, and TradingView 4.83.
TradingView is the best stock scanner for trading global markets. Trade Ideas is the best AI-powered stock scanner for day traders, and Finviz is a fast, effective, free stock screener.
Screener Features Comparison
TrendSpider is our winner, combining AI-powered news, chart patterns, and indicator screening for US traders. Stock Rover is the best free and paid stock screener for US investors, with deep fundamentals, ratings, research reports, and portfolio management. Finally, TradingView is the perfect free screener for day traders covering all international markets.
| Features? | TrendSpider | Stock Rover | TradingView | Trade Ideas |
|---|---|---|---|---|
| Composite Lab Performance Score (CLPS) | AAA 4.72 | AA 4.37 | AAA 4.75 | AA 4.52 |
| Scanning Performance | AA 4.67 | AAA 5.00 | AAA 4.83 | B 3.88 |
| Best for: | Traders | Investors | Traders | Traders |
| Free Plan | ✘ | ✔ | ✔ | ✘ |
| Financial Screening? | ✔ | ✔ | ✔ | ✘ |
| 10-Year Financials | ✘ | ✔ | ✘ | ✘ |
| Portfolio Management? | ✘ | ✔ | ✘ | ✘ |
| Research Reports | ✘ | ✔ | ✘ | ✘ |
| Chart Pattern Scanning? | ✔ | ✘ | ✔ | ✔ |
| AI Stock Screening? | ✔ | ✘ | ✘ | ✔ |
| Candle Pattern Scanning | ✔ | ✘ | ✔ | ✔ |
| Indicator Scanning | ✔ | ✘ | ✔ | ✔ |
| Financial News? | ✔ | ✔ | ✔ | ✔ |
| News Scanning | ✔ | ✘ | ✘ | ✔ |
| Stocks & ETFs | ✔ | ✔ | ✔ | ✔ |
| FX/Commodity | ✔ | ✘ | ✔ | ✘ |
| USA & Canada | ✔ | ✔ | ✔ | ✔ |
| Global Market Data | ✘ | ✘ | ✔ | ✘ |
Scanning Performance
What We Measure: How fast and how deeply the platform can scan markets: latency across a large universe, criteria richness, auto-refresh capability, and whether custom-code scanning exists.
How it’s Calculated: Scanner speed is calculated using tiered points per millisecond. Criteria depth scores at 0.0125 points per criterion. Custom-code scanning is a 5-point capability flag; refresh rate is tracked.
Why it’s Important: Scanning is your opportunity engine. Faster scans with deeper criteria find setups earlier, reduce missed entries, and cut manual filtering time.
Metrics: Market Scanning Latency & Depth | Scanner Performance (ms) | Scanning Speed (ms) | Scanner Auto-Refresh Rate (seconds) | Scanning Criteria & Depth (Count) | Scanning Criteria & Depth (Points) | Custom Code Scanning
| Metric | Calculation | High | Median | Low |
|---|---|---|---|---|
| Market Scanning Latency & Depth | Average of Scanning Speed, Criteria & Custom Code Scores | 5.00 | 3.38 | 0.80 |
| Scanner Performance (ms) | Milliseconds to scan S&P 500 across 5 criteria | 2500 ms | 300 ms | 7 ms |
| Scanning Speed (ms) | Points (<100ms=5; <200=4.5; <500=4; <1000=3; <2000=2) | 5.00 | 4.00 | 1.00 |
| Scanner Auto-Refresh Rate (seconds) | Auto-refresh speed (not scored) | 60 s | 1 s | 0 s |
| Scanning Criteria & Depth | Total criteria count | 675 | 200 | 30 |
| Scanning Criteria & Depth | Points (0.0125 points per criteria) | 5.00 | 2.50 | 0.80 |
| Custom Code Scanning | Exists = 5 points | 5.00 | 5.00 | 0.00 |
| Scanning Performance Test Winners | Stock Rover 5.00 | TradingView 4.83 | TrendSpider 4.67 |
1. TrendSpider: Winner Best Overall Trading Scanner
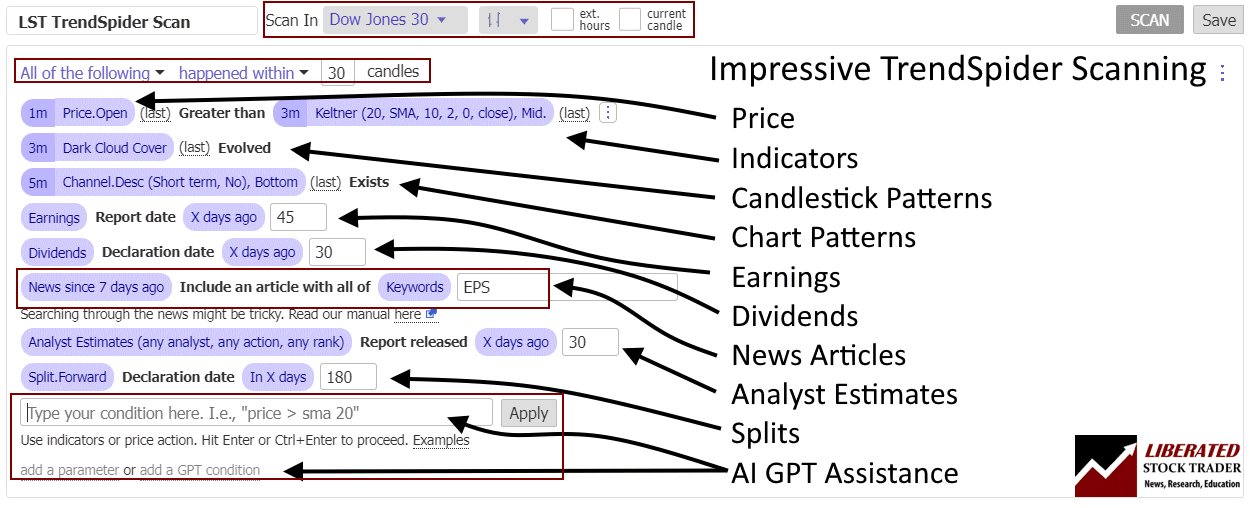
TrendSpider’s real-time multi-timeframe pattern and indicator scanning make it the best premium screener for US stock traders. Its innovation in AI-powered scanning of trendlines, patterns, candles, indicators, dark pools, block trades, and news makes it a worthy winner.
My research reveals that TrendSpider is an excellent choice for US traders seeking AI-driven tools for charting, pattern recognition, and backtesting across stocks, indices, futures, and currencies. The platform stands out by automatically detecting trendlines, Fibonacci levels, and candlestick patterns. With its robust backtesting capabilities and multi-timeframe analysis, TrendSpider is particularly well-suited for seasoned technical traders looking to refine their strategies.
| Test | Tier | Score | Average |
|---|---|---|---|
| Composite Lab Performance Score | AAA | 4.72 | 4.21 |
| Pricing Index: $ per Day | A | $2.70 | $2.74 |
| Value Score (VP) | A | 4.17 | 2.82 |
| Speed & Ease of Use | AA | 4.67 | 4.50 |
| Chart Analysis Depth Index | A | 4.03 | 3.17 |
| Chart Pattern Depth & Accuracy | AAA | 4.88 | 2.73 |
| Scanning Performance | AA | 4.67 | 3.38 |
| Backtesting Performance | AAA | 4.88 | 3.38 |
| Trading Bot & Auto-Trading Reliability | AA | 4.50 | 2.50 |
| AI & Algo Index | AAA | 5.00 | 2.00 |
| Alert Speed | AA | 4.33 | 3.67 |
| Trade Signal Quality | C | 0.00 | 0.00 |
| Broker Connectivity & Ecosystem Depth | AA | 4.43 | 1.55 |
| Portfolio Tool Performance | C | 2.10 | 2.80 |
| Financial News Speed & Depth | AA | 4.50 | 2.30 |
| Community Utility Index (CUI) | B | 3.75 | 3.25 |
| Support Infrastructure & SLA Audit | AA | 4.50 | 3.75 |
Tested using rating system V3.
See the 2026 v3 58-point TrendSpider test and benchmarking.
Pros
✔ 150+ chart and candle patterns recognized
✔ True AI Model Training & Deployment
✔ AAA Point-and-click backtesting
✔ Auto-trading bots
✔ Multi-timeframe analysis
✔ Real-time data included
✔ US Stocks, ETFs, Forex, Crypto, & Futures
✔ Seasonality charts, options flow
✔ News & analyst ratings change scanning
✔ 1-on-1 training included
Cons
✘ Not ideal for value or dividend investors
✘ No social community or copy-trading
✘ Limited portfolio management tools

TrendSpider stands out by leveraging AI and machine learning to streamline traders’ workflow, bringing automated trend and pattern recognition to the forefront. With TrendSpider, traders gain access to advanced analysis and strategy-testing capabilities, surpassing manual efforts in both scale and efficiency.
I am a partner and a subscriber to TrendSpider. I have completed thousands of screens and backtesting research using TrendSpider and can assure you this is the best screener and scanner for traders available today.
I have tested indicators, candlestick patterns, and stock chart patterns with TrendSpider. It is incredibly flexible, powerful, and, most of all, easy to use, as it requires zero coding. Yes, it is all point-and-click, which is great because I have only rudimentary scripting skills.
Save 38% to 45% on TrendSpider
Our Top Rated 4.72 ⭐ Trading Tool
✅ Leader in AI Trading & Chart Pattern Recognition
✅ Scanning & Auto-Trading
Deal Ends In:
| ⚡ Features ? | Charts, Watchlists, Screening, Free Real-time Data |
| 🏆 Unique Features ? | AI Automated Trendlines, Fibonacci, Candlestick Pattern Recognition, Auto-Bot Trading, Code-free Powerful Backtesting, Launch and Train Personal AI Models with Strategy Lab. |
| 🎯 Best for | Stock, Options, FX & Crypto Traders |
| ♲ Subscription | Monthly, Yearly |
| 💰 Price | $54 | $214 |
| 💻 OS | Web Browser |
| 🎮 Trial | ❌ |
| ✂ Discount | Code "LST30" for 30% to 63% Off |
| 🌎 Region | USA |
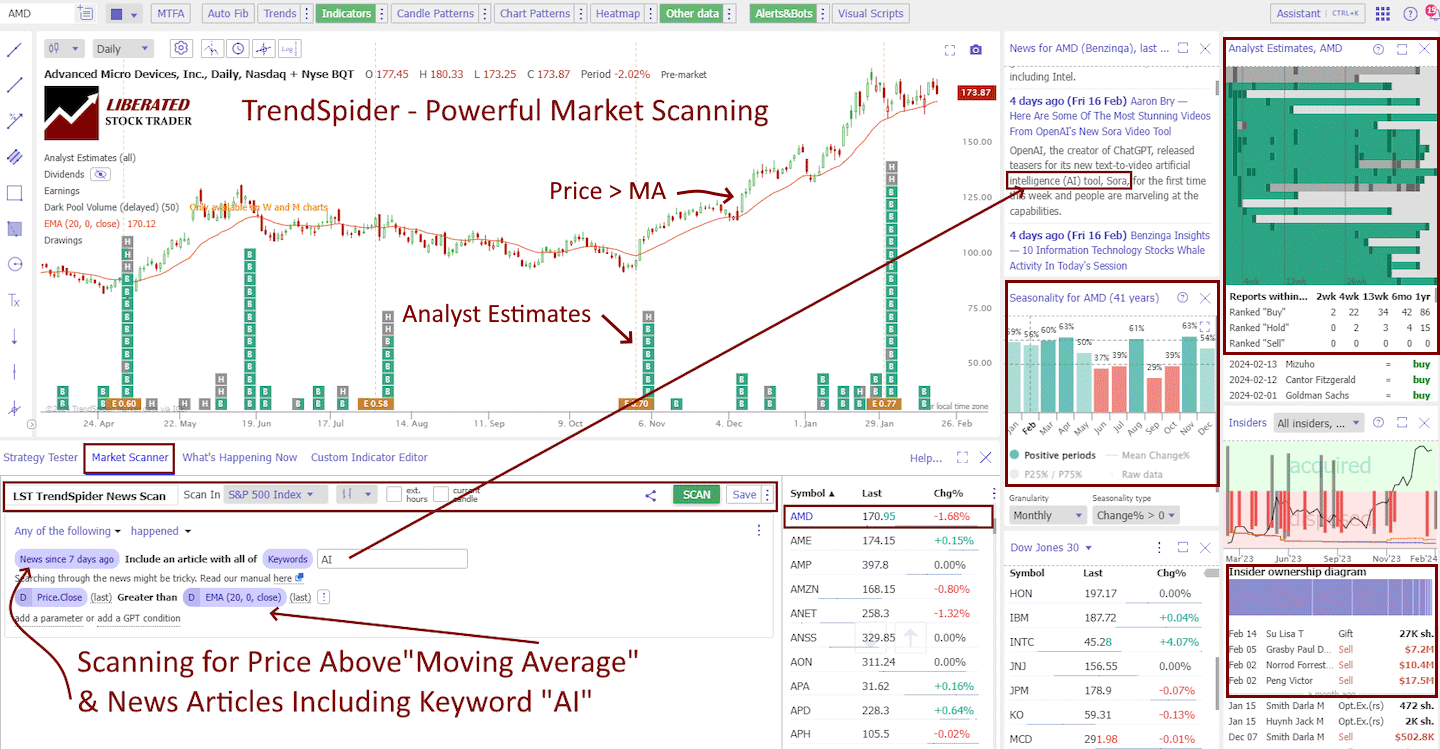
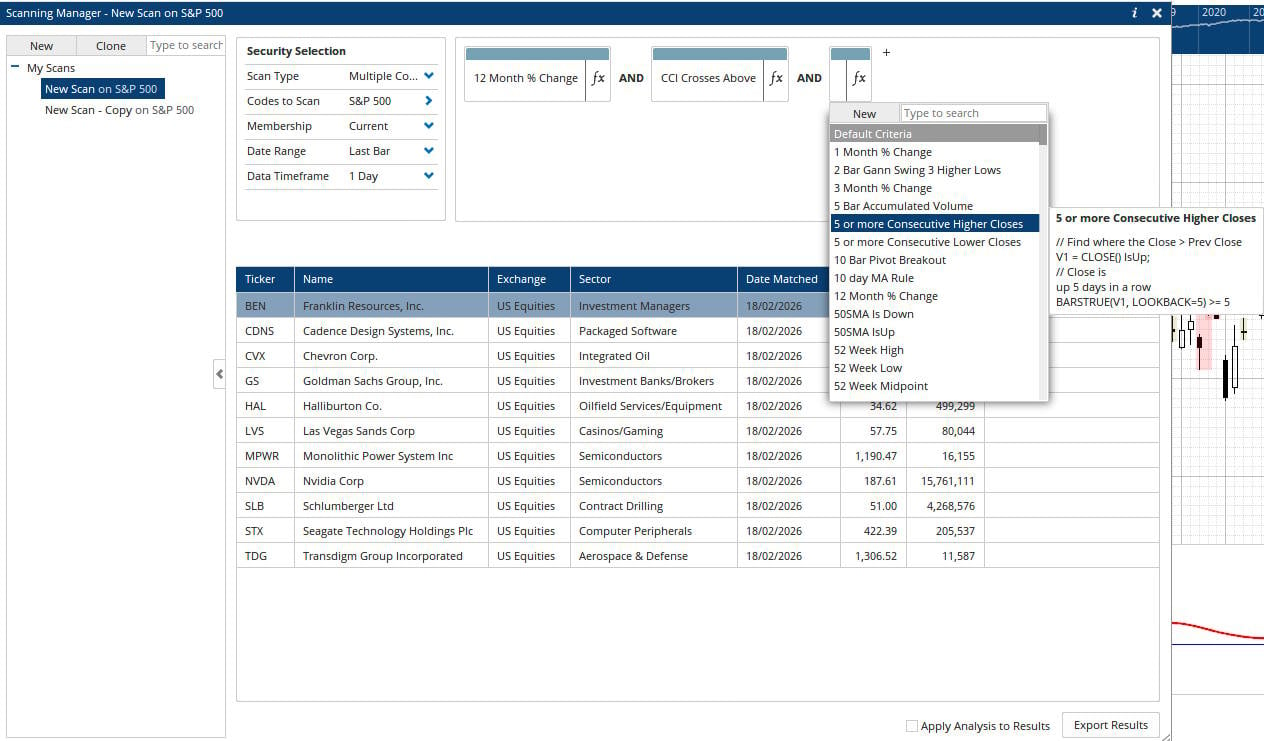
In the above screenshot, I have captured the key essentials to running a market scanner across the S&P 500, searching for stocks in an uptrend with a news announcement mentioning “AI.”
TrendSpider stands out as a leader in the industry due to its powerful multi-layer approach to screening financials, technicals, news, and analyst reports. It even includes data on dark pools and insider trading, which can all be overlayed on the chart.
The screenshot below further demonstrates why TrendSpider is our winner. It encompasses the important elements of the platform’s power and flexibility. You can screen for any criteria related to price, indicators, patterns, earnings, dividends, analyst estimates, and stock splits.
For example, you can scan for companies that release their earnings in the next seven days, where analysts expect a positive earnings surprise, and where the new reports mention “AI.”
The financial news scanning is also impressive. It allows you to scan for any article mentioning one or multiple keywords.
TrendSpider also includes an AI GPT Assistant, which enables you to freely type what you want to screen for in plain English. The assistant will then set up the screen or backtest for you.
For example, you could type “find me all stocks above the 20-day moving average with a positive RSI and analyst upgrades in the last 7- days.”
It also provides access to a wealth of diverse datasets, such as dark pools, r/wallstreetbets, short volume, retail trading, seasonality, and insider trading.
Read the TrendSpider Hands-On-Test
2. Stock Rover: Best Financial Screening for Investors
Stock Rover is the best free and paid stock screener for serious long-term US investors. It provides the largest database of company fundamental data, with 670 screening criteria, company ratings, analyst estimates, and a 10-year historical database of all US and Canadian stocks and ETFs.
My testing shows Stock Rover is best for long-term dividend, value, and growth investors. Its exceptional features are in-depth screening of a 10-year financial database, research reports, and broker-integrated portfolio management.
| Test | Tier | Score | Average |
|---|---|---|---|
| Lab Test Composite Score | AA | 4.37 | 4.19 |
| Pricing Index | AAA | $0.77 | $2.74 |
| Value Score (VP) | B | 3.63 | 2.82 |
| Speed & Ease of Use | AAA | 5.00 | 4.50 |
| Chart Analysis Depth Index | AA | 4.50 | 3.50 |
| Chart Pattern Depth & Accuracy | N/A | N/A | 2.73 |
| Scanning Performance | AAA | 5.00 | 4.50 |
| Backtesting Performance | A | 4.00 | 4.00 |
| Trading Bot & Auto-Trading Reliability | C | 2.50 | 1.50 |
| AI & Algo Index | C | 2.50 | 2.00 |
| Alert Speed | C | 2.67 | 1.50 |
| Trade Signal Quality | C | 2.50 | 0.00 |
| Broker Connectivity & Ecosystem Depth | C | 2.25 | 4.50 |
| Portfolio Tool Performance | AAA | 4.80 | 2.80 |
| Financial News Speed & Depth | C | 2.00 | 2.30 |
| Community Utility Index (CUI) | C | 2.75 | 4.00 |
| Support Infrastructure & SLA Audit | B | 3.50 | 3.50 |
Tested using benchmarking system v3.
See the 2026 v3 58-point Stock Rover test and benchmarks.
Pros
✔ 800+ Financial Screening Metrics
✔ Potent Stock Scoring Systems
✔ Unique 20-Year Historical Financial Data
✔ Warren Buffett Value Screeners & Portfolios
✔ All Important Financial Ratios
✔ Real-time Research Reports
✔ Portfolio Management & Rebalancing
✔ Broker Integration
✔ Winner: Best Value Investing Screener
Cons
✘ No Social Community
✘ Not for Traders
✘ No Cryptocurrency or Forex Data
✘ US Markets Only
Stock Rover is an industry-leading platform that enables the development of intricate dividend, value, and growth investing strategies.
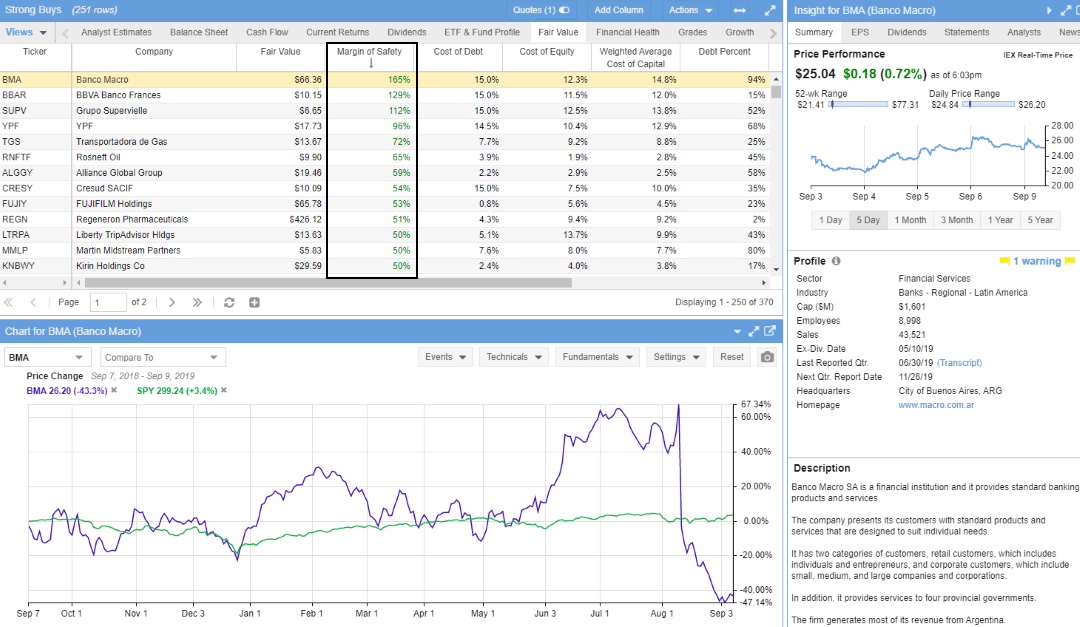
With Stock Rover, I have developed highly valuable strategies using its unique fair value, discounted cash flow, and margin-of-safety data. Its extensive growth investing data, such as performance versus the S&P 500 and industry growth and earnings rankings, make Stock Rover the best choice for serious investors.
Stock Rover’s key benefits include portfolio correlation and balancing, along with tools to screen for dividends, value, and growth stocks. With 10 years of historical data, you can backtest your criteria to see whether your scans would have been profitable in the past.
| ⚡ Stock Rover Features? | Charts, News, Watchlists, Broker Integration |
| 🏆 Exceptional Features? | Financial Screening, Portfolio Mgt & Rebalancing, 10-Year Database |
| 🎯 Best for | Growth, Dividend & Value Investors |
| ♲ Subscription | Monthly, Yearly |
| 🆓 Free | ✔ |
| 💰 Price | $0 | $29 | $49 |
| 💻 OS | Web Browser |
| 🎮 Trial | 14-Day |
| ✂ Discount Code | -25% During Premium Trial Period |
| 🌎 Region | USA |
I actively use Stock Rover daily to find the stocks that form the foundation of my long-term investments. It is my tool of choice, and I have even developed a Beat the Market Screener that is now integrated into Stock Rover.
Stock Rover is an easy-to-use stock screener that runs on PCs, Macs, Tablets, and Smartphones and requires zero installation. It simply works. Although Stock Rover is user-friendly, it is also the most advanced stock screener for financial analysis on the market. However, the market data, scoring, ranking, and analysis are only for the USA and Canadian markets.
Stock Rover has the best implementation of stock screening, research & portfolio management on the market today.
Stock Rover integrates with most major brokers, enabling it to manage profit and loss reporting, portfolio correlation, and rebalancing. It is a unique package that includes dividend reporting, forecasting, and scoring. Stock Rover is not for day traders but for longer-term investors who want to maximize portfolio income and take advantage of compounding and a margin of safety to build a secure portfolio.
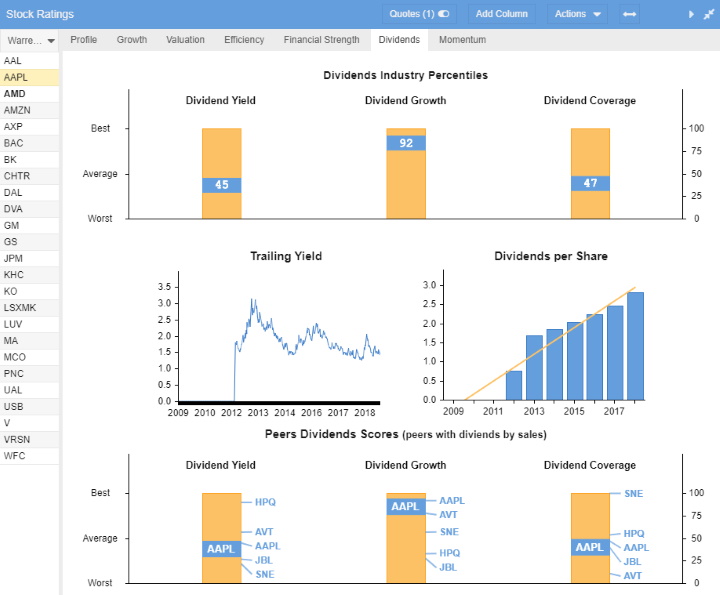
Stock Rover is the industry leader in stock screening, with 670 fundamental financial metrics; 226 of them include 10 years of historical data, allowing you to backtest your screening strategy. Watchlists have fundamentals broken into Analyst Estimates, Valuation, Dividends, Margin, Profitability, Overall Score, and Stock Rover Ratings. You can set the watchlist and filters to refresh every minute.
Stock Rover has over 150 pre-built screeners you can import and use. Many of these have been tested during this research and are thoughtfully built. To use the most powerful screeners, you will need the Premium Plus service.
Stock Rover is the best value investing stock screener because it has criteria no other software has, such as margin of safety, forward discounted cash flow, fair value, and the Greenblatt formulas. Using these calculations and metrics, a powerful Warren Buffett-style value stock screener is possible. A Buffettology screener built into Stock Rover incorporates the key criteria for Warren Buffett’s value investing methodology.
Stock Rover also has the best dividend stock screener, with many pre-built scans for dividend growth, yield, consistency, and ETF dividends. The broad dividend screening selection criteria include dividend coverage, cash flow, payout ratio, and dividend percentage growth. If you are screening for companies paying a consistent dividend, Stock Rover also allows you to scan for “Consecutive Dividend Growth Years.”
Stock Rover also provides intelligent dividend and income analysis, enabling you to compare company dividend yields, growth, and coverage and estimate future dividend income based on your portfolio or watchlist.
A new addition to the Stock Rover platform is the dynamic research reports. This brand-new service enables you to generate a professional, readable PDF report on any stock’s current and historical performance. Stock Rover calculates anomalies in a company’s financial reports and issues warnings to help lower your investing risk. Get a free premium Stock Rover research report.
Read the Stock Rover Test & Rating
3. TradingView: Powerful & Free Scanning
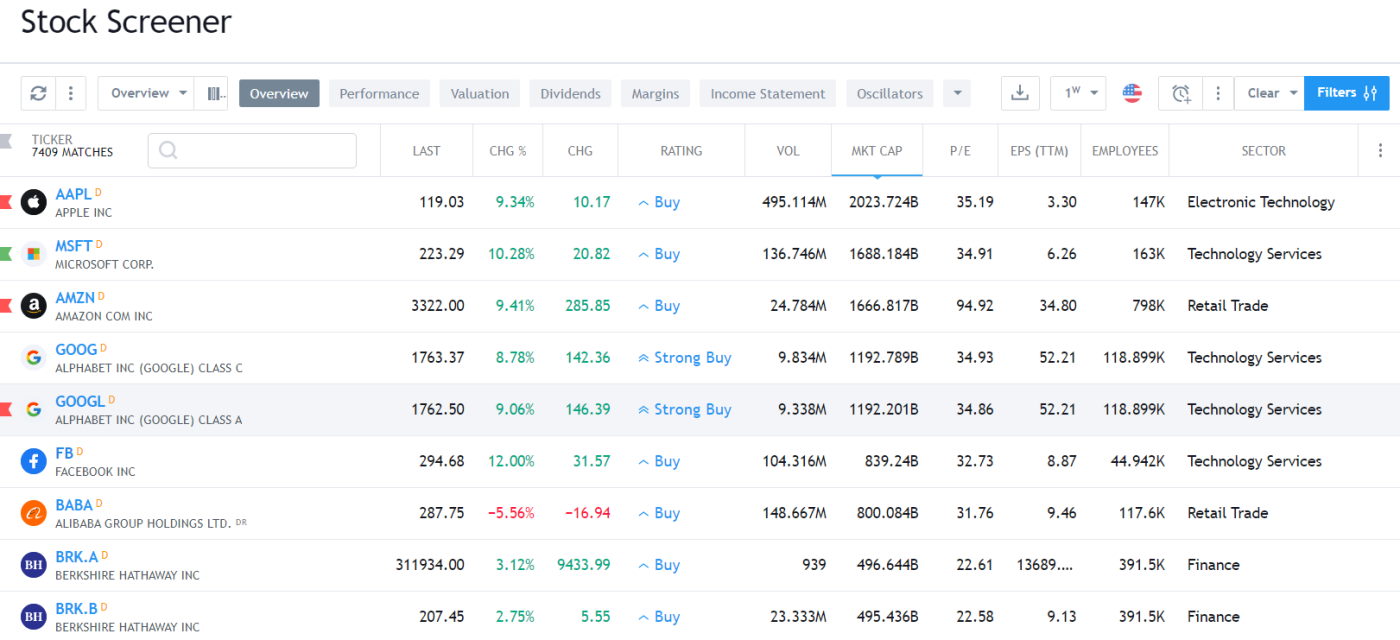
TradingView is the best free and paid stock screener for active traders because it combines powerful charts and screening for Stocks, ETFs, Indices, Forex, and cryptocurrencies across all international markets. TradingView enables backtesting of trading strategies and has the largest active global trading community.
TradingView is the world’s premier trading platform, trusted by over 20 million active traders. It offers a seamless blend of powerful charting tools, advanced screening features, and in-depth analysis, covering a wide range of assets, including stocks, indices, ETFs, and cryptocurrencies.
| Test | Tier | Score | Average |
|---|---|---|---|
| Composite Lab Performance Score | AAA | 4.75 | 4.21 |
| Pricing Index: $ per Day | AA | $1.97 | $2.74 |
| Value Score (VP) | AA | 4.37 | 2.82 |
| Speed & Ease of Use | AAA | 5.00 | 4.50 |
| Chart Analysis Depth Index | AAA | 5.00 | 3.17 |
| Chart Pattern Depth & Accuracy | B | 3.98 | 2.73 |
| Scanning Performance | AAA | 4.83 | 3.38 |
| Backtesting Performance | A | 4.19 | 3.38 |
| Trading Bot & Auto-Trading Reliability | B | 3.50 | 2.50 |
| AI & Algo Index | B | 3.00 | 2.00 |
| Alert Speed | AA | 4.67 | 3.67 |
| Trade Signal Quality | C | 2.50 | 0.00 |
| Broker Connectivity & Ecosystem Depth | AAA | 5.00 | 1.55 |
| Portfolio Tool Performance | B | 3.60 | 2.80 |
| Financial News Speed & Depth | B | 3.00 | 2.30 |
| Community Utility Index (CUI) | AAA | 5.00 | 3.25 |
| Support Infrastructure & SLA Audit | B | 3.25 | 3.75 |
Tested using benchmarking system v3.
See the 2026 v3 58-point TradingView test and benchmarks.
Pros
✔ 20 million users sharing ideas
✔ AAA Speed & ease of use
✔ Trading from charts
✔ Powerful screening and technical analysis
✔ All stock exchanges globally
✔ AAA Broker connectivity and asset coverage
✔ 100,000+ user-generated strategies
✔ Free and low-cost plans
✔ Flexible backtesting with Pine Script
Cons
✘ Not ideal for value or dividend investors
✘ Coding skills required for backtesting and custom indicators
✘ Average portfolio tools
TradingView provides best-in-class technical analysis tools to analyze financial markets. It offers heatmaps, super charts, indicators, strategy development tools, and backtesting capabilities.
Its vibrant community of traders shares ideas, strategies, and custom indicators, making it an invaluable resource for learning and collaboration.
| ⚡ TradingView Features ? | Charts, News, Watchlists, Screening, Chart Pattern & Candlestick Recognition, Full Broker Integration |
| 🏆 Unique Features ? | Trading, Backtesting, Community, Global Stock, FX & Crypto Markets, Webhook Bot Integration |
| 🎯 Best for | Stock, FX & Crypto Traders |
| ♲ Subscription | Monthly, Yearly |
| 💰 Price | $0 | $15 | $35 | $70 |
| 🆓 Free | ✔ |
| 💻 OS | Web Browser|PC|IOS|Android |
| 🎮 Trial | Yes, Free 30-Day Premium |
| ✂ Discount | -17% on yearly plan + $15 Discount |
| 🌎 Region | Global |
TradingView is one of the best stock market trading and charting platforms, with over 10 million active users sharing trading ideas and strategies in one big community. TradingView is a winner in our “Best Stock Analysis Software Review” and is now the best stock screener winner.
You can have TradingView for free, but the number of charts, alerts, and devices you can use is limited. I recommend the PRO+ plan at $19 per month, as the benefits include real-time data, market scanning, and a robust alerting system.
TradingView’s screening watchlists have fundamental data separated into Performance, Valuation, Dividends, Margin, Income Statement, and Balance Sheet. TradingView stands out with its vast selection of economic indicators, such as the Civilian Unemployment Rate versus the growth in Company Profits, that you can map and compare on a chart.
TradingView allows you to run a continuous live real-time stock screen that updates every 10 seconds. This is valuable for day traders scanning for volume spikes, changes in relative volume, or intra-day price spikes. The real-time stock screener covers pre-market gaps, volume, and major indicators such as RSI and Moving Averages.
The TradingView stock screener comes complete with 150 fundamental and technical screening criteria; all the usual measures are there, such as EPS, Quick Ratio, Pre-Tax Margin, and forward/trailing PE Ratio. TradingView also goes deeper with more esoteric criteria such as the number of employees, Goodwill, and Enterprise Value. Another positive is the screener implementation is very customizable; you can configure the columns and filters exactly how you wish.
TradingView’s unique ability to screen for chart patterns and setups for foreign exchange pairs makes it very valuable for day traders searching for volatility and using leverage. The Forex screener can compare performance and volatility together, which can help you narrow down the list of potential trades.
TradingView is extremely easy to use, low cost, and packed with screening power, including economic data. It is the right combination for active international day traders who value a social community.
Read the TradingView Test & Rating
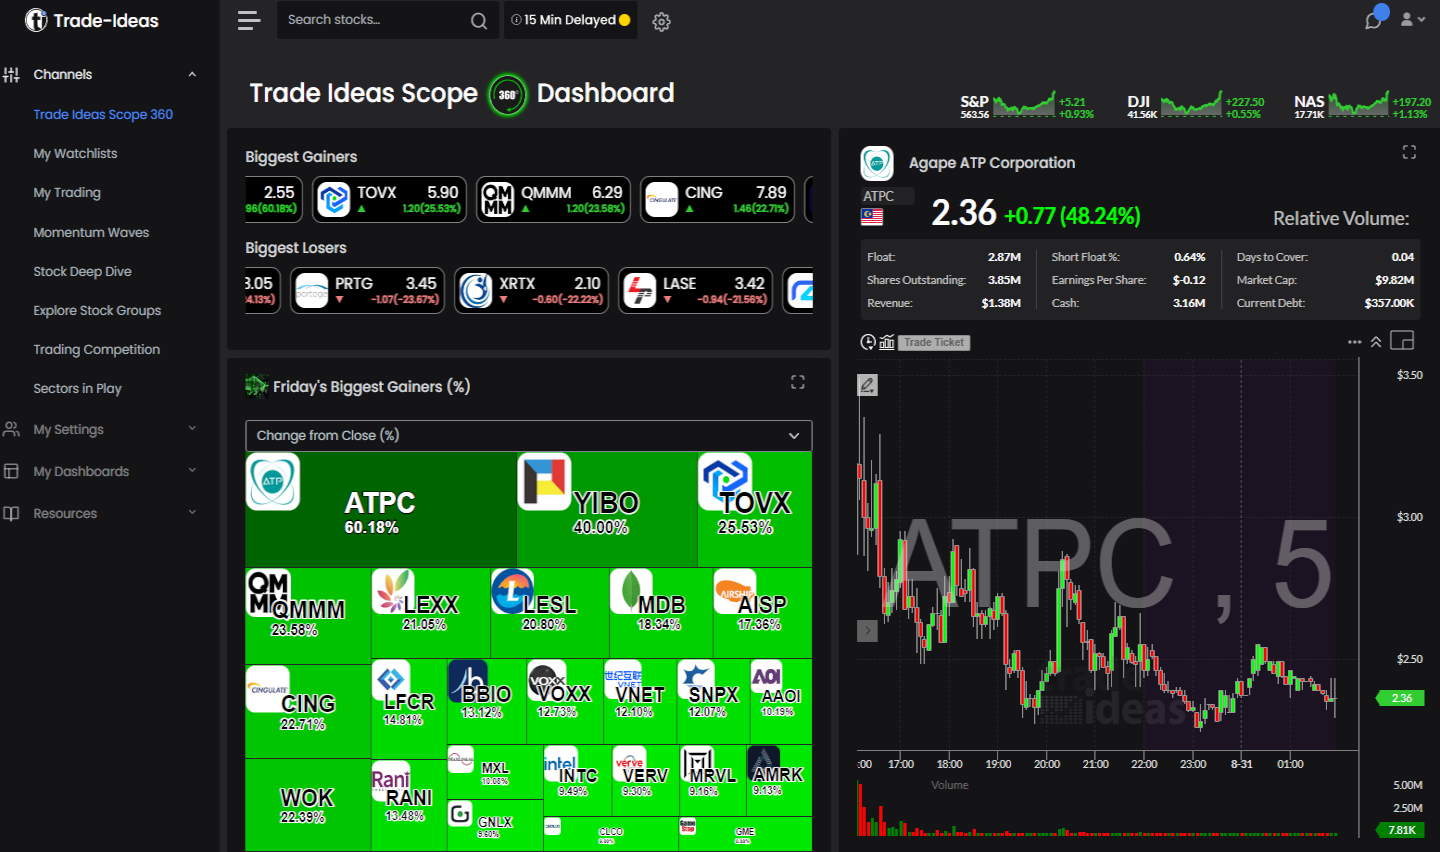
4. Trade Ideas: Best AI Day Trading Scanner
Trade Ideas is the best stock screener for day trading because it has three AI algorithms that provide signals for high-probability short-term trades. The backtesting, scanning, and trade success probabilities are all automated, meaning Trade Ideas can be used for automated day trading commission-free with eTrade.
My in-depth testing shows that Trade Ideas is the ultimate black-box, AI-powered day-trading signal platform with built-in automated bot trading. Three automated Holly AI systems pinpoint trading signals for day traders. Trade Ideas promises and delivers market-beating returns.
| Test | Tier | Score | Average |
|---|---|---|---|
| Lab Test Composite Score | AA | 4.52 | 4.21 |
| Pricing Index: $/day | A | $5.85 | $2.74 |
| Value Score (VP) | A | 4.03 | 2.82 |
| Speed & Ease of Use | AA | 4.50 | 4.50 |
| Chart Analysis Depth Index | C | 2.93 | 3.17 |
| Chart Pattern Depth & Accuracy | AA | 4.62 | 2.73 |
| Scanning Performance | B | 3.88 | 3.38 |
| Backtesting Performance | AA | 4.38 | 3.38 |
| Trading Bot & Auto-Trading Reliability | A | 4.00 | 2.50 |
| AI & Algo Index | AA | 4.50 | 2.00 |
| Alert Speed | A | 4.00 | 3.67 |
| Trade Signal Quality | AAA | 5.00 | 0.00 |
| Broker Connectivity & Ecosystem Depth | C | 2.40 | 1.55 |
| Portfolio Tool Performance | C | 2.10 | 2.80 |
| Financial News Speed & Depth | C | 1.00 | 2.30 |
| Community Utility Index (CUI) | AAA | 4.75 | 3.25 |
| Support Infrastructure & SLA Audit | AA | 4.50 | 3.75 |
Tested using rating system v3.
See the 2026 v3. 58-point Trade Ideas test and benchmarks.
Pros
✔ 3 AI Trading Algorithms That Beat the Market
✔ Get A Free Holly AI Stock Trade Every Week
✔ Fully Automated Backtesting
✔ Exceptional Stock Scanning
✔ Specific Audited Trade Signals
✔ Auto-trading & broker integration
✔ Auto Trade Commission Free with eTrade integration
✔ Free Live Trading Room
Cons
✘ Old School User Interface
✘ No Mobile App
Trade Ideas is best for active US day traders seeking real-time AI-driven high-probability trades, excellent stock scanning, and a live trading room to learn trading techniques.
Trade Ideas is worth it if you are a pattern day trader trading at least three times daily with an account value of over $25K as this will help you profit after paying the Trade Ideas subscription cost.
Save 30% on Trade Ideas Premium
Our 4.52 ⭐ Rated AI-Day Trading Tool
☆ 25% Off All Other Plans ☆
Deal Ends In:
| ⚡ Features ? | Charts, Watchlists, Screening |
| 🏆 Unique Features ? | AI Trade Signals, Trading Room, Trading Competitions |
| 🎯 Best for | US Day Traders |
| ♲ Subscription | Monthly, Yearly |
| 💰 Price | $89 | $178 |
| 🆓 Free Version | ✔ |
| 💻 OS | Web Browser, PC |
| 🎮 Trial | Free Live Trading Room |
| ✂ Discount | -15% Discount Code "LIBERATED" |
| 🌎 Region | USA |
Founded in 2003, Trade Ideas is a web & desktop-based software platform for finding day trading opportunities. Historically specializing in real-time scanning for trade opportunities, Trade Ideas now incorporates cutting-edge AI algorithms that backtest every stock in the USA & Canada for high-probability trading opportunities.
There are two tiers of product, Standard & Premium. Trade Ideas Standard costs $118 per month, or you can save $348 by going for an annual subscription costing $1068, a 25% discount. You get a live trading room, access to 40 market scans, and 500 price alerts for this price.
Trade Ideas Premium costs significantly more, at $228 per month, and enables the Holly Artificial Intelligence System. This system comprises three constantly evolving AI screening algorithms: entry and exit signals, trade risk assessments, and AI Auto-Trading.
Trade Ideas is the best AI stock screener because they have built an artificial intelligence algorithm called “Holly AI.” Holly applies 70 different strategies to all the stocks on the US stock exchanges; 70 strategies multiplied by 8,000+ stocks means millions of backtests daily. Only the strategies with the highest backtested win rate of over 60% and an estimated risk-reward ratio of 2:1 will be suggested as potential trades the following day.
The unique scanner system at the heart of the Trade Ideas platform gives you immediate access to over 40 trading scans. The in-built scans are categorized into Bullish, Bearish, or Neutral. Depending on the overall market direction, you can easily select a potential strategy for the day.
One scan I find particularly impressive and innovative is the “Unusual Social Mentions Scan.” The Trade Ideas AI engine constantly scans StockTwits for surges in mentions of particular stocks. If you click load settings, you will be immediately presented with a list of stocks spiking on social media. Of course, you can customize any of the scans featured here or create your alerts from scratch.
The AI algorithms developed by Trade Ideas are the main reason you want to sign up. I had a lengthy Zoom session with Sean Mclaughlin, Senior Strategist over at Trade Ideas, to delve into how its AI works, and I was very impressed. This company is laser-focused on providing traders with the best data-supported trading opportunities. There are currently three AI systems in operation.
As a partner of Trade Ideas, I requested a discount for all our readers. Use the discount code “Liberated” to get 15% off your first purchase, worth $340, when going for the premium service.
Read the Trade Ideas Test & Rating
5. Optuma: Pro Technical Analysis & Scanning
Optuma’s platform offers a full range of tools, featuring advanced charting and drawing functions, backtesting, and in-depth market analysis. Plus, our benchmarks reveal impressive scanning.
My Optuma testing reveals a comprehensive market analysis platform developed for professional technical analysts and retail investors. Optuma specializes in exotic charts such as Gann, Seasonality, and Relative Rotation. Its main customers are financial institutions, and it has the pricing and support team to match.
| Test | Tier | Score | Median |
|---|---|---|---|
| Composite Lab Performance Score (CLPS) | AA | 4.32 | 4.21 |
| Pricing & Value Index | A | $4.03/day | $2.74/day |
| Value Score (VP) | C | 2.52 | 2.82 |
| Speed & Ease of Use | AAA | 4.83 | 4.50 |
| Chart Analysis Depth Index | AAA | 5.00 | 3.17 |
| Chart Pattern Depth & Accuracy | B | 3.65 | 2.73 |
| Scanning Performance | A | 4.05 | 3.38 |
| Backtesting Performance | AAA | 4.94 | 3.38 |
| Trading Bot & Auto-Trading Reliability | C | 2.50 | 2.50 |
| AI & Algo Index | C | 2.00 | 2.00 |
| Alert Speed | B | 3.00 | 3.67 |
| Trade Signal Quality | C | 0.00 | 0.00 |
| Broker Connectivity & Ecosystem Depth | C | 1.67 | 2.00 |
| Portfolio Tool Performance | C | 2.00 | 2.80 |
| Financial News Speed & Depth | C | 2.30 | 2.80 |
| Community Utility Index (CUI) | C | 1.75 | 3.25 |
| Support Infrastructure & SLA Audit | A | 4.00 | 3.75 |
Tested using rating system v3.
See the 2026 v3 58-point Optuma test and benchmarking.
Pros
✔ Great Technical Analysis Charts
✔ Gann Charts & Seasonality Charts
✔ Fast In-Depth Scanning
✔ Speed & Ease of Use
✔ High-Quality Quant Backtesting
✔ Point & Figure Charts
✔ Market Profile Charts
✔ Good Customer Satisfaction
✔ Professional Enterprise Services
Cons
✘ Additional Datafeed Required
✘ Broker Integration
✘ No Social
✘ No Integrated News Feeds

One key feature that sets Optuma apart from competitors is its proprietary scripting language, the Optuma Script Language (OSL). This powerful tool allows users to create customized indicators and trading strategies to fit their specific needs. This level of customization gives traders a competitive edge in the market.
Scanning Performance
Optuma’s scanning score (4.05) is above median and built on the right foundation: solid speed (248 ms), meaningful criteria depth (252), and perfect custom code scanning (5.00). This combination matters because scanning is only as valuable as its expressiveness.
Many tools are fast but shallow; Optuma is fast enough while also allowing advanced logic. The result is a platform that supports serious scan-driven workflows where you continuously refine logic, validate results, and build repeatable filters.
| Metric | Calculation | Optuma | High | Median | Low |
|---|---|---|---|---|---|
| Scanning Performance | Avg(Speed + Criteria + Custom Code) | 4.05 | 5.00 | 3.38 | 0.80 |
| Scanner Performance (ms) | S&P 500 scan across 5 criteria | 248 | 2500 | 300 | 7 |
| Scanning Speed Points | ms → points rubric | 4.00 | 5.00 | 4.00 | 1.00 |
| Auto-Refresh (sec) | Not scored | 10 | 60 | 1 | 0 |
| Total Criteria Count | Total scan criteria | 252 | 675 | 200 | 30 |
| Criteria Depth Points | 0.0125 points per criterion | 3.15 | 5.00 | 2.50 | 0.38 |
| Custom Code Scanning | Exists = 5 points | 5.00 | 5.00 | 5.00 | 0.00 |
| Scanning Performance Test Winners | Stock Rover 5.00 | TradingView 4.83 | TrendSpider 4.67 |
In Optuma, scanning is typically part of a pipeline: define criteria → scan → shortlist → validate on charts → test in backtester. The perfect score for custom code scanning confirms the platform supports this “research loop” rather than treating scanning as a simple menu filter. If you’re building specialized screeners (multi-condition logic, indicator states, pattern constraints), Optuma supports the complexity required to make scanning produce genuinely actionable lists—especially when paired with its backtesting and chart depth modules.
6. TC2000: Best Options Screener App.
TC2000 specializes in real-time stock and options screening for the US stock, ETF, and options markets. The TC2000 EasyScan system enables quick implementation of powerful screening conditions and custom indicators and is the only software with screening available in the Mobile App.
My testing of TC2000 highlights its impressive real-time stock scanning, advanced charting, and customizable indicators, making it a powerful tool for US stock and options traders. It also offers seamless broker integration with TC2000 Brokerage and sophisticated technical analysis features, such as options strategy charting and trade execution.
| Test | Tier | Score | Average |
|---|---|---|---|
| Lab Test Composite Score | AA | 4.30 | 4.21 |
| Pricing Index $/day | AA | $2.74 | $2.74 |
| Value Score (VP) | B | 3.39 | 2.82 |
| Speed & Ease of Use | AAA | 4.83 | 4.50 |
| Chart Analysis Depth Index | B | 3.78 | 3.17 |
| Chart Pattern Depth & Accuracy | C | 2.58 | 2.73 |
| Scanning Performance | AA | 4.32 | 3.38 |
| Backtesting Performance | C | 0.00 | 3.38 |
| Trading Bot & Auto-Trading Reliability | B | 3.00 | 2.50 |
| AI & Algo Index | C | 1.50 | 2.00 |
| Alert Speed | A | 4.00 | 3.67 |
| Trade Signal Quality | C | 0.00 | 0.00 |
| Broker Connectivity & Ecosystem Depth | C | 2.73 | 2.00 |
| Portfolio Tool Performance | C | 2.90 | 2.80 |
| Financial News Speed & Depth | B | 3.50 | 2.30 |
| Community Utility Index (CUI) | B | 3.50 | 3.25 |
| Support Infrastructure & SLA Audit | AAA | 5.00 | 3.75 |
Tested using rating system v3.
See the 2026 v3 58-point TC2000 test and benchmarking.
Pros
✔ Excellent US Customer Support
✔ Trade Stocks & Options From Charts
✔ Broad Selection of Charts & Indicators
✔ Options Strategies & Live Trading
✔ Real-time Entire Market Scanning
✔ Great Usability & Simple Setup
✔ AAA Support & SLA
✔ Free for TC2000 Brokerage Users
Cons
✘ Limited Social Community
✘ Limited Pattern Recognition
✘ No Backtesting
✘ $1 per trade with TC2000 Brokerage
✘ No AI Trading Features
However, TC2000 falls short in its backtesting capabilities and in the advanced AI trading features offered by platforms like TrendSpider and Trade Ideas. It lacks cutting-edge tools such as AI stock trading and pattern recognition, which provide traders with a significant advantage.
If you want fundamentals screened in real-time layered with technical screens integrated into live watchlists connected to your charts, TC2000 is a good option.
In 2000, I selected TC2000 as my tool of choice because it offered the best implementation of fundamental scanning, filtering, and sorting available on the market. Twenty years later, they are still a stock screening and scanning leader.
TC2000 offers a large selection of fundamentals, but what makes it unique is that you can, with a few clicks, create your indicators based on the fundamentals. You can then overlay the indicators directly on the charts, opening up a new world of technical and fundamental analysis.
Out of all the software we tested, TC2000 has the best mobile app for stock screening. The “TC2000 Easy Scan Stock Scanner” is built directly into the main screen, and you can start a scan simply by selecting the lightning symbol. TC2000 is unique in its ability to run live and pre-market scans directly from your mobile device.
TC2000 allows you to run screening and scanning on pre-market data. When you open the desktop software before market hours, the app asks if you want to load all pre-market data; this allows you to perform advanced screening before the market opens.
TC2000 is the best-integrated stock market software. You can effortlessly glide from effective screening on a broad array of fundamental & technical screens to managing your watchlist and directly trading with the TC2000 Brokerage. The Options screening and on-screen options execution are second to none, leading the industry.
The only downside to TC2000 is that it is only available for those who trade in the US and Canadian stock markets. TC2000 is well suited to Day Traders because its scanning is real-time, and you can trade directly from the charts if you use TC2000 Brokerage.
7. MetaStock: Best Global Chart Scanner.
MetaStock is a leading global stock chart scanner because it combines powerful backtesting strategies with over 350 indicators and charting tools. MetaStock’s marketplace has over 100 stock scanning strategies for finding trading opportunities across international stock markets.
My MetaStock testing highlights it as a robust trading platform. It offers over 300 charts and indicators for global markets, including stocks, ETFs, bonds, and Forex. MetaStock R/T excels with its advanced backtesting and forecasting features, alongside real-time news updates and efficient screening tools.
| Test | Tier | Score | Average |
|---|---|---|---|
| Lab Test Composite Score | AA | 4.42 | 4.21 |
| Pricing Index: $/day | A | $8.71 | $2.74 |
| Value Score (VP) | B | 3.26 | 2.82 |
| Speed & Ease of Use | B | 3.33 | 4.50 |
| Chart Analysis Depth Index | AAA | 4.83 | 3.17 |
| Chart Pattern Depth & Accuracy | B | 3.70 | 2.73 |
| Scanning Performance | B | 3.71 | 3.38 |
| Backtesting Performance | AAA | 4.81 | 3.38 |
| Trading Bot & Auto-Trading Reliability | C | 2.50 | 2.50 |
| AI & Algo Index | C | 2.50 | 2.00 |
| Alert Speed | B | 3.67 | 3.67 |
| Trade Signal Quality | C | 2.50 | 0.00 |
| Broker Connectivity & Ecosystem Depth | C | 1.67 | 2.00 |
| Portfolio Tool Performance | C | 2.60 | 2.80 |
| Financial News Speed & Depth | AAA | 5.00 | 2.30 |
| Community Utility Index (CUI) | B | 3.25 | 3.25 |
| Support Infrastructure & SLA Audit | A | 4.00 | 3.75 |
Tested using benchmarking system v3.
See the 2026 v3 58-point MetaStock test and benchmarks.
Pros
✔ Great Selection of Automated Expert Advisors
✔ Excellent Deep Backtesting
✔ Unique Stock Price Forecasting
✔ Large Library of Add-on Professional Strategies
✔ AAA Charts & Indicators
✔ AAA Institutional Real-Time News
✔ Xenith Add-On Rivals Bloomberg Terminals
✔ Works Online & Offline
Cons
✘ Takes Time To Learn
✘ Old School Windows App Design
✘ Too Many Add-ons
MetaStock is best for traders who need excellent real-time news, exceptional technical analysis, a vast stock systems marketplace with global data coverage, and excellent customer service.
However, the full Metastock suite costs $ 265 per month. It rivals the Bloomberg terminal in functionality but lacks the new AI trading features of TrendSpider and Trade Ideas, such as AI Bot trading and advanced pattern recognition.
| ⚡ Features? | Charts, Watchlists, Scanning, Backtesting |
| 🏆 Unique Features? | Algorithmic AI Forecasting, Real-time Global Trading News (Multi-language), Pattern Recognition with Add-ons. |
| 🎯 Best for | Stock, FX & Commodity Traders |
| ♲ Subscription | Monthly, Yearly |
| 💰 Price | $100 | $265 |
| 💻 OS | PC |
| ✂ Discount | 3 for 1 Deal Worth $530 |
| 🌎 Region | Global |
MetaStock is a leader in forecasting and technical chart analysis. If you purchase MetaStock R/T (real-time), you essentially get the Refinitiv add-on; this adds Real-time news (from Reuters) and Bloomberg-level fundamental and technical screening.
MetaStock’s Refinitiv integration means you get institutional quality real-time news, analysis, research, and economic outlooks, plus the fastest global news service available in the industry. For international investors, MetaStock is unique because the news is also translated into all major languages.
MetaStock has an incredible database of fundamental global data for screening, not just on companies but economies and industries; the wealth of data is first-class. Using Refinitiv, you can see an in-depth analysis of company fundamentals, from debt structure to the top 10 investors, including level II; combine that with excellent watch lists featuring fundamentals and powerful scanning of the markets.
MetaStock provides scanning on any stock exchange globally, providing you have the market data package for the region. Screening all trading instruments, including ETFs, Funds, Options, and Forex, is possible. Powered by Refinitiv, extensive analyst ratings and 79 core fundamental financial criteria are selectable. In total, 269 technical criteria are available for scanning.
MetaStock is not free software; you will pay $250 monthly for powerful scanning. For that investment, you will get the fastest real-time streaming news, industry-leading technical analysis, backtesting, and forecasting.
An alternative for day traders looking for US real-time news and level I/II data, I encourage you to check out our Scanz review.
Read the In-Depth MetaStock Test
8. Tickeron: Best AI Stock Screening.
Tickeron provides premium AI-driven investing and trading tools, including portfolio construction, stock price prediction algorithms, and stock screening and scanning. Tickeron enables screening seven fundamental rating indicators, including valuation, profit/risk, price growth rating, and seasonality score.
My Tickeron testing confirms impressive AI-powered chart pattern recognition and prediction algorithms for stocks, ETFs, Forex, and Cryptocurrencies. Tickeron provides reliable thematic model portfolios, specific pattern-based trading signals, success probability, and AI confidence levels.
| Test | Tier | Score | Median |
|---|---|---|---|
| Lab Test Composite Score (CLPS) | A | 4.19 | 4.21 |
| Pricing Index: $ per Day | A | $4.11 | $2.74 |
| Value Score (VP) | B | 3.26 | 2.82 |
| Speed & Ease of Use | AAA | 4.83 | 4.50 |
| Chart Analysis Depth Index | C | 0.77 | 3.17 |
| Chart Pattern Depth & Accuracy | B | 3.43 | 2.73 |
| Scanning Performance | C | 2.05 | 3.38 |
| Backtesting Performance | C | 1.88 | 3.38 |
| Trading Bot & Auto-Trading Reliability | A | 4.00 | 2.50 |
| AI & Algo Index | AA | 4.50 | 2.00 |
| Alert Speed | A | 4.00 | 3.67 |
| Trade Signal Quality | AAA | 5.00 | 0.00 |
| Broker Connectivity & Ecosystem Depth | B | 3.17 | 2.00 |
| Portfolio Tool Performance | B | 3.00 | 2.80 |
| Financial News Speed & Depth | C | 2.80 | 2.80 |
| Community Utility Index (CUI) | C | 2.75 | 3.25 |
| Support Infrastructure & SLA Audit | C | 2.75 | 3.75 |
Pros
✔ 45 Streams of Trade Ideas
✔ AAA 5.00 Trade Signals
✔ Real-Time Pattern Recognition for Stocks, ETFs, Forex, and Crypto
✔ AI Trend Prediction Engines
✔ Investing Portfolios with Audited Track Records
✔ Build Your Portfolios with AI
Cons
✘ Custom Charting Limited
✘ Cannot Plot Indicators
✘ Complicated Pricing
Tested using benchmarking system v3.
See the 2026 v3 58-point Tickeron test and benchmarks.
Tickeron’s trading platform is unique and innovative. It combines artificial intelligence and human intelligence based on the community of traders, so you can compare what humans think versus what machines think.
Tickeron bridges the gap for those who want to trade short-term and invest long-term. It uses smart AI algorithms to suggest trading ideas or construct intelligent portfolios.
Tickeron also provides fundamental financial filters for 12 criteria, including price/book, PE ratio cash/share, beta, EPS, ROE, revenue per share, and dividend yield.
Tickeron can find stocks based on industry, sector, market capitalization, or technical buy-and-sell ratings. If you want to perform specific screening for value, dividend, or growth stocks, Tickeron is of little use.
Tickeron is designed to find high-probability trading opportunities, not for long-term investors wishing to build a sustainable portfolio. If you are a long-term investor, I recommend Stock Rover.
Overall, Tickeron is easy to use and provides enough power for demanding traders. You do not need to install software or configure data feeds. The most difficult element of Tickeron is figuring out the pricing model, which is overly complex and granular. I spoke with my contact at Tickeron, who told me they are working to simplify the pricing structure.
You can immediately save 50% on all Tickeron’s plans by signing up for a single annual payment rather than paying monthly. This radically reduces the cost of the Expert plan from $250 per month to $125, which makes it a very cost-effective AI trading service.
9. Finviz: Best Free Beginner Stock Screener.
Finviz is one of the best free stock screeners because it includes chart pattern recognition and a great selection of financial metrics at no cost. It uniquely enables investors to visualize vast stock market data on a single screen and has greatly improved its charting, backtesting, and pattern recognition.
After hands-on testing, I found Finviz to be a powerful free stock screener, with swift market heatmaps and impressive stock chart pattern recognition.
Thanks to ongoing enhancements to its charting capabilities, Finviz remains a relevant and powerful tool in stock analysis. Through my testing, I found Finviz to be an exceptional free resource, offering intuitive heatmaps, speedy stock screening, and seamless chart pattern recognition.
| Test | Tier | Score | Average |
|---|---|---|---|
| Lab Test Composite Score | B | 3.84 | 4.21 |
| Value Score (VP) | C | 1.74 | 2.82 |
| Speed & Ease of Use | AAA | 4.83 | 3.75 |
| Chart Analysis Depth Index | C | 1.54 | 3.17 |
| Chart Pattern Depth & Accuracy | C | 2.73 | 2.73 |
| Scanning Performance | C | 2.26 | 3.38 |
| Backtesting Performance | C | 2.75 | 3.38 |
| Trading Bot & Auto-Trading Reliability | C | 2.00 | 2.50 |
| AI & Algo Index | C | 2.00 | 2.00 |
| Alert Speed | B | 3.67 | 3.67 |
| Trade Signal Quality | C | 0.00 | 0.00 |
| Broker Connectivity & Ecosystem Depth | C | 0.67 | 2.00 |
| Portfolio Tool Performance | C | 2.50 | 2.80 |
| Financial News Speed & Depth | C | 1.50 | 2.30 |
| Community Utility Index (CUI) | C | 1.75 | 3.25 |
| Support Infrastructure & SLA Audit | C | 1.25 | 3.75 |
Tested using rating system v3.
See the 2026 v3 58-point Finviz test and benchmarks.
Pros
✔ 67 stock screening metrics
✔ 33 Chart Patterns Recognized
✔ Intraday (1-minute) data with Finviz Elite
✔ One of the best free stock screeners
✔ Good insider trading/news service
✔ Fast heatmaps for sector & industry visualizations
✔ Integrated news aggregation
✔ Backtesting recognizes 102 chart patterns
Cons
✘ Elite Backtesting Could Be More Flexible
✘ 21 chart indicators
✘ No app for Android or iPhone
✘ No Community
✘ Support & SLA
For those seeking more advanced features, Finviz Elite delivers value at $299 per year, providing real-time data and robust backtesting tools.
Finviz’s elite service provides real-time market data and enables up to 24 years of backtesting across multiple combinations of 102 technical indicators. Finviz is designed for individual investors, enabling them to screen for stocks, see which are on the move, and track their performance in real time.
| ⚡ Finviz Features ? | Screening, Heatmaps, Charts |
| 🏆 Exceptional Features ? | Patterns, Signals, Auto-Trendlines |
| 🎯 Best for | Beginner Investors/Traders |
| ♲ Subscription | Monthly, Yearly |
| 💰 Price | $0 | $25 |
| 🆓 Free Plan | ✔★ |
| 💻 OS | Web Browser |
| 🎮 Trial | 30-Day Money-Back |
| ✂ Discount | 37% Discount on Yearly Plan |
| 🌎 Region | US |
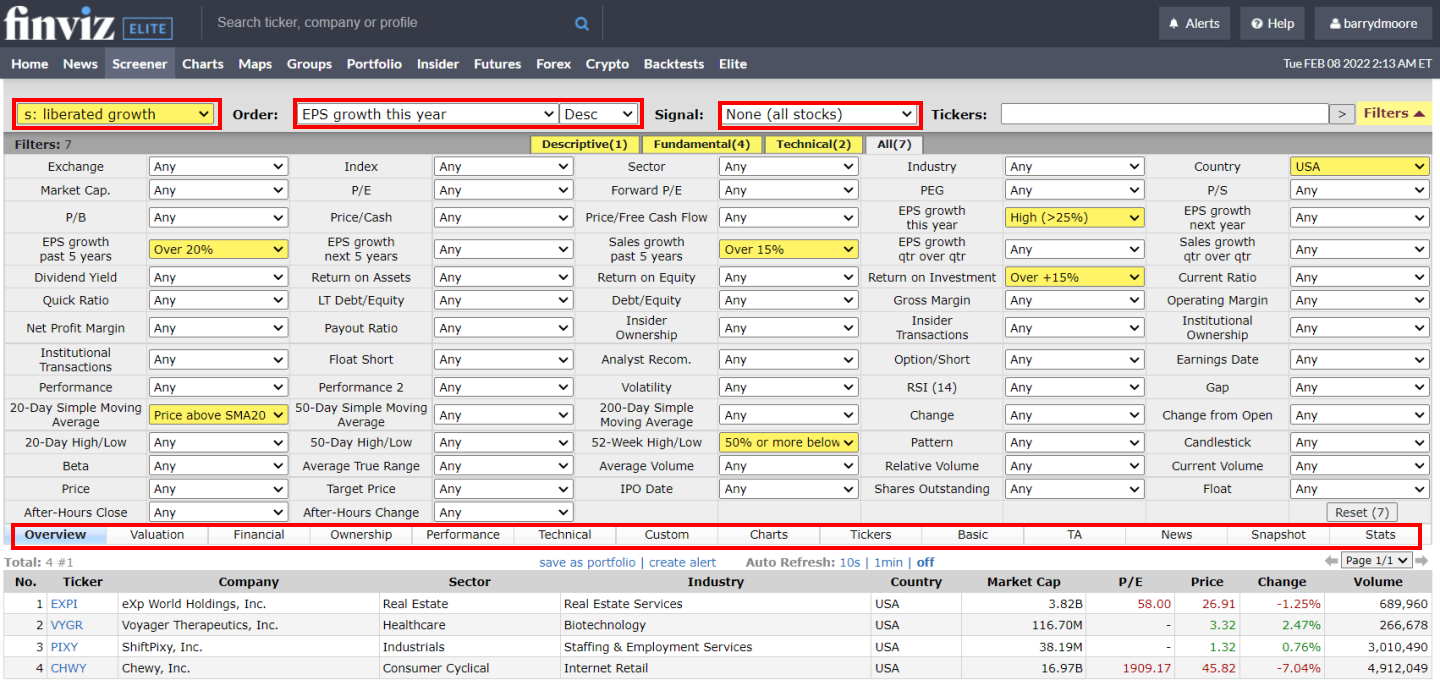
The Finviz stock screener is extremely fast and allows you to filter on 67 fundamental and technical criteria. You can filter the stocks on specific chart-based signals such as new highs, lows, oversold, analyst upgrades, insider buying, or even chart patterns like double tops and head-and-shoulders.
Finviz allows you to scan for a mix of 67 fundamental criteria and combine it with 30 different trading signals. That may seem like a huge choice, but TradingView offers over 168 criteria, Portfolio123 has 470 filters, and Stock Rover provides over 650 options.
Finviz also shines where the others do not because you can also screen on ten major candlestick patterns and 30 stock chart patterns. This mix of fundamental screening criteria for investors, technical charts, and candlestick pattern recognition for traders makes Finviz a good match for short-term and medium-term investors.
In the screenshot above, I have highlighted the key interesting Finviz stock screener fields in red. To test the Finviz screener, I built a growth stocks screening strategy to demonstrate high EPS growth, sales growth, ROI, and price above the 20-day moving average.
Finviz provides incredibly fast stock screening, heatmaps, and stock chart pattern recognition for free. If you want to visualize a large amount of stock data and find investments quickly, Finviz is worth it.
Read the Finviz Test & Rankings
10. Portfolio 123: Good Backtesting Screener.
The results of our Portfolio123 testing show impressive stock screening software with a robust financial database and integrated commission-free trading with Tradier. Portfolio123 can be used by income, value, and growth investors but is also advantageous for swing traders.
My Portfolio123 testing highlights its solid stock screening, financial database, and easy integration for commission-free trading. Charting and usability can be improved, but it is good for dividend and growth investors. Value investors should look at Stock Rover as a better alternative.
| Portfolio123 Rating ? | 4.1/5.0 |
|---|---|
| 💸 Pricing ? | ★★★★✩ |
| 💻 Software ? | ★★★★★ |
| 🚦 Trading ? | ★★★★✩ |
| 📡 Screening ? | ★★★★★ |
| 📰 News & Social ? | ★✩✩✩✩ |
| 📈 Charts & Analysis ? | ★★★★✩ |
| 🔍 Backtesting ? | ★★★★✩ |
| 💡 Portfolio Research ? | ★★★★★ |
| 🖱 Usability ? | ★★★✩✩ |
Portfolio123 covers stocks, fixed income, and ETFs on US and Canadian exchanges, so it is unsuitable for international stock investors. However, you can design a fully automated real-time trading strategy with a broker that will hold the stocks that pass your screen and sell those that don’t.
Portfolio123 is a Chicago-based company offering stock screening, research, and portfolio management software.
Pros
✔ 470+ Screening Metrics
✔ 10-Year Backtesting Engine
✔ Unique 10-Year Historical Data
✔ Pre-built Model Screeners
✔ 260 Financial Ratios
✔ Integrated $0 Trading
Cons
✘ No Integrated News
✘ No App for Android or iPhone
✘ Initially, Complex To Use
✘ Missing Fair Value & Margin of Safety Metrics
✘ Technical Analysis Charting Needs Improving
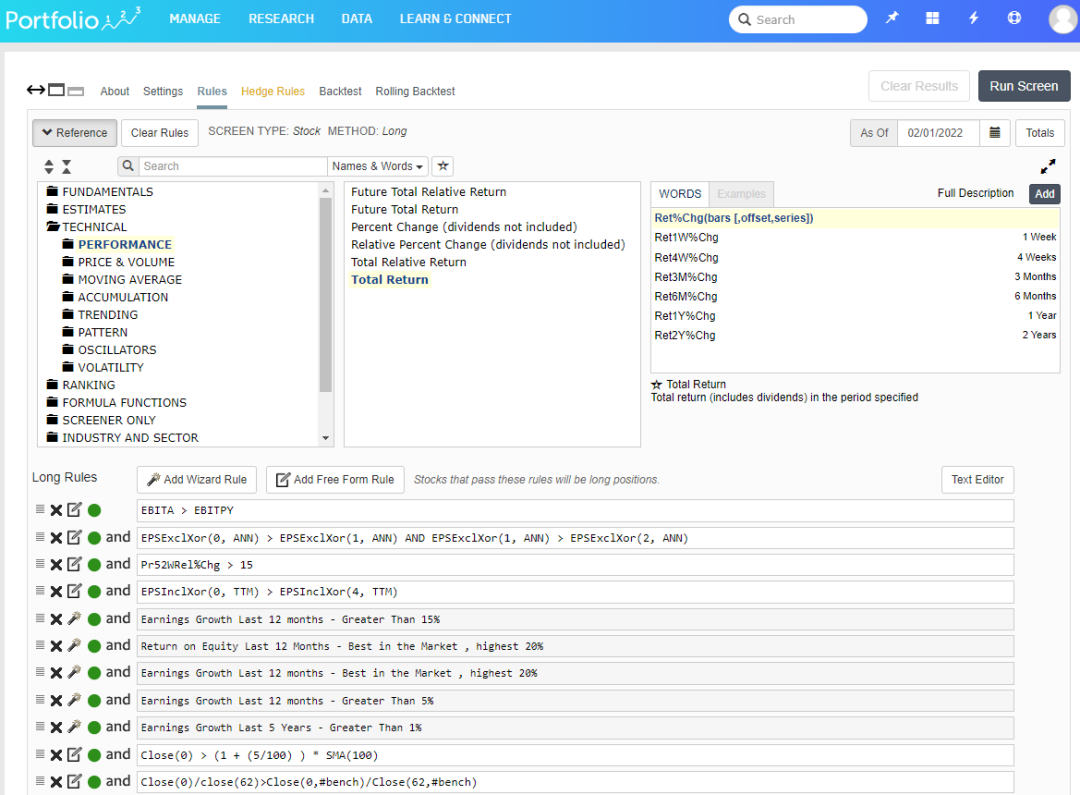
The Portfolio123 screener allows you to filter 10,000+ stocks and 44,000 ETFs to help you find the investments or trades that match your exact criteria. Portfolio123 also has ranked screening, which enables you to rank the stocks that best match your criteria, filtering a list from hundreds of stocks to a handful. You can also define your custom universes, setting the macro criteria for which stocks are included in the sample.
Over 225 data points will cover most ideas based on fundamentals. Portfolio123 has 460 criteria, including analyst revisions, estimates, and technical data.
Here is a very complex screening strategy I developed using Portfolio123; as you can see, it is extremely powerful and flexible, with almost limitless rules and conditions.
Building your Portfolio123 screener is theoretically easy; select Research -> Screens, and you can start to play. No programming skills are required to build a Portfolio123 screener, but basic coding will certainly help. If you want to create more powerful screening rules, you must spend significant time studying the coding logic and understanding the names of the proprietary criteria.
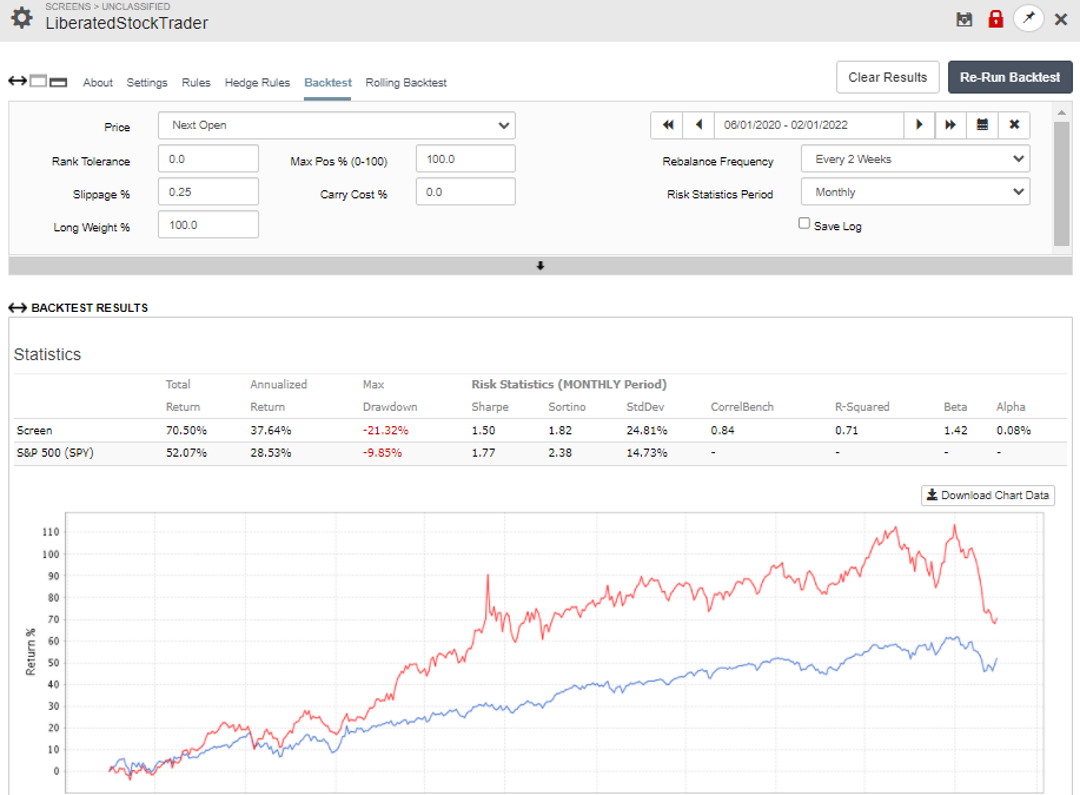
Portfolio123’s backtesting engine is where the software shines. Expertly implemented, fast, and extremely configurable, Portfolio123 has the best backtesting service for people serious about testing fundamental strategies.
Portfolio123 enables you to be very granular in setting up your backtest with entry rules, slippage, weighing, rebalance frequency, and custom timeframes.
The image below shows the LiberatedStockTrader screener I developed in the previous section. I backtested the screener for two years to see how it performed historically. My screener beat the market in this particular timeframe, returning 70.5% versus the S&P500’s 52%.
Portfolio123 has over 76 pre-built screeners that you can import and use. To take advantage of this, you need the Screener subscription plan service. I have personally tested many of them, which are very thoughtfully built. One of my favorites is the “Small Cap Winners” screener.
The Best Trading Scanners
The best stock scanners are TrendSpider, TradingView, and Trade Ideas. TrendSpider is our winner for innovation and easy-to-use power. TradingView enables global market scanning for stocks, Forex, and Crypto. Trade Ideas utilizes 3 AI Bots to scan the market for specific trading opportunities.
The Best Investing Screeners
The best free stock screeners offering the most functionality are Stock Rover for long-term US investors and TradingView for US and international traders and investors. Finviz also has an excellent free stock screener. Stock Rover and TradingView offer the most useful free screening and scanning services.
FAQ
What does a stock screener do?
Stock screeners do the task of finding stocks for investors based on specific investing criteria. Stock screeners save investors time by providing an efficient and effective way to highlight potential stocks that meet their investing strategy requirements.
What is the difference between a screener and a scanner?
A stock screener enables you to filter stocks based on fundamental financial criteria such as Analyst Estimates, Earnings, Valuation, Cash Flow, and Sales. A stock market scanner will typically scan the market for technical measures, such as a new price high, a price above the moving average, or volume increases.
How to choose the best stock screener?
You should choose a stock screener based on your investing strategy. If you are a long-term growth, value, or dividend investor, then Stock Rover is a good choice. If you are a stock trader, then TradingView is a solid choice. Day Traders should select a scanner like Trade Ideas, which uses AI signals to give you an edge.
What to look for in a stock screener?
When looking for a good stock screener, you must understand your investing strategy. For a value investing strategy, a stock screener needs criteria such as Margin of Safety, Forward Cash-Flow, and Fair Value. An income strategy requires dividend yield, growth, and coverage criteria. For a growth strategy, a screener must have historical financial performance data on price, earnings, debt, and revenue.
Suppose you are day trading or swing trading. In that case, you will need a scanner to filter on technical criteria, such as stock price changes, volatility, volume, and performance, against indicators like MACD, Moving Averages, and RSI.
Are stock screeners free or paid?
Most stock screeners are free to use, but you will need to pay to unlock more filters, features, and benefits. For example, Finviz, TradingView, and Stock Rover are excellent free screeners. But as you become more experienced and your strategies refined, you may want to pay for their premium services.
What stock screener should you use?
Our analysis shows that if you are a US value, growth, or dividend investor, you should use Stock Rover. If you are a US day trader, you should use Trade Ideas. If you are a US or international stock trader, then TradingView is a good choice.
What is the best free stock screener?
The best free stock screener for US long-term investors is Stock Rover. The best free screeners for traders are TradingView and Finviz. These free stock screeners offer powerful tools and functionality ideal for finding good potential investments at no cost.
What is the best paid stock screener?
Our research shows that the best stock screener for USA investors is Stock Rover, which provides powerful financial data filters. For international investors, TradingView and MetaStock are excellent choices.
Which stock screener is best in India?
Our research revealed the best stock screeners covering the India Sensex and BSE stock exchanges are TradingView and MetaStock. TradingView’s screener covers India and is free. MetaStock Refinitiv’s paid service has excellent stock screening, backtesting, and real-time news for all Indian stocks.
What is the best stock screener for Europe?
From my testing, Chartmill has an excellent screening engine for Euopean stocks, including powerful fundamental criteria, and pattern recognition for stocks.
What is a good Can Slim stock screener?
Our testing shows there are two good options for finding Can Slim stocks. Stock Rover’s stock screener enables you to implement a Can Slim strategy easily. Investors.com is the home of the Can Slim strategy and provides a slick paid screening service.
Hi Michael, your review of ChartMill is available here. I quite liked it, a powerful screener and the trading ideas concept was very good. https://www.liberatedstocktrader.com/chartmill-review/
Hi Michael, thanks for your input here. I have covered Vectorvest, Finviz, and TC2000 from your list. I will add Chart Mill to my list for testing. Wealth365 looks like a seminar plaform, and Chaikin Analytics seems to cost $5,000 per year for specific stock tips, but will take a look.
When you say Gurus, do you mean GuruFocus? If so I have looked at it. It seems similar to Stock Rover but a lot more expensive and with fewer screening criteria and more restrictions on downloadable data.
I really appreciate your input, and will perform more testing.
Any further input is welcome.
Thanks
Barry
Hmmmm, either you’re not getting around much or you might be playing favourites for fees!?! I can list several other platforms winning awards and/or with sophisticated screening abilities, like Wealth365, IBD, VecorVest, Chaikin Analytics, ChartMill, Gurus, etc. For full disclosure, I do use TC2000, VectorVest, Finviz, and Chartmill for both US and CA stocks. I have commented previously but seems you might be too busy to respond.
Stock Rover is the best for sector rotation
Appreciate very much your research in evaluating the different services. Great reviews; very informative and useful.
Which services are best for identifying sector rotation? Your service covering the major indices seems very useful but you don’t apply it to sectors. Why not?