As an 8-year paid subscriber to TradingView, I rely on it daily and have extensive experience with the platform. In this overview, I’ll break down its free and premium features and offer insights on how they compare to its top competitors.
My testing awards TradingView 4.75 stars due to its continued innovation in chart analysis, pattern recognition, screening, and backtesting. TradingView is my top recommendation for US and international traders.
Composite Lab Performance Score
TradingView earned a AAA 4.75 Lab Test Composite Score, which puts it at the top of my benchmark range.
In plain terms, it’s one of the few platforms that feels “complete” across the workflows that actually matter day-to-day: charting, scanning, alerts, community scripts, and multi-asset coverage—without forcing you into a heavy desktop install or a fragmented tool stack.
| Metric | TradingView | High | Median | Low |
|---|---|---|---|---|
| Composite Lab Performance Score (CLPS) | 4.75 | 4.75 | 4.21 | 2.93 |
| Composite Lab Performance Score (CLPS) Overall Test Winners | TradingView 4.75 | TrendSpider 4.72 | Trade Ideas 4.52 |
What pushed TradingView to the ceiling of the category in my scoring isn’t one gimmick feature—it’s the combination of (1) speed, (2) charting depth, (3) automation-ready alerts, and (4) ecosystem scale. The weaknesses are real, but they’re mostly “edge-case” needs (portfolio basket backtesting, vendor-audited signals, terminal-grade breaking news, enterprise-style SLA support).
Verdict & Video Summary
My testing shows TradingView is best for international stock, FX, and cryptocurrency traders. It’s the ultimate all-rounder with a global community, heatmaps, broker integration, pattern recognition, backtesting, and screening.
It automatically identifies chart and candlestick patterns, making it incredibly useful for technical analysis.
Additionally, TradingView offers excellent backtesting capabilities and a thriving trading community, making it a great choice for international traders.
TradingView’s powerful scanning and charting software appeals to day and swing traders. However, if you want to implement long-term growth, dividend, or value investing strategies, consider my alternatives to TradingView.
With excellent social integration, chat, news, the ability to follow other investors and share trade ideas, and global stock exchange data, TradingView is the worldwide leader in stock charting and analysis.
TradingView Lab Test Results & Ratings
TradingView is the world’s premier trading platform, trusted by over 20 million active traders. It offers a seamless blend of powerful charting tools, advanced screening features, and in-depth analysis, covering a wide range of assets, including stocks, indices, ETFs, and cryptocurrencies.
| Test | Tier | Score | Average |
|---|---|---|---|
| Composite Lab Performance Score | AAA | 4.75 | 4.21 |
| Pricing Index: $ per Day | AA | $1.97 | $2.74 |
| Value Score (VP) | AA | 4.37 | 2.82 |
| Speed & Ease of Use | AAA | 5.00 | 4.50 |
| Chart Analysis Depth Index | AAA | 5.00 | 3.17 |
| Chart Pattern Depth & Accuracy | B | 3.98 | 2.73 |
| Scanning Performance | AAA | 4.83 | 3.38 |
| Backtesting Performance | A | 4.19 | 3.38 |
| Trading Bot & Auto-Trading Reliability | B | 3.50 | 2.50 |
| AI & Algo Index | B | 3.00 | 2.00 |
| Alert Speed | AA | 4.67 | 3.67 |
| Trade Signal Quality | C | 2.50 | 0.00 |
| Broker Connectivity & Ecosystem Depth | AAA | 5.00 | 1.55 |
| Portfolio Tool Performance | B | 3.60 | 2.80 |
| Financial News Speed & Depth | B | 3.00 | 2.30 |
| Community Utility Index (CUI) | AAA | 5.00 | 3.25 |
| Support Infrastructure & SLA Audit | B | 3.25 | 3.75 |
Tested using benchmarking system v3.
See the 2026 v3 58-point TradingView test and benchmarks.
Pros
✔ 20 million users sharing ideas
✔ AAA Speed & ease of use
✔ Trading from charts
✔ Powerful screening and technical analysis
✔ All stock exchanges globally
✔ AAA Broker connectivity and asset coverage
✔ 100,000+ user-generated strategies
✔ Free and low-cost plans
✔ Flexible backtesting with Pine Script
Cons
✘ Not ideal for value or dividend investors
✘ Coding skills required for backtesting and custom indicators
✘ Average portfolio tools

TradingView provides best-in-class technical analysis tools to analyze financial markets. It offers heatmaps, super charts, indicators, strategy development tools, and backtesting capabilities.
Its vibrant community of traders shares ideas, strategies, and custom indicators, making it an invaluable resource for learning and collaboration.
| ⚡ TradingView Features ? | Charts, News, Watchlists, Screening, Chart Pattern & Candlestick Recognition, Full Broker Integration |
| 🏆 Unique Features ? | Trading, Backtesting, Community, Global Stock, FX & Crypto Markets, Webhook Bot Integration |
| 🎯 Best for | Stock, FX & Crypto Traders |
| ♲ Subscription | Monthly, Yearly |
| 💰 Price | $0 | $15 | $35 | $70 |
| 🆓 Free | ✔ |
| 💻 OS | Web Browser|PC|IOS|Android |
| 🎮 Trial | Yes, Free 30-Day Premium |
| ✂ Discount | -17% on yearly plan + $15 Discount |
| 🌎 Region | Global |


Value Score (VP)
TradingView posted a A 4.20, which is close the best score in my benchmark (High: 4.37 | Median: 2.82 | Low: 1.7). This category answers a simple question: “Even if the price is fair—how much practical utility do you really get?”
| Metric | Calculation | TradingView | High | Median | Low |
|---|---|---|---|---|---|
| Value Score (VP) | Sum of Feature Quality (60% Weight), Feature Depth (30%) & Device Support Depth (10%) | 4.37 | 4.37 | 2.82 | 1.70 |
| Value Rank | Percentile Ranking | 5.00 | 5.00 | 2.50 | 1.00 |
| Feature Quality | Average of All Feature Quality Ratings | 4.07 | 4.16 | 2.97 | 2.00 |
| Feature Breadth | Feature richness (count of meaningful core features) | 17 | 17 | 12 | 9 |
| Feature Depth | Percentile Ranking | 4.75 | 4.75 | 3.00 | 1.00 |
| Device Support Depth | Web 2 points, (PC, Android/iOS/ 1 Point each) | 5.00 | 5.00 | 2.00 | 1.00 |
| Value Score Test Winners | TradingView 4.37 | TrendSpider 4.20 | Trade Ideas 4.05 |
Context: This is the “why TradingView” metric. Plenty of platforms have features; TradingView’s advantage is that the features are polished, broadly usable, and accessible across devices—which matters more than raw checkbox counts.
TradingView pricing starts at $0 for the Basic, ad-supported plan, which includes ad-supported screening, charting, trading, scripting, backtesting, and three indicators per chart. The Free plan is a great way to test the service.
TradingView Essential costs $12.95/mo on an annual plan and is ad-free. It includes two charts per layout, five indicators per chart, and 20 alerts. It is ideal for beginners and also enables access to the full social network.
The annual Plus Plan at $28/mo adds four charts per tab, 100 alerts, and advanced Renko, Kagi, Point & Figure, and Line Break charts.
I personally use TradingView Premium at $59.95/mo annually; it offers the optimal balance of price and key functionality: 25 indicators per chart, 400 alerts, and, most importantly, automated chart pattern recognition.
It is designed for intermediate and advanced-level traders who seek the optimal balance between functionality and price.
TradingView Pricing vs. Competition
| Pricing ? | Free | Pro | Ranking |
| TradingView | ✔ | $0 | $15 | $35 | $70 | #1 |
| TrendSpider | ✘ | $54 | $214 | #2 |
| Trade Ideas | ✘ | $89 | $178 | #3 |
| MetaStock | ✘ | $100 | $265 | #4 |
As you can see, TradingView is the price leader in every category, but ultimately, it depends on what you are looking for. If you want an intraday spread and custom charts, go for the Plus plan.
Is TradingView Free?
Yes, TradingView is free, and unlike other stock charting software, you can perform stock analysis and screening and read community ideas for no charge. However, the free tier is ad-supported, and you can only save one chart in a single workspace.
Is TradingView Real-time?
Yes, TradingView provides real-time exchange data if you subscribe to any of the Premium services. Most exchanges charge extra for real-time data, but TradingView’s real-time data costs are the lowest in the industry, charging only $2 per month per exchange, compared to competitors charging $10 to $15.
Is TradingView Premium Worth It?
TradingView Plus and Premium are absolutely worth the investment. These plans unlock advanced features like multiple indicators, charts, and alerts while granting full access to the community. They also empower users with enhanced tools for more effective and comprehensive technical analysis.
How to get TradingView Premium for Free
You can access TradingView Premium for free! Sign up for a 30-day free trial of TradingView and enjoy full access to all Premium features at no cost. Take advantage of this opportunity to explore everything TradingView has to offer!
Speed & Ease of Use
TradingView scored a perfect AAA 5.00 (High: 5.00 | Median: 4.17 | Low: 2.6). This category measures friction: how quickly you can move from “idea” to “chart” to “action,” especially in multi-chart workflows.
| Metric | Calculation | TradingView Score | High | Median | Low |
|---|---|---|---|---|---|
| Speed & Use Index Rating | Average of Time to Chart Performance, Multimonitor Chart Speed & 3 Click Rule: Ease of Use | 5.00 | 5.00 | 4.25 | 2.60 |
| Time to Chart Speed (Seconds) | Seconds from clicking the icon to a fully loaded chart with 200 price bars & 2 indicators | 1.55 | 17.03 | 4.70 | 1.60 |
| Time to Chart Performance | Speed to Chart Points (<5s=5, <10=4.5, <15=4, <20=3) | 5.00 | 5.00 | 4.50 | 3.00 |
| Multi-Chart Latency (ms) | Delay in milliseconds when syncing 4 charts | 20 | 667 | 209 | 10 |
| Multimonitor Chart Speed | Multi-Chart Sync Points (<50ms=5 … >500ms=2, No Multicharts=0) | 5.00 | 5.00 | 3.50 | 0.00 |
| 3-Click Rule Test | Number of clicks to place a trade or launch a scan | 2 | 6 | 3 | 2 |
| 3 Click Rule: Ease of Use | 3 Click Points (each click > 3 = 1 minus point) | 5.00 | 5.00 | 4.50 | 3.30 |
| Speed & Ease of Use Test Winners | TradingView 5.00 | Stock Rover 5.00 | Seeking Alpha 5.00 |
TradingView’s speed profile is elite: a 1.55s “time-to-chart” result and top-tier multi-chart sync aligns with my audit notes that it “feels local,” which is exactly what traders notice under pressure. TC2000 beats it on raw multi-chart latency (10ms), but TradingView’s balance of fast start + strong multi-monitor performance + low-friction workflows keeps it at the top of the overall usability index.
Chart Analysis Depth Index
TradingView scored AAA 5.00 (High: 5.00 | Median: 3.17 | Low: 0.5). This is the category most people implicitly buy TradingView for: charting depth plus an ecosystem that lets you push far beyond defaults.
| Metric | Calculation | TradingView Score | High | Median | Low |
|---|---|---|---|---|---|
| Chart Analysis Depth Index | Average of Chart Depth, Indicator Depth & Custom Coding Scores | 5.00 | 5.00 | 3.17 | 0.50 |
| Chart Types | Total Count | 21 | 38 | 10 | 1 |
| Chart Depth | Chart Type Score (0.3 points per chart) | 5.00 | 5.00 | 3.00 | 0.30 |
| Indicators | Total Count | 400 | 400 | 116 | 0 |
| Indicator Depth | Indicators Score (0.025 points per indicator) | 5.00 | 5.00 | 2.90 | 0.00 |
| Custom Indicator Coding | Available = 5 Points | 5.00 | 5.00 | 2.50 | 0.00 |
| Chart Analysis Depth Index Test Winners | TradingView 5.00 | MetaStock 5.00 | Optuma 5.00 |
TradingView’s charting depth win is driven by the complete package: strong chart variety, maximum indicator library depth (400), and full custom scripting via Pine are the practical differentiators. Optuma leads in raw chart-type count, but TradingView’s combination of depth and usability (and a massive ecosystem of shared scripts) makes it the more scalable daily driver for most technical traders.
With over 160 different indicators and unique specialty charts such as LineBreak, Kagi, Heikin Ashi, Point & Figure, and Renko, you have everything you need as an advanced trader, day trader, or swing trader. I have a Premium membership and get fully integrated Level II data and insight.
TradingView has an exceptional selection of 65 chart drawing tools, including those unavailable on other platforms like extensive Gann and Fibonacci, plus hundreds of icons for your charts, notes, and ideas.
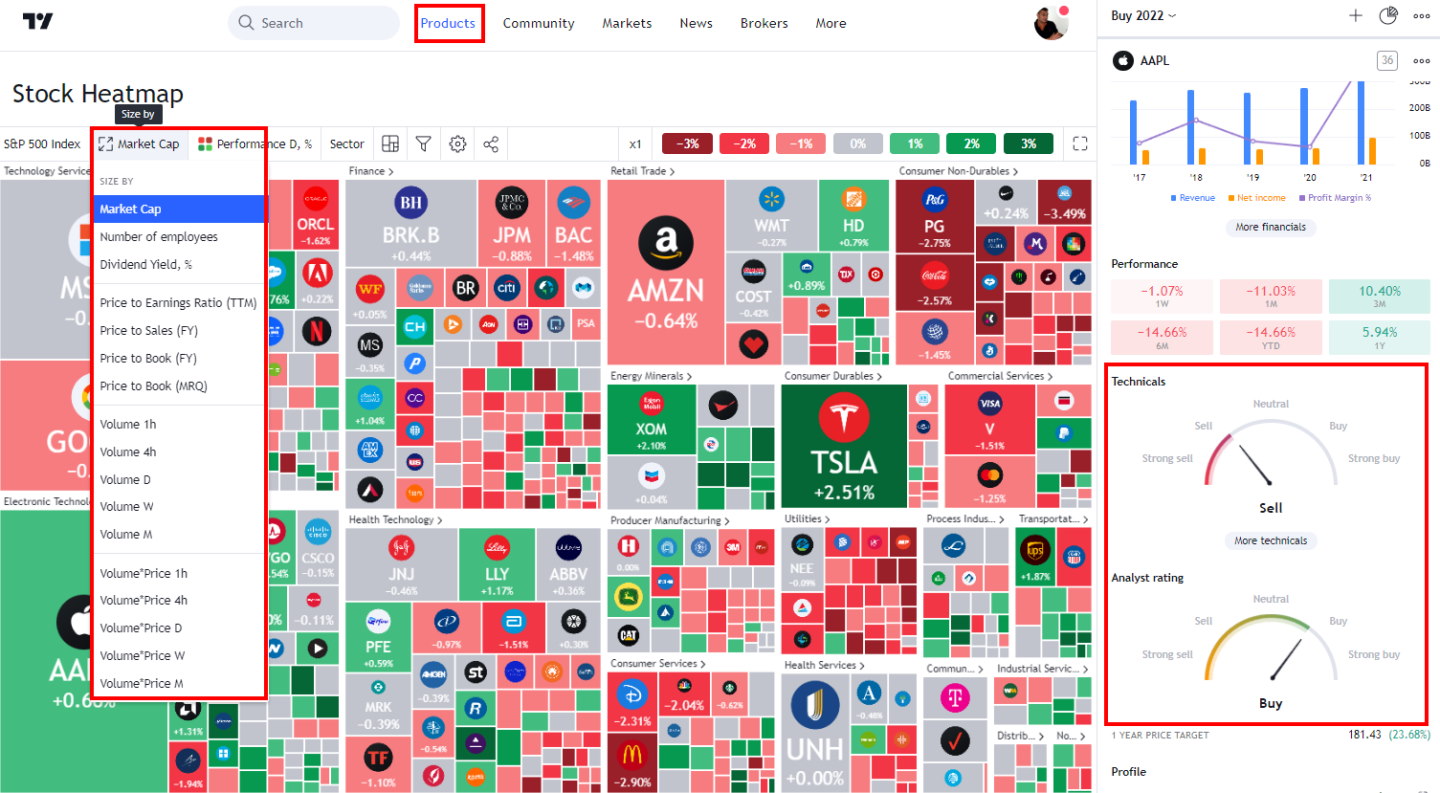
Automatic Stock Indicator Ratings
Most people do not want to learn in-depth how each indicator works. This innovation allows you to save time by getting an instant readout of which indicators are bullish, bearish, or neutral.
The stock indicators ratings are well implemented because there are two critical technical analysis indicators: moving averages based on price and oscillators based on price and volume. Based on my observations, the TradingView buy and sell indicators are a good measure of sentiment and are featured in my Fear & Greed Index Dashboard.
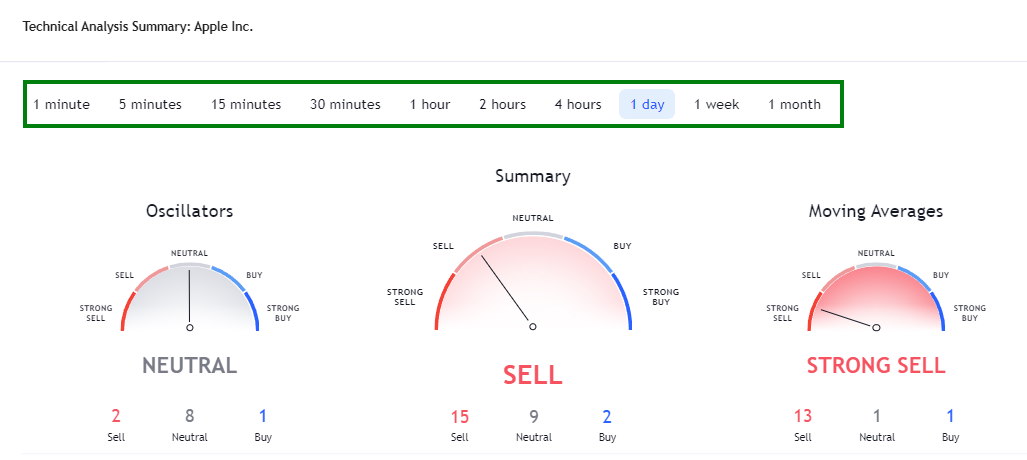
When viewing a chart, click “Technicals,” and you are presented with three gauges. The left gauge shows the oscillating indicators like relative strength, stochastics, and the Average Directional Index. On the right, you have a selection of Moving Averages, Simple, Exponential, and even Ichimoku Cloud.
Each indicator is averaged out to give an overall Buy, Sell, or Neutral Rating, making it an excellent implementation of automated technical analysis designed with the user in mind.
| Technical Charting? | Rank | Chart Types | Indicators |
| TradingView | #1 | 17 | 160 |
| TrendSpider | #1 | 6 | 206 |
| MetaStock | #2 | 10 | 150 |
| Finviz | #3 | 5 | 22 |
| Trade Ideas | #4 | 6 | 16 |
Table: TradingView vs. The Competition – Charting. Read the In-depth Best Technical Analysis Charting Software Review
TradingView Advanced Charts
I was incredibly impressed with the offering of Kagi, Heikin Ashi, and Renko Charts, including Point & Figure and Line Break. Also, the user community has developed indicators as exotic as Moon Phase.
This chart selection gives you everything you need as an advanced trader. You also get Level II insight, which is fully integrated with the Premium membership. Well done, TradingView.
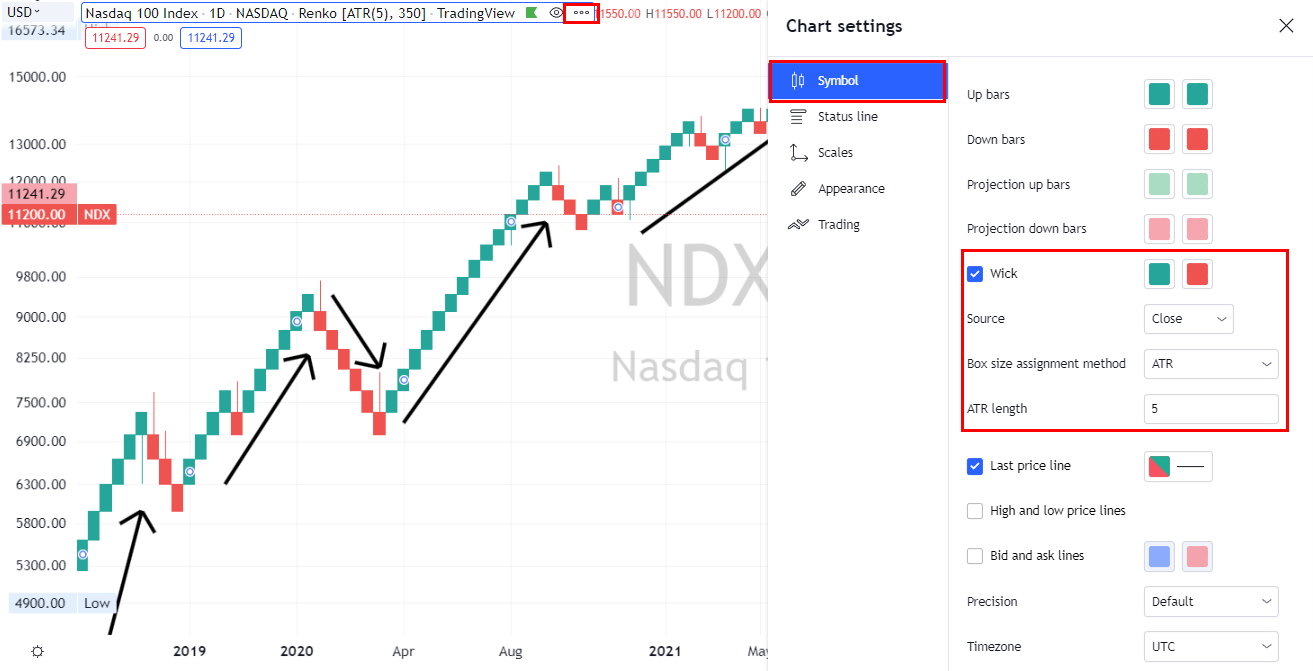
They have also implemented Darvas Box, Elliot Wave, and Point & Figure Charts for experienced technical analysts. Overall, this is an excellent package.
Chart Pattern Depth & Accuracy
TradingView scored B 3.98 (High: 4.88 | Median: 2.73 | Low: 0.0). Pattern recognition is an area where TradingView is strong, but it’s not always the maximum-depth leader versus specialist pattern engines.
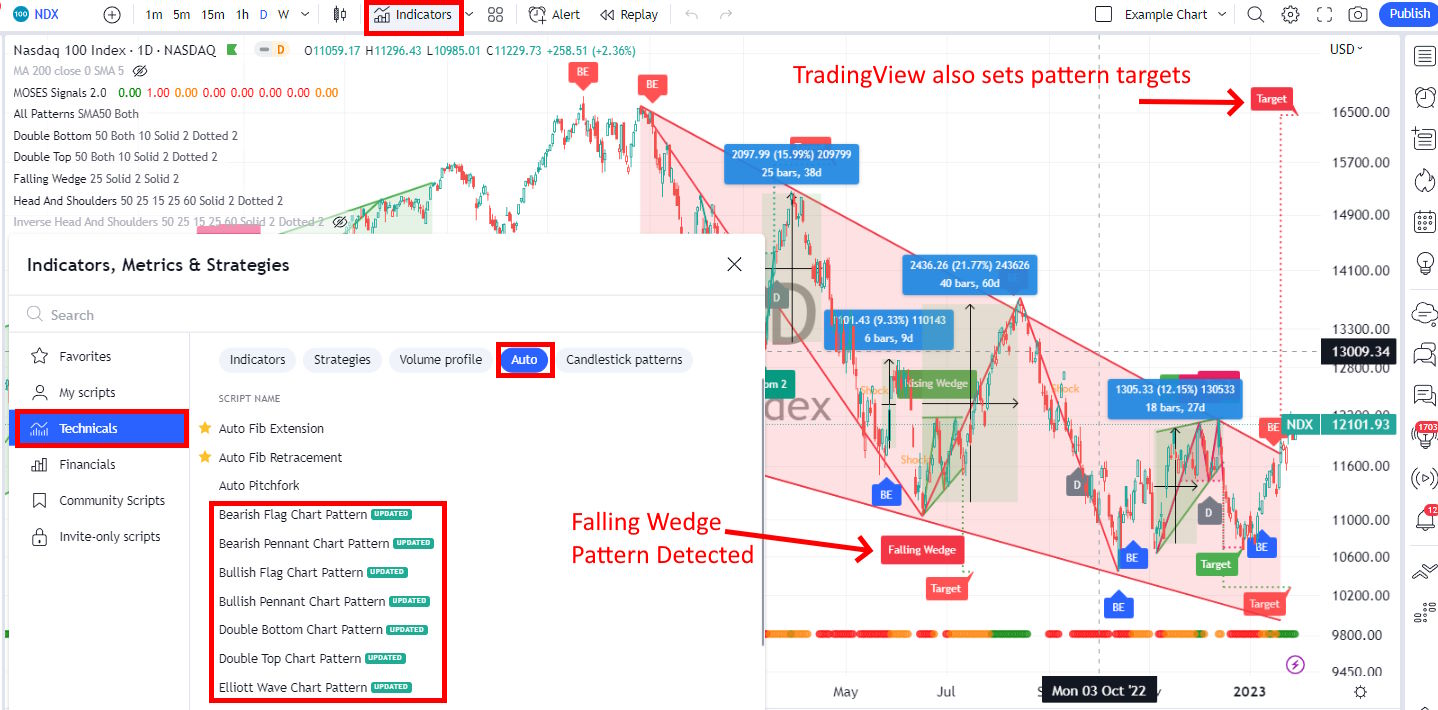
TradingView’s pattern recognition is very good, especially the functionality that sets price targets on the charts. They are straightforward to use—so while they don’t rely on sheer pattern library size, they perform strongly where it matters: accuracy and usability.
| Metric | Calculation | TradingView Score | High | Median | Low |
|---|---|---|---|---|---|
| Pattern Recognition Efficacy & Accuracy | Average of Pattern Recognition Depth & Accuracy Scores | 3.98 | 4.88 | 2.73 | 0.00 |
| Total Patterns | Count of unique patterns recognized | 97 | 226 | 57.5 | 0 |
| Pattern Recognition Depth | 0.33 points per pattern recognized | 3.20 | 5.00 | 1.90 | 0.00 |
| Candle Patterns Recognized | Count | 44 | 172 | 20 | 0 |
| Chart Price & Trend Patterns Recognized | Count | 53 | 54 | 16 | 0 |
| Accuracy | Percent Accurate | 95% | 95% | 89% | 0% |
| Pattern Recognition Accuracy | Accuracy Points (0.05 points per 1% accurate) | 4.75 | 4.75 | 4.48 | 0.00 |
| Chart Pattern Recognition & Accuracy Test Winners | TrendSpider 4.88 | Trade Ideas 4.62 | TradingView 3.98 |
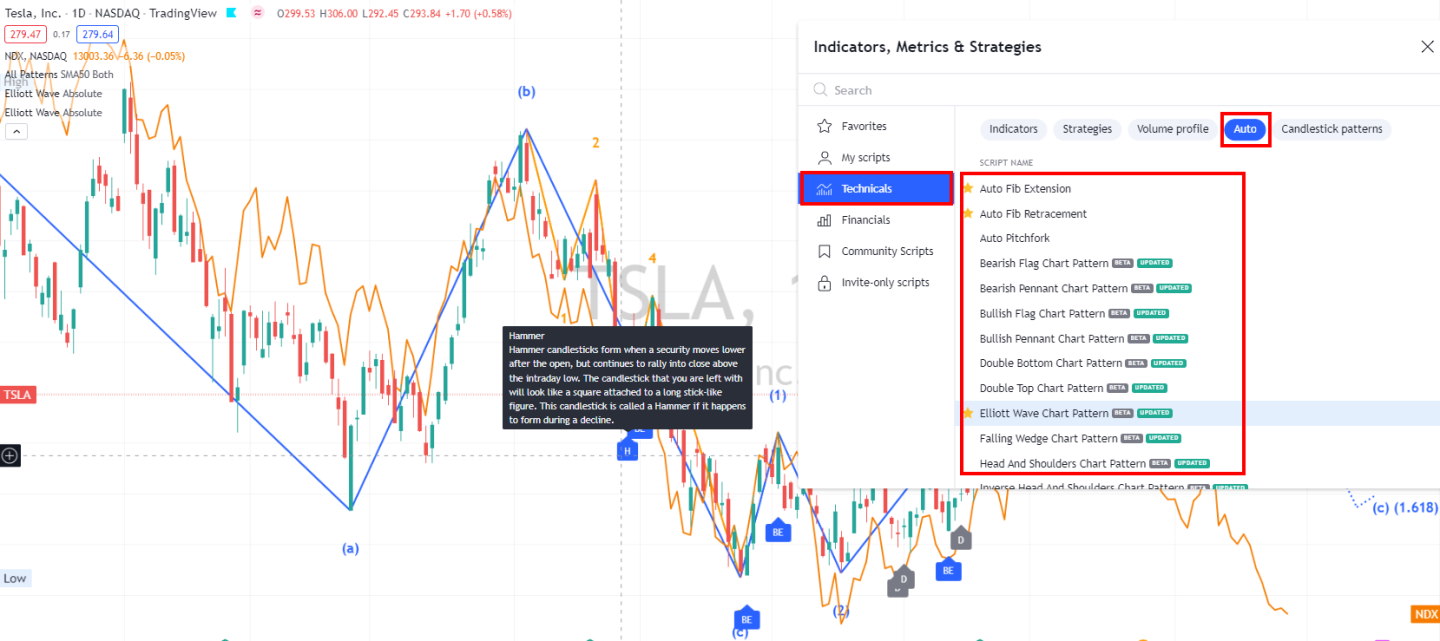
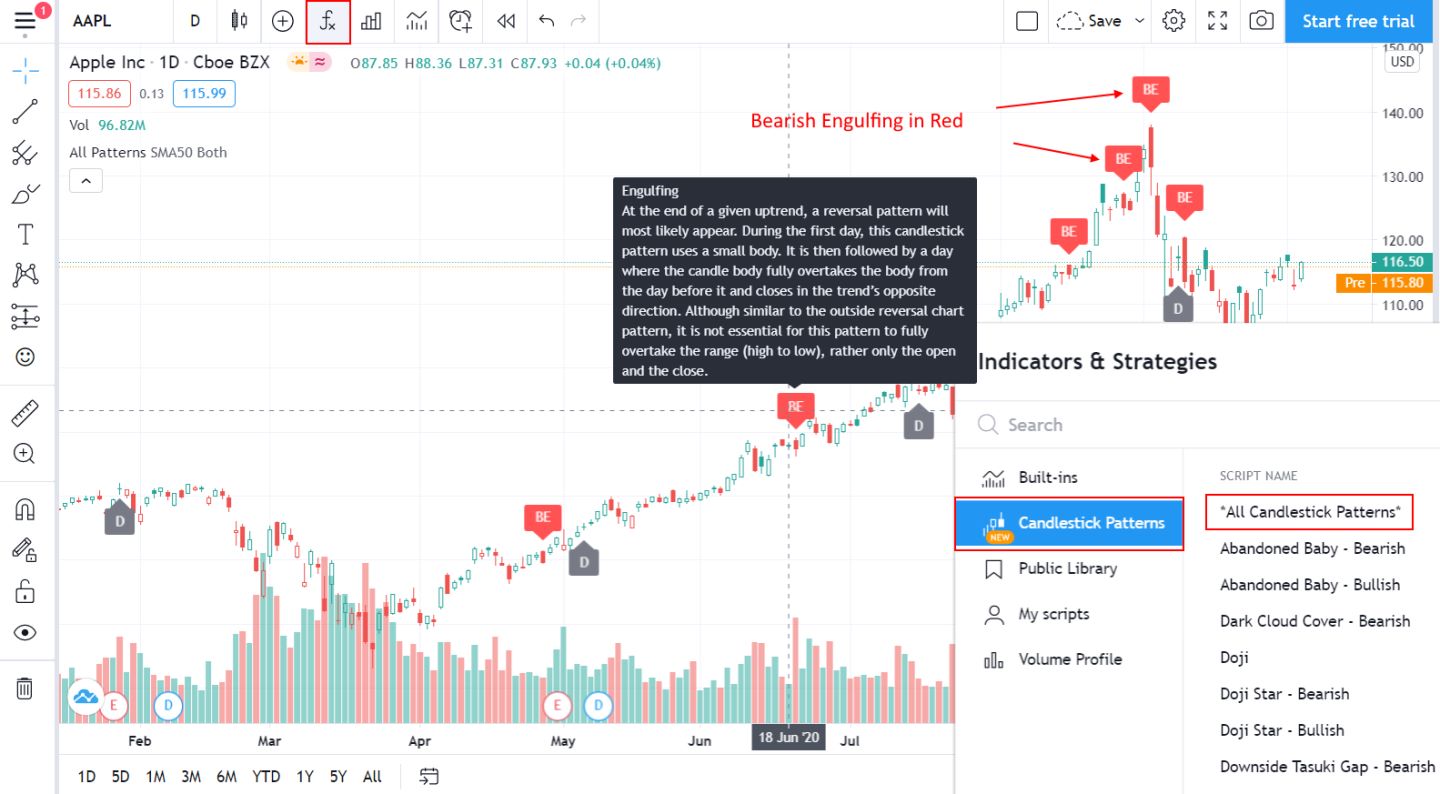
TradingView offers automated candlestick recognition for 48 patterns for free. The Candlestick pattern recognition works globally on stocks, ETFs, Forex, and cryptocurrencies. Candlestick pattern recognition is a core component of the platform, so you do not have to pay extra for a plugin; it is included.
In the image below, you can see that pattern recognition is intelligently implemented. The Bearish Engulfing (BE) patterns are highlighted in Red, with an arrow pointing downward, suggesting that this candle is a bearish sign. You can also observe that the Doji (D) patterns are grey and pointing upwards, indicating a possible price direction change.
Finally, I like that you can hover your mouse over the pattern and get a full and detailed explanation of its meaning.
| Pattern Recognition Software | TrendSpider | TradingView | Finviz |
| Rating ? | 4.9 | 4.6 | 4.4 |
| # Candle Patterns Recognized | 150 | 40 | 11 |
| # Chart Patterns Recognized | 18 | 10 | 12 |
| Trendline Recognition | ✔ | ✘ | ✔ |
| Backtesting Patterns? | ✔ | ✔ | ✔ |
Table: TradingView vs. Competition – Pattern Recognition. See the In-depth Best Pattern Recognition Software Review
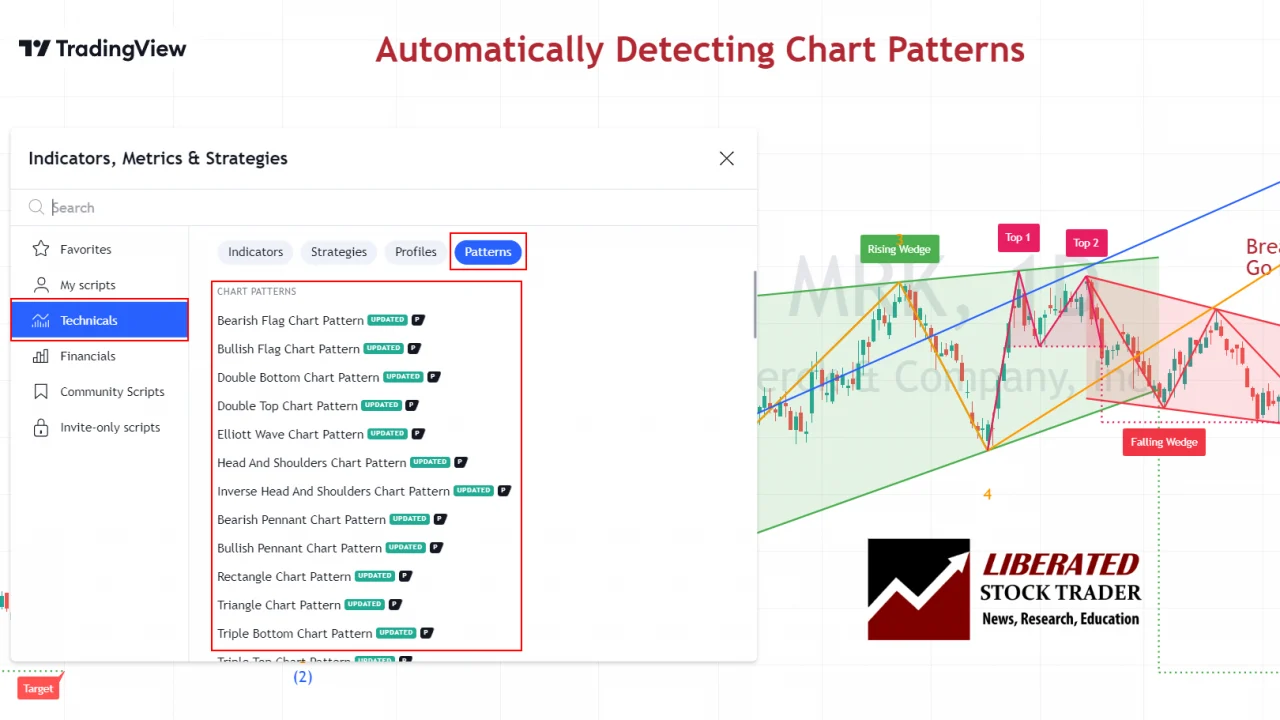
Chart Pattern Recognition
In addition to candlestick pattern recognition, TradingView can also detect 16 high-probability chart patterns, including double tops, bottoms, flags, wedges, and triangles.
Scanning Performance
TradingView scored AAA 4.83 (High: 5.00 | Median: 3.38 | Low: 0.8), with standout results on speed and strong criteria depth.
| Metric | Calculation | TradingView Score | High | Median | Low |
|---|---|---|---|---|---|
| Market Scanning Latency & Depth | Average of Scanning Speed, Criteria & Custom Code Scores | 4.83 | 5.00 | 3.38 | 0.80 |
| Scanner Performance (ms) | Milliseconds to scan S&P 500 across 5 criteria | 7 ms | 2500 ms | 300 ms | 7 ms |
| Scanning Speed (ms) | Points (<100ms=5; <200=4.5; <500=4; <1000=3; <2000=2) | 5.00 | 5.00 | 4.00 | 1.00 |
| Scanner Auto-Refresh Rate (seconds) | Auto-refresh speed (not scored) | 10 s | 60 s | 1 s | 0 s |
| Scanning Criteria & Depth | Total criteria count | 360 | 675 | 200 | 30 |
| Scanning Criteria & Depth | Points (0.0125 points per criteria) | 4.50 | 5.00 | 2.50 | 0.80 |
| Custom Code Scanning | Exists = 5 points | 5.00 | 5.00 | 5.00 | 0.00 |
| Scanning Performance Test Winners | Stock Rover 5.00 | TradingView 4.83 | TrendSpider 4.67 |
In my audit notes, I call out TradingView’s breadth of scan fields (“360 criteria across Stocks, ETF, Crypto Coins, Bonds”), and the raw scan-speed result (7 ms) explains why it feels so responsive in real-time workflows. Where it doesn’t dominate is criteria breadth versus tools like Stock Rover (which is built around deep fundamental universes and database-style screening).
Testing the TradingView stock screener shows it excels at screening for technical indicators. It provides real-time scanning and filtering on 172 metrics, including 42 financial filters. TradingView’s stock screener also includes a useful scan for technical buy and sell ratings.
TradingView’s screening watchlists have fundamental data separated into Performance, Valuation, Dividends, Margin, Income Statement, and Balance Sheet. TradingView stands out with its charting of economic indicators, for example, comparing the civilian unemployment rate versus the growth in company profits. You can set the screening watchlist and filters to refresh every minute.
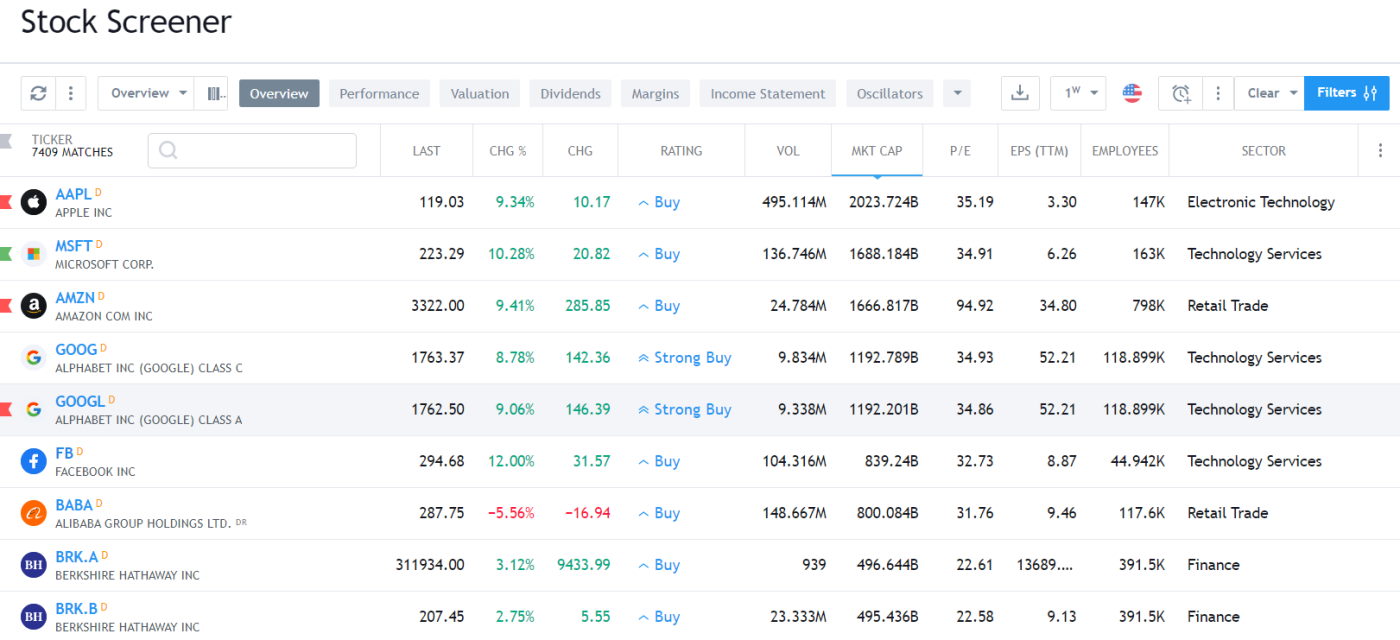
Another great thing about the screener implementation is that it is very customizable; you can configure the columns and filters exactly how you like them. As you can see above, I have changed the overview screen to include the number of employees, P/E, and EPS TTM.
Forex & Cryptocurrency Screeners
TradingView’s Forex screener shows the major and minor pairs by default, and you can add exotic FX pairs. You can also filter on rising and falling FX pairs and set alerts directly from the screener.
What is unique here is the availability of screeners for chart patterns and setups for TradingView foreign exchange pairs, making it very valuable for day traders searching for volatility and leverage.
The ability of TradingView to also provide crypto screening is unique. The cryptocurrency rating system enables you to select the cryptos rated as “strong sell” to use as candidates for short trades and strong buys as candidates for long trades, saving you a lot of time.
Backtesting Performance
TradingView scored A 4.19 (High: 4.90 | Median: 3.38 | Low: 0.0). It’s exceptionally fast and flexible—if you’re willing to operate in Pine. The trade-off is that it is not a no-code portfolio simulation suite.
TradingView has a key backtesting trade-off: it’s exceptionally fast on a single instrument, but basket testing is limited and relies on third-party scripts—hence the 2.5 score versus platforms that do portfolio/basket simulation natively. If your strategy research is multi-asset and systematic by default, Portfolio123 (and TrendSpider for workflow-driven testing) is the stronger fit.
| Metric | Calculation | TradingView Score | High | Median | Low |
|---|---|---|---|---|---|
| Quantitative Backtesting Fidelity | Avg of Backtesting Speed, No Coding, Flexible Coding, Report Quality, Basket Backtesting | 4.19 | 4.90 | 3.38 | 0.00 |
| Backtesting Speed (ms) | Time to run 10y daily or ~2 months 5-min simulation | 7 ms | 6000 ms | 302 ms | 7 ms |
| Backtesting Speed | Points (<200ms=5; <500=4.5; <10000=4; <20000=3) | 5.00 | 5.00 | 4.25 | 0.00 |
| No Coding Required | Zero-code backtesting (5 points) | 0.00 | 5.00 | 5.00 | 0.00 |
| Flexible Coding Backtesting | Exists = 5 points | 5.00 | 5.00 | 5.00 | 0.00 |
| Backtesting Report Quality | Percent of reporting criteria covered | 85% | 100% | 70% | 0% |
| Backtesting Report Quality | Points (0.05 points per 1%) | 4.25 | 5.00 | 2.25 | 0.00 |
| Multi-Stock Basket Backtesting | If exists = 5 points | 2.50 | 5.00 | 5.00 | 0.00 |
| Backtesting Performance Test Winners | Optuma 4.94 | TrendSpider 4.88 | MetaStock 4.81 |
TradingView has incredibly powerful and flexible backtesting, enabling advanced strategy testing. However, there are two drawbacks. First, you need to learn Pine script to code the strategy. Second, you cannot test your strategy on a basket of stocks. For these two reasons, TradingView gets 4.6 stars.
The only thing TradingView cannot do is forecast future stock prices; for that, you would be better off with MetaStock.
| Backtesting Software? | Backtesting | No-Code Backtesting | Auto-Trading | Rating ? |
|---|---|---|---|---|
| TrendSpider | ✔ | ✔ | ✔ | 4.9 |
| Trade Ideas | ✔ | ✔ | ✔ | 4.7 |
| TradingView | ✔ | ✘ | ✔ | 4.6 |
| Stock Rover | ✔ | ✘ | ✘ | 4.5 |
| MetaStock | ✔ | ✘ | ✘ | 4.4 |
Table: TradingView vs. Competition – Backtesting. See the full Backtesting Software Review.
TradingView Strategy Tester
TradingView has an active community of developers and sellers of stock analysis systems. With the premium-level service, you can create and sell your own. The community also offers many indicators and systems for free.
They have implemented backtesting in a straightforward, intuitive way. In the image below, I have implemented an in-built strategy called “Slow Stochastics,” which initiates a trade when the stochastics indicators are oversold and sells when stochastics are overbought.
I like that you have results in a few clicks [strategy tester -> Add Strategy]. You can also tweak the strategy parameters, as you can see below, and observe the results.
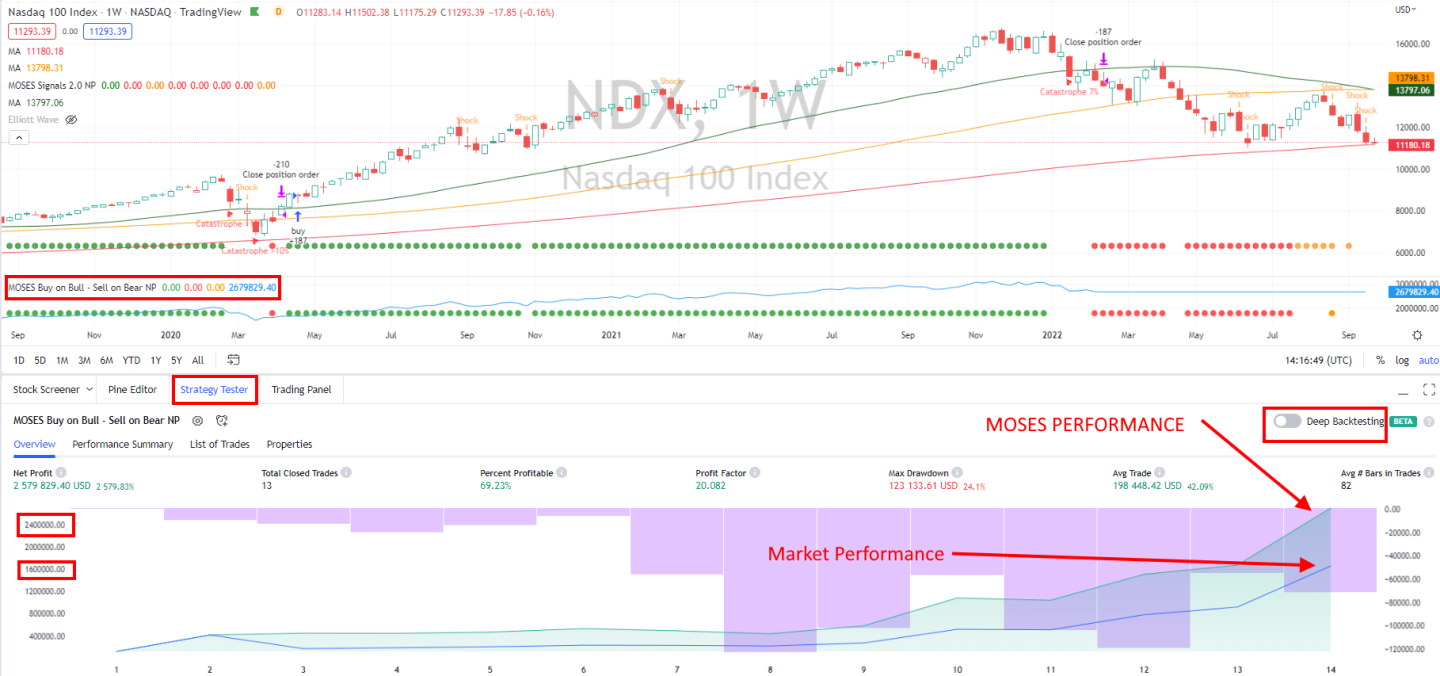
TradingView’s backtesting reports show net profit, drawdown, buy-and-hold return, percentage of profitable trades, and the number of trades.
I have even implemented my MOSES ETF Trading strategy into TradingView; I am no developer, but the Pine Script language is so natural that anyone can do it.
TradingView also has market replay functionality, enabling you to play through the timeline. It shows the chart scrolling and the trades executed; all buy and sell orders are drawn on the chart and highlighted.
Financial News Speed & Depth
TradingView scored B 3.00 (High: 5.00 | Median: 2.30 | Low: 0.0). It’s a research-friendly aggregator, not a breaking-news terminal.
I characterize TradingView’s news as “primarily an aggregator of RSS feeds”—useful for research context, but not designed for breaking-news execution where seconds matter. If your workflow depends on catalyst-speed reaction, Benzinga Pro, eSignal, Scanz, and especially MetaStock (with terminal-grade feeds) are structurally advantaged.
| Metric | Calculation | TradingView Score | High | Median | Low |
|---|---|---|---|---|---|
| Financial News Speed & Quality Rating | Weighted rubric (news scanning, chart plots, watchlist news, filtering, providers, alerts, <1m real-time) | 3.00 | 5.00 | 2.30 | 0.00 |
| News Delay vs Primary Wires | Seconds of delay vs Bloomberg/Reuters (range) | 60–300 s | < 1 s | 60–300 s | Hours/Days |
| Financial News Speed & Depth Test Winners | MetaStock 5.00 | Benzinga Pro 5.00 | Scanz 5.00 |
Check out my published ideas on TradingView and follow me for regular market and stock analysis ideas and commentary.
Join me and 20 million traders on TradingView for free. It's a great place to chart, scan, trade, and get my latest trading ideas and analysis.

TradingView presents an excellent way to generate trade ideas or learn from other traders. You have to try it and see it in action to understand the power of the implementation.
TradingView has also integrated Benzinga, Reuters, and MT newswire feeds. As soon as you connect to TradingView, you realize it was also developed for the community. You can look at community trade ideas, post your charts and ideas, and join limitless groups covering everything from bonds to cryptocurrencies.
The TradingView news service is only second to Benzinga Pro and MetaStock R/T with real-time newsfeeds.
AI & Algo Index
TradingView scored B 3.00 (High: 5.00 | Median: 2.00 | Low: 1.0). This category intentionally separates algorithmic capability from AI-native decisioning.
Context: TradingView is an algorithmic sandbox and scripting ecosystem. It’s excellent if you want to build, test, and refine logic. It is not positioned as a “black box AI that tells you what to buy.”
| Metric | Calculation | TradingView Score | High | Median | Low |
|---|---|---|---|---|---|
| Algorithmic Intelligence & AI Tier Index | Sum of Algo Depth, AI Layer, Transparency Points | 3.00 | 5.00 | 2.00 | 1.00 |
| Algo Depth | 0.5 alerts only; 1.0 rules strategies; 1.5 backtesting+factor; 2.0 advanced quant platform | 2.00 | 2.00 | 1.50 | 0.00 |
| AI Layer | 0.0 none; 1.0 assistive; 1.5 ML signals core; 2.0 AI-native decisioning | 0.00 | 2.00 | 0.00 | 0.00 |
| Transparency | 0.0 black-box; 0.5 some; 1.0 clear methodology + validation | 1.00 | 1.00 | 1.00 | 0.00 |
| AI & Algo Index Test Winners | TrendSpider 5.00 | Trade Ideas 4.50 | Tickeron 4.50 |
Alert Speed
TradingView scored AA 4.67 (High: 4.67 | Median: 3.67 | Low: 2.3). Alerts are one of TradingView’s clearest paid-plan justifications because they scale—both in volume and in practical delivery paths.
In my audit notes, I call out TradingView’s combination of high-capacity alerts (2,000) and fast delivery paths (notably webhook and app delivery). The one area where TradingView does not lead is stream richness versus TrendSpider, which is built around multi-path, automation-centric alerting.
| Metric | Calculation | TradingView Score | High | Median | Low |
|---|---|---|---|---|---|
| Alert Trigger Latency & Delivery Speed | Avg of Concurrent Alerts, Alert Streams, Alert Speed Rating | 4.67 | 4.67 | 3.67 | 2.30 |
| Concurrent Alerts | 1 point per 50 concurrent (max 5 points) | 5.00 | 5.00 | 5.00 | 5.00 |
| Concurrent Alert Count | Raw alert capacity | 2000 | 2000 | 875 | 400 |
| Alert Streams Richness | Email/webhook/SMS/app etc. 1 point per stream (max 5) | 4.00 | 5.00 | 2.00 | 1.00 |
| Alert Speed Rating | Speed rating points | 5.00 | 5.00 | 3.00 | 1.00 |
| Alert Speed Test Winners | TradingView 4.67 | TrendSpider 4.33 | Benzinga Pro 4.33 |
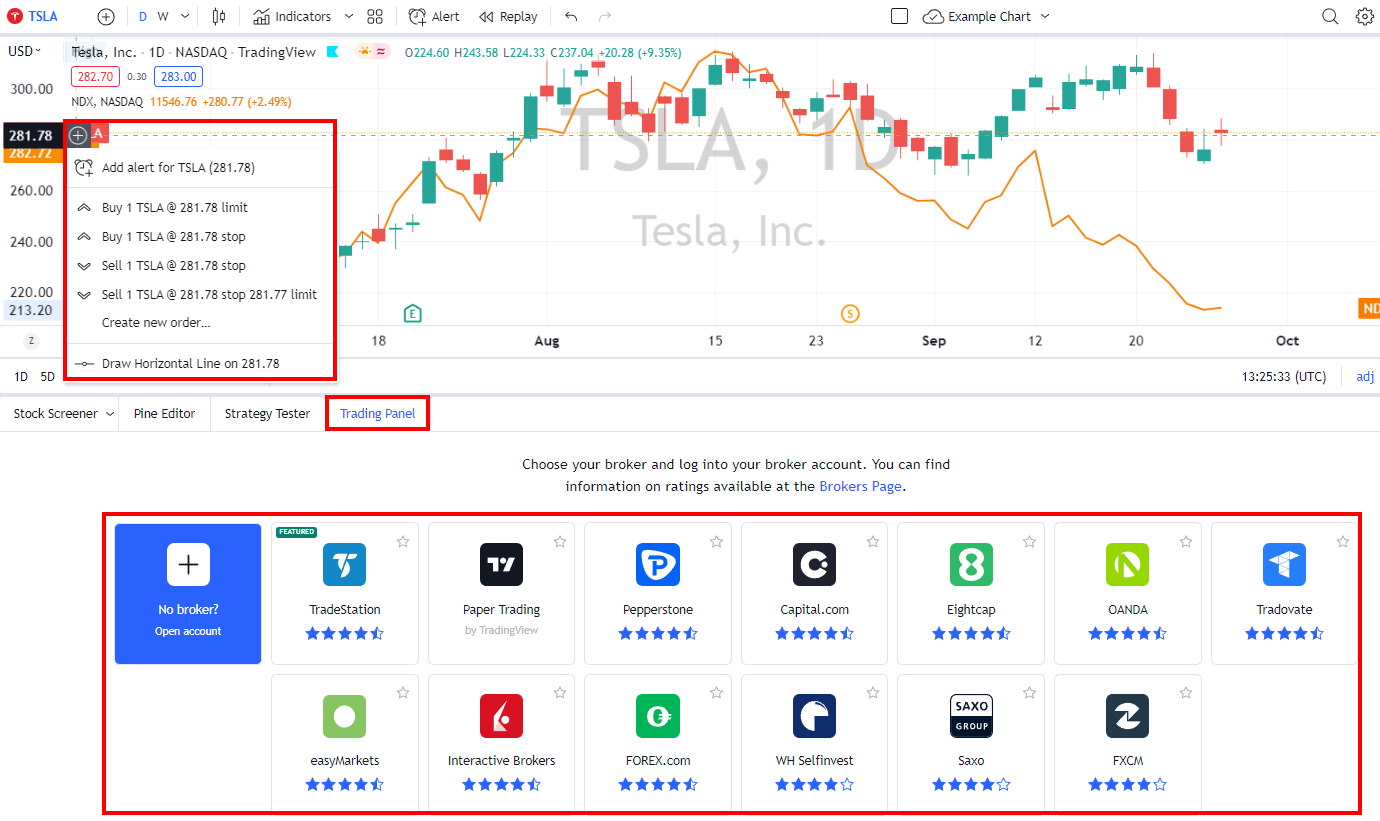
Broker Connectivity & Ecosystem Depth
TradingView scored AAA 5.00 (High: 5.00 | Median: 2.00 | Low: 0.67). This category is a major differentiator because it determines whether TradingView can be the “hub” that connects analysis to execution.
In my audit notes, I note that TradingView markets 100+ integrated brokers and positions the connection as broker-server level, but without publishing a max tested order-latency benchmark. Practically, it’s an ecosystem leader for breadth of connectivity; latency depends on the broker and route rather than a single vendor-controlled SLA.
| Metric | Calculation | TradingView Score | High | Median | Low |
|---|---|---|---|---|---|
| Asset & Data Coverage Index | Average of Live Trading, Broker Integration, Asset/Data Coverage | 5.00 | 5.00 | 2.00 | 0.67 |
| Live Trading | 5 points | 5.00 | 5.00 | 5.00 | 0.00 |
| Total number of brokers integrated | Raw broker count | 100 | 1200 | 2 | 0 |
| Broker Integration | 0.1 point per broker (max 5 points) | 5.00 | 5.00 | 0.20 | 0.00 |
| Asset & Data Coverage | Stocks, Options, FX, US Exchanges, International Exchanges (1 point each) | 5 | 5 | 2 | 2 |
| Broker Connectivity & Ecosystem Test Winners | TradingView 5.00 | MetaTrader 5.00 | TrendSpider 4.43 |
- Live trading: 5.00
- Integrated brokers (scored): 100 → 5.00 points (capped)
- Asset & data coverage: 5.00 (stocks/options/FX/U.S./international)
Context: TradingView’s ability to connect charts to execution reduces friction and the need to switch tools. The important caveat is that TradingView does not publish a “max tested order latency” figure in the inputs provided here—so latency-sensitive traders should view TradingView as a premium interface layer, not a routing-performance certifier.
TradingView pulls data from 13 American, 9 European, and 30 Asian exchanges. It also covers all major cryptocurrency exchanges, foreign exchange, and commodity futures markets.
With TradingView, you can trade stocks and indices globally and all the major and minor foreign exchange currencies. Additionally, one can trade energy, metals, agricultural futures, and all major cryptocurrencies.
- Stocks – 90% of the world’s stock markets covered.
- Forex (FX) Currencies – All the Major, Minor, and Exotic currencies covered
- Futures – Energy, Metals, Agriculture, Indices, and even Interest Rates
- Crypto Currencies – 26, including Bitcoin, Ripple, Ethereum, Bitcoin Cash
- Bonds – 30+ Government Bond Types
Community Utility Index (CUI)
TradingView scored AAA 5.00 (High: 5.00 | Median: 3.25 | Low: 1.8). This is not cosmetic. TradingView’s community is a compounding advantage because it meaningfully expands what the platform can do.
I describe TradingView as the “global standard where a massive social network meets high-level open-source coding (Pine Script).” The scores reflect that: it’s not just a big community—it produces reusable, monetizable logic (scripts/indicators/strategies) at scale.
| Metric | Calculation | TradingView Score | High | Median | Low |
|---|---|---|---|---|---|
| Community Utility Index | Average of Active Community Size & Quality of Community Contribution | 5.00 | 5.00 | 3.25 | 1.80 |
| Active Community Size | Rating scale for active users/community density | 5.00 | 5.00 | 3.00 | 2.00 |
| Quality of Community Contribution | Rating scale for quality of shared IP/code/research | 5.00 | 5.00 | 3.50 | 1.50 |
| Community Utility Index Test Winners | TradingView 5.00 | MetaTrader 5.00 | Trade Ideas 4.75 |
Context: The real value is that the community produces reusable IP: indicators, strategies, scanners, and workflows you can copy, test, and modify. Over time, that ecosystem can outperform “closed” platforms with technically strong features but weaker community momentum.
Summary
TradingView combines charting, screening, and backtesting into an innovative technical analysis trading platform. TradingView’s cloud-based software covers Stocks, Forex, Crypto, and Bonds for nearly every exchange. With a vast, active social community, TradingView is a global solution for traders.
FAQ
Is TradingView Good for Day Trading?
Yes, TradingView is a good choice for day traders. It offers broker integration for free stock trades, real-time exchange data, and powerful pattern recognition and backtesting tools.
Is TradingView Worth It?
Yes, TradingView is worth it, and 20 million active monthly users agree. TradingView is the leading global platform for financial market analysis for traders. It has powerful charts, indicators, screening, backtesting, and a competitive price.
Is TradingView Trustworthy?
Yes, TradingView is a trustworthy company that provides reliable trading software. TradingView has vigilant moderators for community content. I have been a demanding customer and partner of TradingView for six years and find the service extremely reliable.
Can you use TradingView without a broker?
Yes, you can use TradingView without a broker. TradingView connects to 51 brokers in Europe, North America, and Asia. However, you do not need a broker to use TradingView; you can instead use their Paper Trading system for practice.
Is TradingView better than MT4 or 5?
Yes, TradingView is better than MT4 and 5 for stock, crypto, and ETF traders because it offers a huge social trading community, better charts, more indicators, and global market scanning. For currency trading, MetaTrader offers better algorithmic trading.
Can you use TradingView in Europe?
Yes, TradingView is available to use in Europe. In fact, TradingView covers 52 exchanges across the globe, so TradingView can be used in the Americas, Europe, and Asia. TradingView is also very popular in India.
Hi Ron, thanks for the question, Yes, candlestick pattern recognition is available for free in the free version. Go to: Indicators -> Technicals -> Patterns and scroll down the list to get to Candlestick Patterns.
Barry
I have the free version of Trading View and could not find some of the things you discussed in your video; for example, the technical analysis stock screener, and candle stick patterns. Is that because you are using the Pro version? Where can I go to learn more about how Trading View works. I currently use Thinkorswim for charting and trading.
Thanks,
Ron
Hi Mike, I just tested it for you.
Can the screener scene for OTC only? YES
And scan OTC for intraday real time biggest gainers? YES
Does it have full Level 2 depth for OTC? NO
Barry
Can the screener scene for OTC only?
And scan OTC for intraday real time biggest gainers?
Does it have full Level 2 depth for OTC?
Hi drftr,
I think with Pine Script you can create any signals you like, it is extremely flexible. The signals will change with the chart timeframe, but also you can hard code them. Finally, I do not think you can connect to external signals.
Barry
Looks interesting… Is it possible to combine external signals from file in charts and/or PineScript for backtesting? Or is there a menu where you can enter additional data so without the need to hack the scripts on a daily or weekly base?
Hi Alvin, thanks for the question. It really depends on the exchange and the data. Some exchanges like BATS in the USA give real-time data for free, some will charge. It depends on country and exchange. If the data is freely available tradingview will not have to charge extra.
what is the time delay on these charts
Customer service even for premium accounts is terrible – very slow response times, very poor responses once they are finally received – strongly advise to consider this – if you have no queries great but when you do – prepare to get no support.
tradingview is absolutely great, so much social and great charrts thx. I signed up for premium, just what i was lookin for