Traders are increasingly utilizing automated backtesting and AI pattern-scanning software to develop customized trading strategies that give them a competitive edge.
After rigorous testing, I recommend TrendSpider, TradingView, and Finviz as the top tools for pattern recognition. They surpass humans in scanning, identifying, and analyzing charts, trendlines, and candlestick patterns.
| Tool | TrendSpider | TradingView | Finviz | Tickeron |
| Rating ? | 4.8 | 4.8 | 4.4 | 4.4 |
| Free | ✘ | ✔ | ✔ | ✔ |
| Price/m? | $54 | $214 | $0 | $14 | $28 | $56 | $0 | $25 | $0 | $250 | $125 |
| # Patterns Recognized | 150 | 44 | 40 | 40 |
| Pattern Backtesting? | ✔ | ✔ | ✔ | ✔ |
| Automated Trendlines? | ✔ | ✘ | ✔ | ✔ |
| Exchanges | USA | Global | USA | USA |
| Fundamental Screening? | ✔ | ✔ | ✔ | ✔ |
| Trading Community? | ✘ | ✔ | ✘ | ✘ |
| Multi Timeframe Analysis | ✔ | ✘ | ✘ | ✘ |
| Candlestick Pattern Recognition? | ✔ | ✔ | ✔ | ✔ |
| Market Scanning? | ✔ | ✔ | ✔ | ✔ |
| Backtesting? | ✔ | ✔ | ✔ | ✔ |
| News Feed? | ✘ | ✔ | ✔ | ✘ |
| Real-Time News Feed | ✘ | ✘ | ✘ | ✘ |
| ✂ Discounts ✂ | Code "LST30" for 30% to 63% Off | -17% on yearly plan + $15 Discount | 37% Discount on Yearly Plan | 50% Discount on Yearly Plan |
5 Best Candlestick & Pattern Recognition Tools
- TrendSpider: Winner Best Pattern Recognition Software
- TradingView: Best Free Candle Pattern Analysis Software
- Finviz: Best Free Stock Chart Pattern Scanner
- Tickeron: AI Stock Chart Pattern Recognition
- MetaStock: Top Candle Pattern Trading Strategy
Winners Head-to-head Comparison
TrendSpider offers excellent automated trend, chart, and candlestick pattern recognition in multiple timeframes. TradingView has the best free candlestick chart recognition globally. MetaStock offers a powerful candlestick trading system with win/loss probabilities.
Automatic pattern recognition software utilizes algorithms to identify patterns in numerical data. There are two types of chart patterns: price patterns, such as a Double Top, or candle patterns, like a Doji.
Candlestick patterns are particularly challenging to identify; our five highlighted platforms excel at this task better than humans and are accessible to retail investors.
Japanese candlestick charting theory aims to predict future price movements of assets by analyzing the market’s supply and demand. Hundreds of candlestick patterns are challenging to learn and identify, making pattern recognition algorithms crucial.
1. TrendSpider: Winner Best Pattern Recognition Software
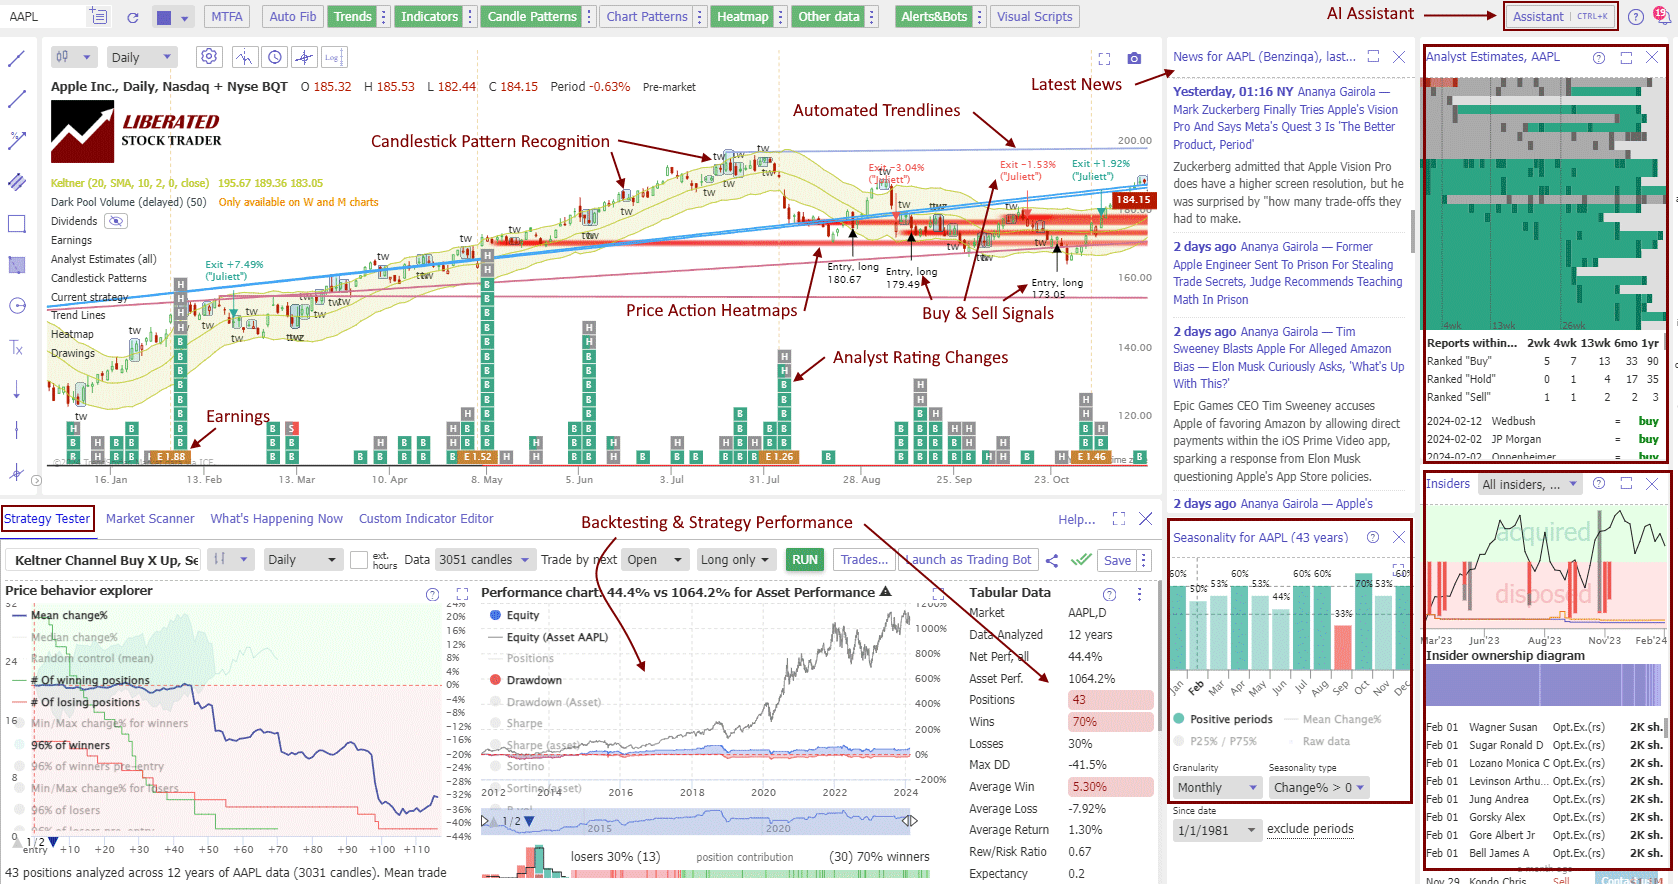
TrendSpider wins because it provides automated scanning and recognition for trendlines, candlesticks, price patterns, and Fibonacci. Plus, you can backtest and trade these patterns with automated bots and broker integration.
TrendSpider instantaneously detects stock chart support and resistance trendlines, 150 candlesticks, and Fibonacci numbers on multiple timeframes. Its automation allows automated market scanning, news scanning, and financial and technical screening across entire exchanges.
My research reveals that TrendSpider is an excellent choice for US traders seeking AI-driven tools for charting, pattern recognition, and backtesting across stocks, indices, futures, and currencies. The platform stands out by automatically detecting trendlines, Fibonacci levels, and candlestick patterns. With its robust backtesting capabilities and multi-timeframe analysis, TrendSpider is particularly well-suited for seasoned technical traders looking to refine their strategies.
| Test | Tier | Score | Average |
|---|---|---|---|
| Composite Lab Performance Score | AAA | 4.72 | 4.21 |
| Pricing Index: $ per Day | A | $2.70 | $2.74 |
| Value Score (VP) | A | 4.17 | 2.82 |
| Speed & Ease of Use | AA | 4.67 | 4.50 |
| Chart Analysis Depth Index | A | 4.03 | 3.17 |
| Chart Pattern Depth & Accuracy | AAA | 4.88 | 2.73 |
| Scanning Performance | AA | 4.67 | 3.38 |
| Backtesting Performance | AAA | 4.88 | 3.38 |
| Trading Bot & Auto-Trading Reliability | AA | 4.50 | 2.50 |
| AI & Algo Index | AAA | 5.00 | 2.00 |
| Alert Speed | AA | 4.33 | 3.67 |
| Trade Signal Quality | C | 0.00 | 0.00 |
| Broker Connectivity & Ecosystem Depth | AA | 4.43 | 1.55 |
| Portfolio Tool Performance | C | 2.10 | 2.80 |
| Financial News Speed & Depth | AA | 4.50 | 2.30 |
| Community Utility Index (CUI) | B | 3.75 | 3.25 |
| Support Infrastructure & SLA Audit | AA | 4.50 | 3.75 |
Tested using rating system V3.
See the 2026 v3 58-point TrendSpider test and benchmarking.
Pros
✔ 150+ chart and candle patterns recognized
✔ True AI Model Training & Deployment
✔ AAA Point-and-click backtesting
✔ Auto-trading bots
✔ Multi-timeframe analysis
✔ Real-time data included
✔ US Stocks, ETFs, Forex, Crypto, & Futures
✔ Seasonality charts, options flow
✔ News & analyst ratings change scanning
✔ 1-on-1 training included
Cons
✘ Not ideal for value or dividend investors
✘ No social community or copy-trading
✘ Limited portfolio management tools

TrendSpider stands out by leveraging AI and machine learning to streamline traders’ workflow, bringing automated trend and pattern recognition to the forefront. With TrendSpider, traders gain access to advanced analysis and strategy-testing capabilities, surpassing manual efforts in both scale and efficiency.
Save 38% to 45% on TrendSpider
Our Top Rated 4.72 ⭐ Trading Tool
✅ Leader in AI Trading & Chart Pattern Recognition
✅ Scanning & Auto-Trading
Deal Ends In:
| ⚡ Features ? | Charts, Watchlists, Screening, Free Real-time Data |
| 🏆 Unique Features ? | AI Automated Trendlines, Fibonacci, Candlestick Pattern Recognition, Auto-Bot Trading, Code-free Powerful Backtesting, Launch and Train Personal AI Models with Strategy Lab. |
| 🎯 Best for | Stock, Options, FX & Crypto Traders |
| ♲ Subscription | Monthly, Yearly |
| 💰 Price | $54 | $214 |
| 💻 OS | Web Browser |
| 🎮 Trial | ❌ |
| ✂ Discount | Code "LST30" for 30% to 63% Off |
| 🌎 Region | USA |
All TrendSpider plans include real-time data, futures, AI-powered pattern recognition, backtesting, news, options, crypto, and even automated bot trading with broker integration.
- The Standard plan gives access to all features for $82 per month, which drops to $54 if you pay yearly.
- I recommend Premium, which costs $137 and drops 44% to $91 if you pay yearly.
- Adding our partner code LST30 during checkout will save an additional 30% on your first year.
| TrendSpider Pricing | Monthly | Monthly on Annual Plan |
| Standard (Casual Traders) | $82 | $54 |
| Premium (Active Traders) | $137 | $91 |
| Enhanced (Scalpers & Day Traders) | $197 | $122 |
| Advanced (Quants & Institutions) | $321 | $214 |
| Additional Year 1, 30% Discount | -30% With Code LST30 | |
TrendSpider Coupon Code Discount
Trendspider discount coupon code “LST30” is verified and valid for 2025. It grants a 30% discount on all plans. Use coupon code “LST30” at checkout.
Using this coupon on a TrendSpider monthly subscription could save you over $2,400.
- Read this article for a step-by-step guide to claiming your 30% TrendSpider discount.
TrendSpider’s most powerful features are automated candlestick, trendline, and chart pattern recognition. Point-and-click backtesting and strategy development automatically plot buy and sell signals onto the chart. TrendSpider can even scan and backtest financial news, analyst estimates, rating changes, and insider trading.
Real-time Candlestick Charts Pattern Recognition
TrendSpider’s real-time candlestick charting recognizes 150+ patterns, which can be used for backtesting and auto-trading with Bots. It is designed to do the hard work for you, but what makes it special is that it can detect these patterns automatically across multiple timeframes, on intra-day and daily/weekly charts.
TrendSpider shows you candlestick patterns by highlighting them on a chart with descriptions. Select Patterns -> All Patterns -> Candlesticks.
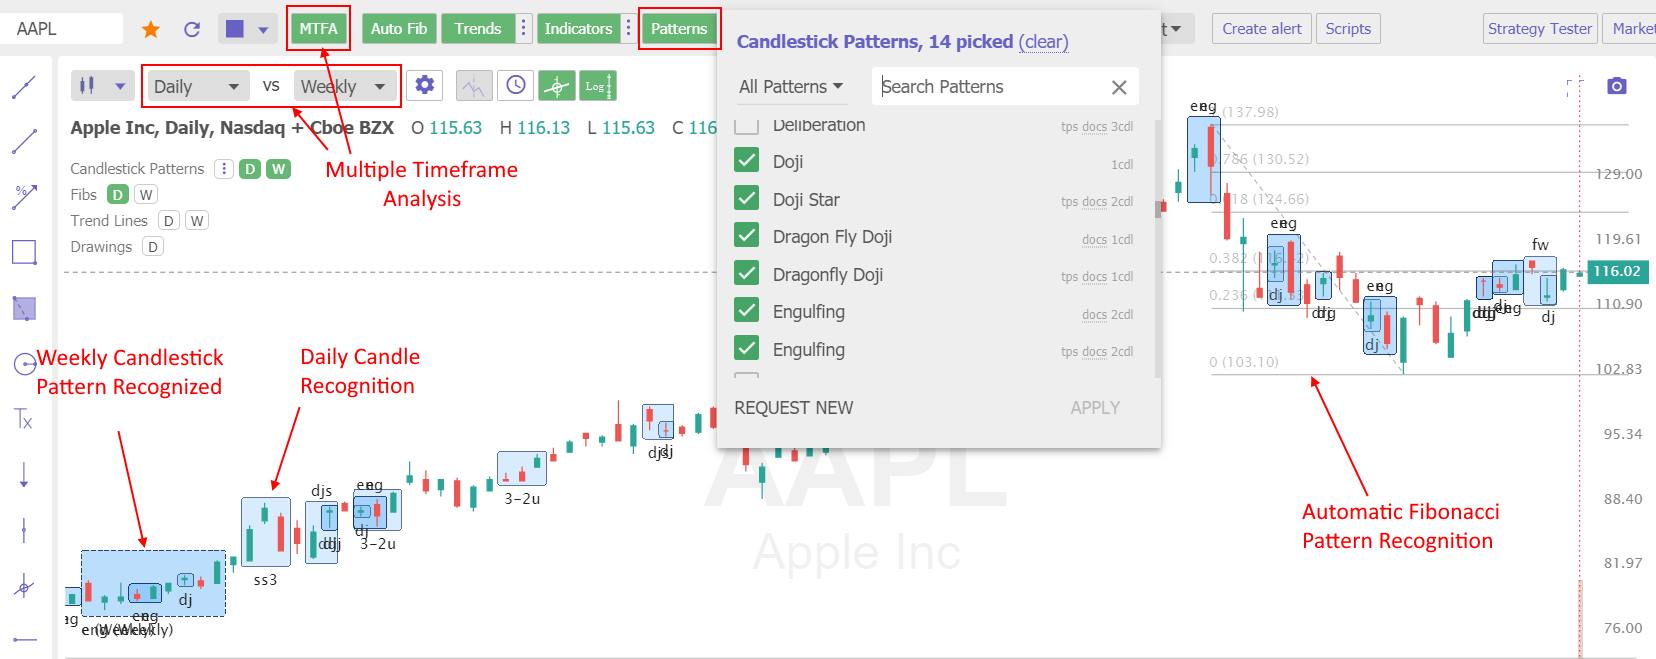
These are enough to start with and are very powerful candlestick reversal signs. On the chart above, you can see the annotated candlestick Pattern “DJ” for Doji, etc.
In the image above, you can see the patterns recognized on a weekly chart versus the daily Candlestick patterns. Of course, TrendSpider allows you to change the timeframes to 1 minute, 1 hour, or any other combination if you prefer to trade in short timeframes.
You do not need to spend months learning every pattern or hours on a chart to locate them; it is all seamlessly done for you.
Trendline Pattern Recognition With TrendSpider.
TrendSpider’s automated trendline detection and plotting do a better job than a human can; using algorithms, the system can detect thousands of trendlines and flag the most important ones with the highest backtested probability of success.
Multi-time-frame analysis means viewing multiple time frames on a single chart with the trendlines plotted automatically. Another great feature is the advanced plotting of support and resistance lines into a subtly integrated chart heatmap.
Packed full of innovative technical analysis tools, TrendSpider catapults to the top of this list. If you are a serious market analyst, TrendSpider will help you do the job more quickly, with higher quality, and without missing an opportunity.
Finally, Raindrop Charts are a unique and intuitive way to visualize volume profile or volume at price action.
Strategy Backtesting.
TrendSpider is our winner for integrated trendline, pattern, and indicator backtesting. It shows the win rate, profitability, and drawdown. The team has propelled TrendSpider into one of the leading technical analysis packages in the industry.
I have personally backtested hundreds of indicators and chart patterns with TrendSpider, and you can see the analysis and techniques I have used.
Market Scanner
TrendSpider’s market scanner lets you scan the entire market for stocks matching your technical criteria (see screenshot below). This is a significant step forward, combining AI trend detection and analysis with the ability to scan the whole stock market.
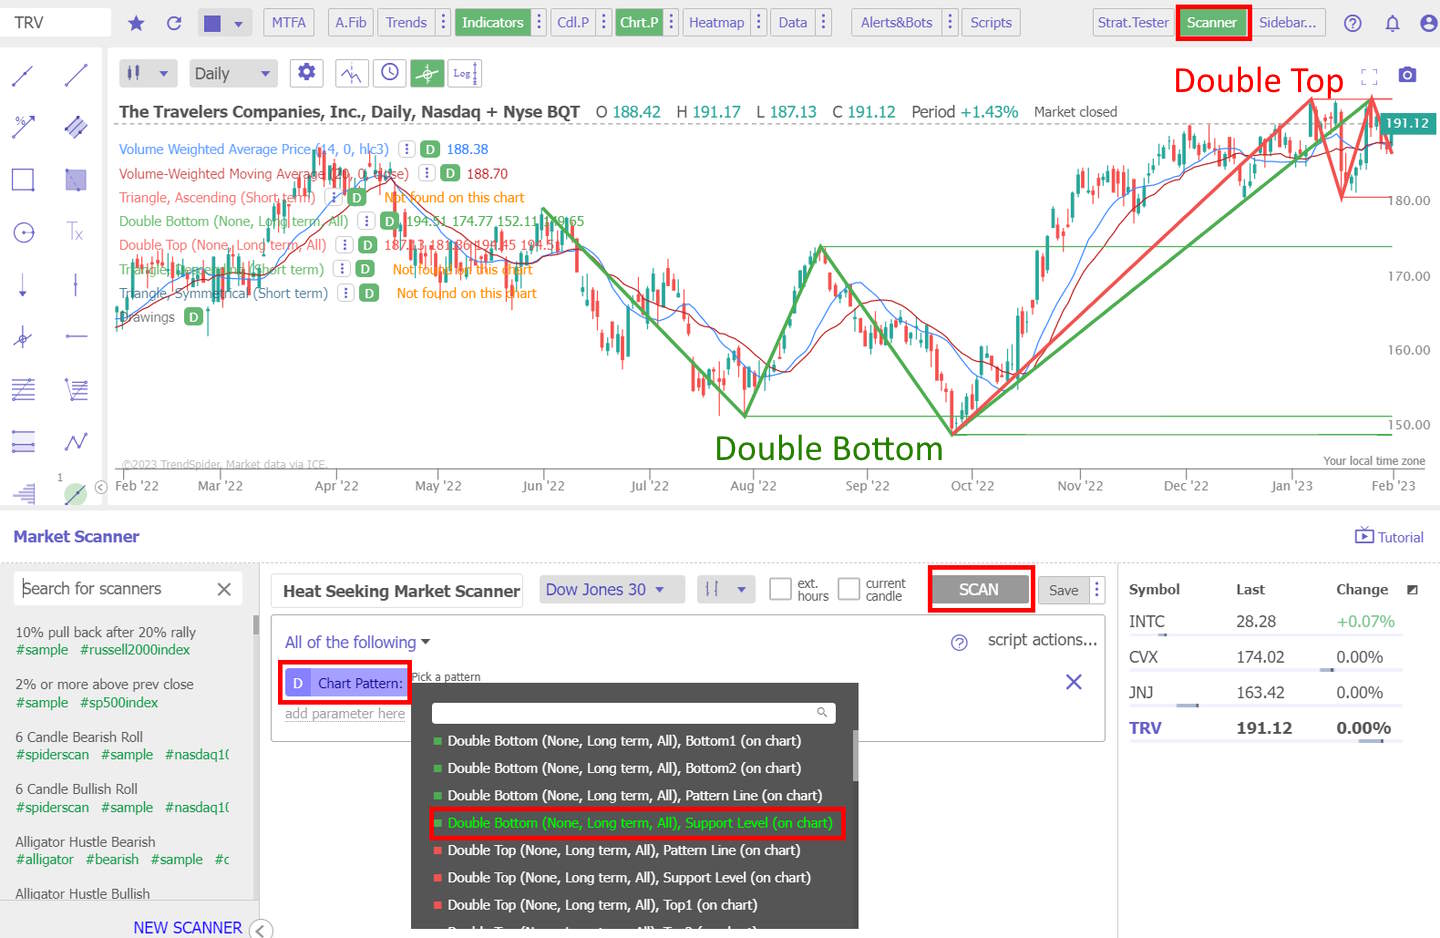
The market scanner is a very powerful feature that lets you scan the Nasdaq 100 for a double-top stock chart pattern, Doji candlestick pattern, or any mix of multiple patterns.
For more information, read our: TrendSpider Test: AI, Automation, Backtests & Results
2. TradingView: Best Free Candle Pattern Analysis
TradingView offers free automated candlestick chart recognition for 39 patterns. The candlestick pattern recognition works globally on stocks, ETFs, Forex, and cryptocurrencies. TradingView has the largest trading community and powerful backtesting, which is a perfect combination.
TradingView is the world’s premier trading platform, trusted by over 20 million active traders. It offers a seamless blend of powerful charting tools, advanced screening features, and in-depth analysis, covering a wide range of assets, including stocks, indices, ETFs, and cryptocurrencies.
| Test | Tier | Score | Average |
|---|---|---|---|
| Composite Lab Performance Score | AAA | 4.75 | 4.21 |
| Pricing Index: $ per Day | AA | $1.97 | $2.74 |
| Value Score (VP) | AA | 4.37 | 2.82 |
| Speed & Ease of Use | AAA | 5.00 | 4.50 |
| Chart Analysis Depth Index | AAA | 5.00 | 3.17 |
| Chart Pattern Depth & Accuracy | B | 3.98 | 2.73 |
| Scanning Performance | AAA | 4.83 | 3.38 |
| Backtesting Performance | A | 4.19 | 3.38 |
| Trading Bot & Auto-Trading Reliability | B | 3.50 | 2.50 |
| AI & Algo Index | B | 3.00 | 2.00 |
| Alert Speed | AA | 4.67 | 3.67 |
| Trade Signal Quality | C | 2.50 | 0.00 |
| Broker Connectivity & Ecosystem Depth | AAA | 5.00 | 1.55 |
| Portfolio Tool Performance | B | 3.60 | 2.80 |
| Financial News Speed & Depth | B | 3.00 | 2.30 |
| Community Utility Index (CUI) | AAA | 5.00 | 3.25 |
| Support Infrastructure & SLA Audit | B | 3.25 | 3.75 |
Tested using benchmarking system v3.
See the 2026 v3 58-point TradingView test and benchmarks.
Pros
✔ 20 million users sharing ideas
✔ AAA Speed & ease of use
✔ Trading from charts
✔ Powerful screening and technical analysis
✔ All stock exchanges globally
✔ AAA Broker connectivity and asset coverage
✔ 100,000+ user-generated strategies
✔ Free and low-cost plans
✔ Flexible backtesting with Pine Script
Cons
✘ Not ideal for value or dividend investors
✘ Coding skills required for backtesting and custom indicators
✘ Average portfolio tools
TradingView provides best-in-class technical analysis tools to analyze financial markets. It offers heatmaps, super charts, indicators, strategy development tools, and backtesting capabilities.
Its vibrant community of traders shares ideas, strategies, and custom indicators, making it an invaluable resource for learning and collaboration.
| ⚡ TradingView Features ? | Charts, News, Watchlists, Screening, Chart Pattern & Candlestick Recognition, Full Broker Integration |
| 🏆 Unique Features ? | Trading, Backtesting, Community, Global Stock, FX & Crypto Markets, Webhook Bot Integration |
| 🎯 Best for | Stock, FX & Crypto Traders |
| ♲ Subscription | Monthly, Yearly |
| 💰 Price | $0 | $14 | $28 | $56 |
| 🆓 Free | ✔ |
| 💻 OS | Web Browser|PC|IOS|Android |
| 🎮 Trial | Yes, Free 30-Day Premium |
| ✂ Discount | -17% on yearly plan + $15 Discount |
| 🌎 Region | Global |
I love TradingView and use it every single day. I regularly post charts, ideas, and analyses, and chat with other traders. You can scan for patterns and backtest on TradingView for free; however, there are limitations.
Also, a huge benefit is that the data speed and coverage are mind-blowing. They cover literally every stock market on the planet, including stocks, ETFs, mutual funds, futures, Forex, bonds, and cryptocurrencies, AT NO EXTRA COST.
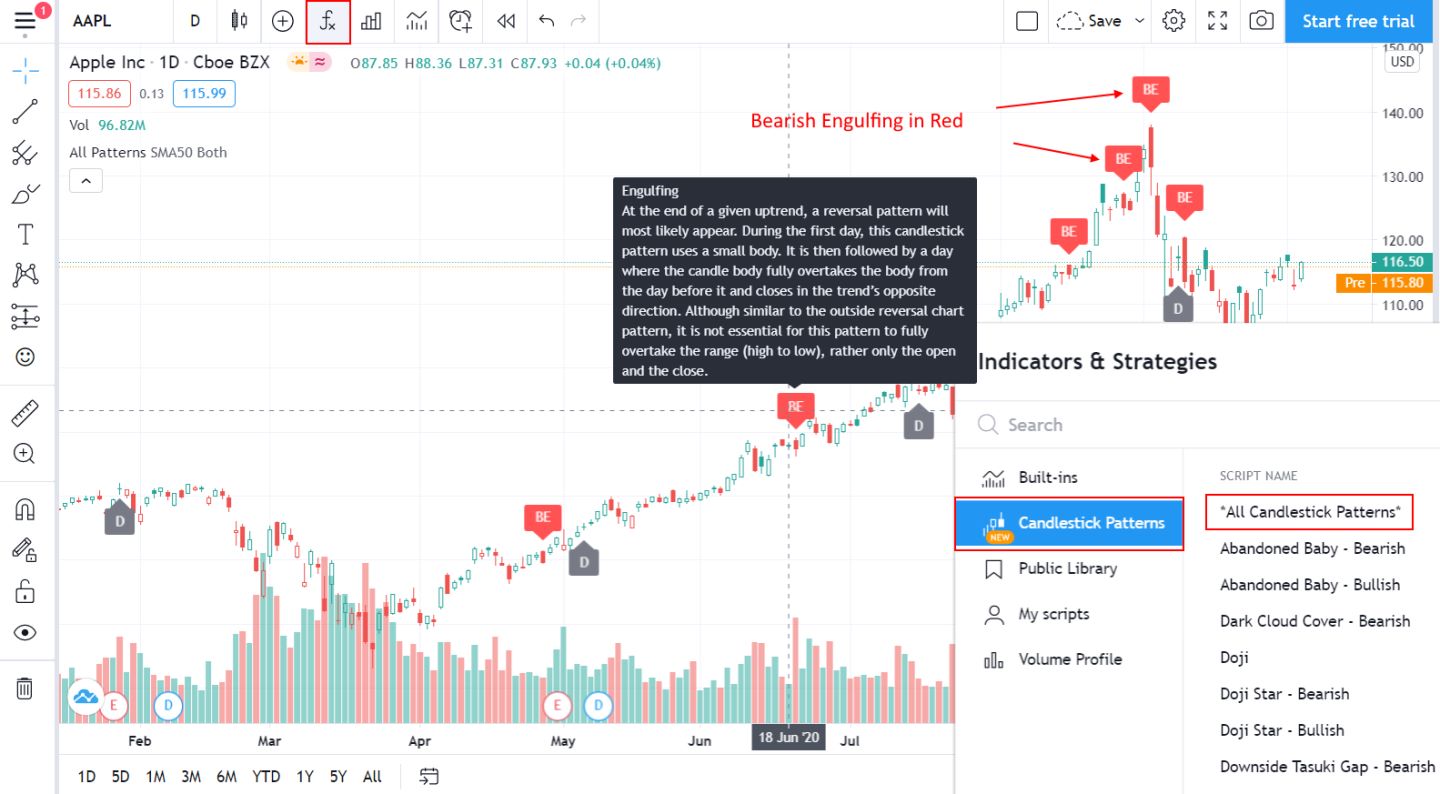
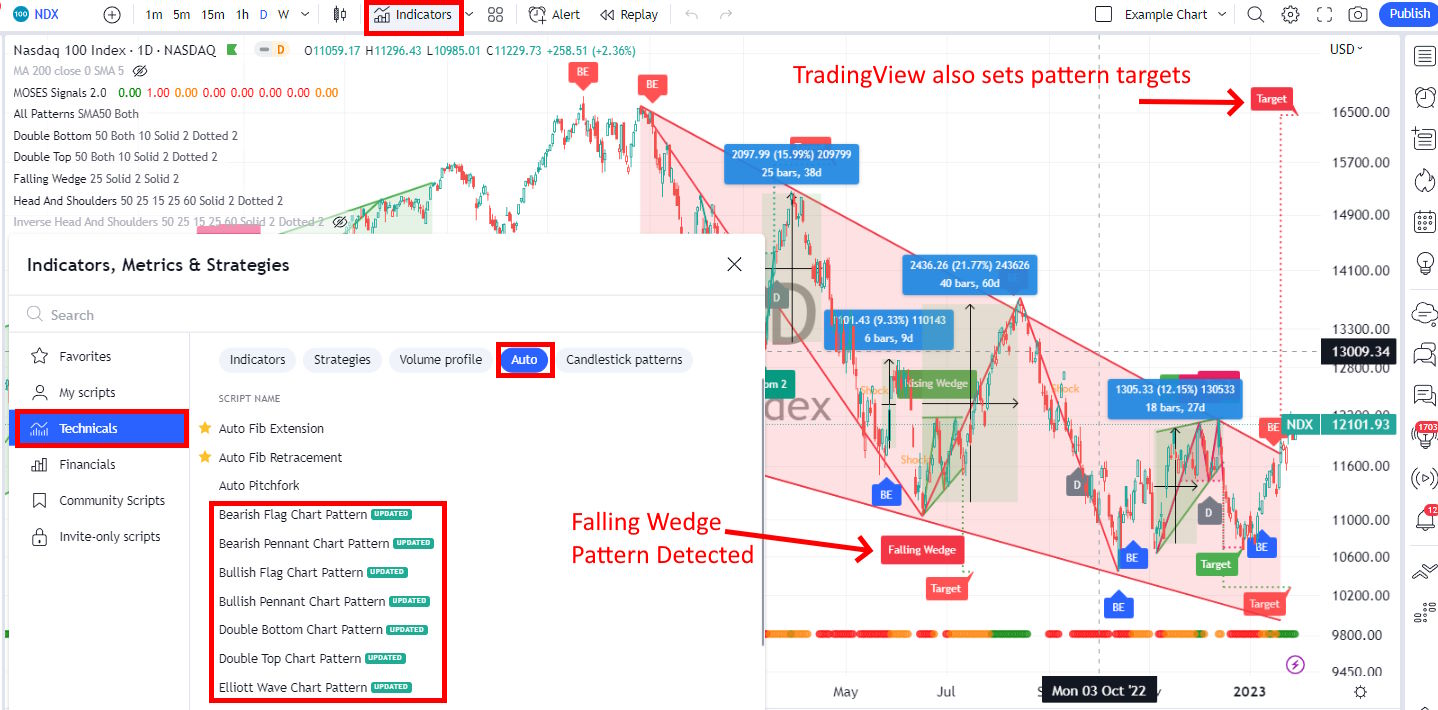
Candle Pattern Recognition
Candlestick pattern recognition is a core component of TradingView, which means you do not have to pay anything extra for a plugin; it is simply there. Because TradingView has a free service tier, you get candlestick analysis for free.
In the image below, you can see that pattern recognition is intelligently implemented. The Bearish Engulfing (BE) patterns are highlighted in Red, with an arrow pointing downward, suggesting that this candle is a bearish sign. You can also observe that the Doji (D) patterns are grey and pointing upwards, indicating a possible price direction change.
Finally, I like that you can hover your mouse over the pattern and get a full and detailed explanation of its meaning.
How to Enable Candlestick Recognition in TradingView.
- Click on the Fx (Function Symbol) at the top of the page.
- Select Candlestick Patterns
- Select All Patterns or the specific patterns you want to see
Fundamental Scanning & Screening. TradingView hits the mark on real-time scanning, filtering, and fundamental watchlists. The list of fundamentals you can scan and filter on is genuinely huge. Any idea you have based on fundamentals will be covered. They even have enormous amounts of economic data like Federal Funds Rates and World Economic Growth, thanks to a connection to the QUANDL database.
News & Social Community. As soon as you connect to TradingView, you realize this has also been developed for the community. You can look at community ideas, post your charts and ideas, and join countless groups covering everything from bonds to cryptocurrency. The news feeds are fully integrated, including Kiplinger, DailyFX, Futures Magazine, FXStreet, and StockTwits. Add that to the social network, and you have a great solution. The news service is only second to MetaStock with their Reuters Feeds.
Technical Analysis. With over 160 different indicators and unique specialty charts, such as LineBreak Charts, Kagi Charts, Heikin Ashi Charts, Point & Figure Charts, and Renko Charts, you have everything you will need as an advanced trader. With the Premium membership, you also get fully integrated Level II insight.
How to Enable TradingView Price Pattern Recognition
- Click on Indicators -> Technicals -> Auto -> Select one or more chart patterns.
Systems, BackTesting & Automated Trading.
TradingView has an active community of developers and sellers of stock analysis systems. With the premium-level service, you can create and sell your own. The community also offers many indicators and systems for free.
The only thing you cannot do is forecast and implement robotic trading automation. For forecasting, you are better off with MetaStock. Within 5 minutes, I used TradingView; no credit card, installation, or configuration of the data feed was required; it was just there. TradingView works with a single click.
For more information, read our: TradingView Full Test, Ranking & Benchmarks
3. Finviz: Best Free Stock Chart Pattern Scanning
Finviz provides good heatmaps, stock screening, and chart pattern recognition for free. Finviz uniquely lets investors visualize vast stock market data on a single screen.
After hands-on testing, I found Finviz to be a powerful free stock screener, with swift market heatmaps and impressive stock chart pattern recognition.
Thanks to ongoing enhancements to its charting capabilities, Finviz remains a relevant and powerful tool in stock analysis. Through my testing, I found Finviz to be an exceptional free resource, offering intuitive heatmaps, speedy stock screening, and seamless chart pattern recognition.
| Test | Tier | Score | Average |
|---|---|---|---|
| Lab Test Composite Score | B | 3.84 | 4.21 |
| Value Score (VP) | C | 1.74 | 2.82 |
| Speed & Ease of Use | AAA | 4.83 | 3.75 |
| Chart Analysis Depth Index | C | 1.54 | 3.17 |
| Chart Pattern Depth & Accuracy | C | 2.73 | 2.73 |
| Scanning Performance | C | 2.26 | 3.38 |
| Backtesting Performance | C | 2.75 | 3.38 |
| Trading Bot & Auto-Trading Reliability | C | 2.00 | 2.50 |
| AI & Algo Index | C | 2.00 | 2.00 |
| Alert Speed | B | 3.67 | 3.67 |
| Trade Signal Quality | C | 0.00 | 0.00 |
| Broker Connectivity & Ecosystem Depth | C | 0.67 | 2.00 |
| Portfolio Tool Performance | C | 2.50 | 2.80 |
| Financial News Speed & Depth | C | 1.50 | 2.30 |
| Community Utility Index (CUI) | C | 1.75 | 3.25 |
| Support Infrastructure & SLA Audit | C | 1.25 | 3.75 |
Tested using rating system v3.
See the 2026 v3 58-point Finviz test and benchmarks.
Pros
✔ 67 stock screening metrics
✔ 33 Chart Patterns Recognized
✔ Intraday (1-minute) data with Finviz Elite
✔ One of the best free stock screeners
✔ Good insider trading/news service
✔ Fast heatmaps for sector & industry visualizations
✔ Integrated news aggregation
✔ Backtesting recognizes 102 chart patterns
Cons
✘ Elite Backtesting Could Be More Flexible
✘ 21 chart indicators
✘ No app for Android or iPhone
✘ No Community
✘ Support & SLA
For those seeking more advanced features, Finviz Elite delivers value at $299 per year, providing real-time data and robust backtesting tools.
Finviz’s elite service provides real-time market data and enables up to 24 years of backtesting across multiple combinations of 102 technical indicators. Finviz is designed for individual investors, enabling them to screen for stocks, see which are on the move, and track their performance in real time.
| ⚡ Finviz Features ? | Screening, Heatmaps, Charts |
| 🏆 Exceptional Features ? | Patterns, Signals, Auto-Trendlines |
| 🎯 Best for | Beginner Investors/Traders |
| ♲ Subscription | Monthly, Yearly |
| 💰 Price | $0 | $25 |
| 🆓 Free Plan | ✔★ |
| 💻 OS | Web Browser |
| 🎮 Trial | 30-Day Money-Back |
| ✂ Discount | 37% Discount on Yearly Plan |
| 🌎 Region | US |
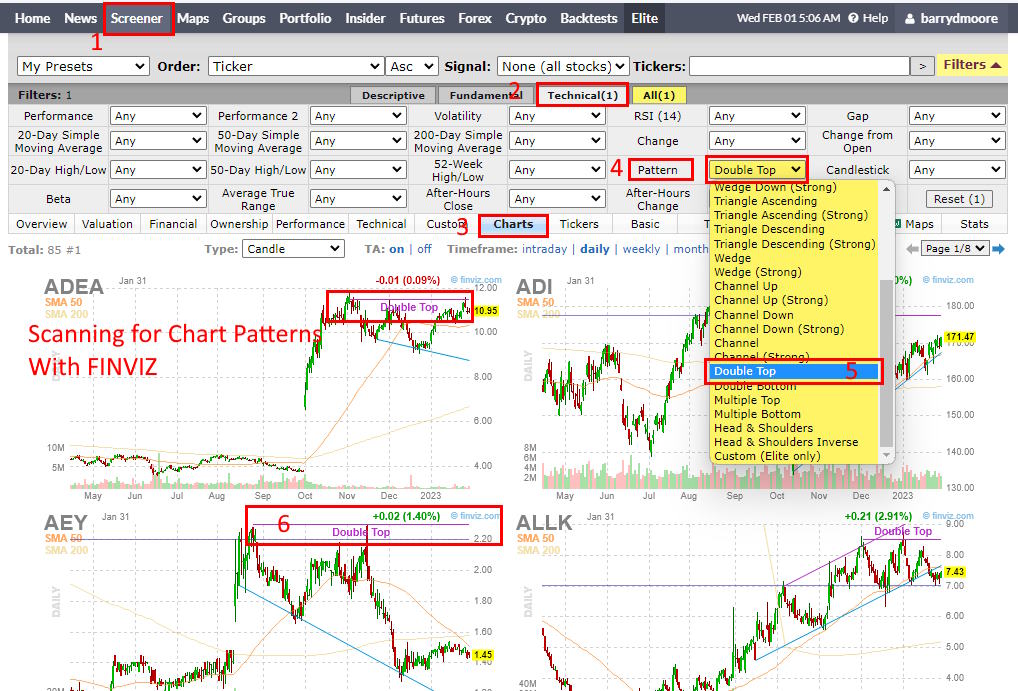
Finviz enables you to scan for 40 different stock chart patterns and candlesticks. Finviz is easy to use, and with a few clicks, you can screen for stock chart patterns across the US stock markets.
To scan for chart patterns with Finviz, follow these steps.
- Visit Finviz > 1. Click Screener -> 2. Select Technicals -> 3. Click Charts -> 4. Open Patterns Drop Down Menu -> Select Your Patterns
I was very excited to try the Finviz backtesting service, and after six hours of working on strategies with the Finviz backtester, I was impressed. The backtester offers over 100 unique indicators and automatically detects stock chart patterns to help you build a truly unique system. The screenshot below shows a snippet of the available pattern recognition criteria. Now I am excited.
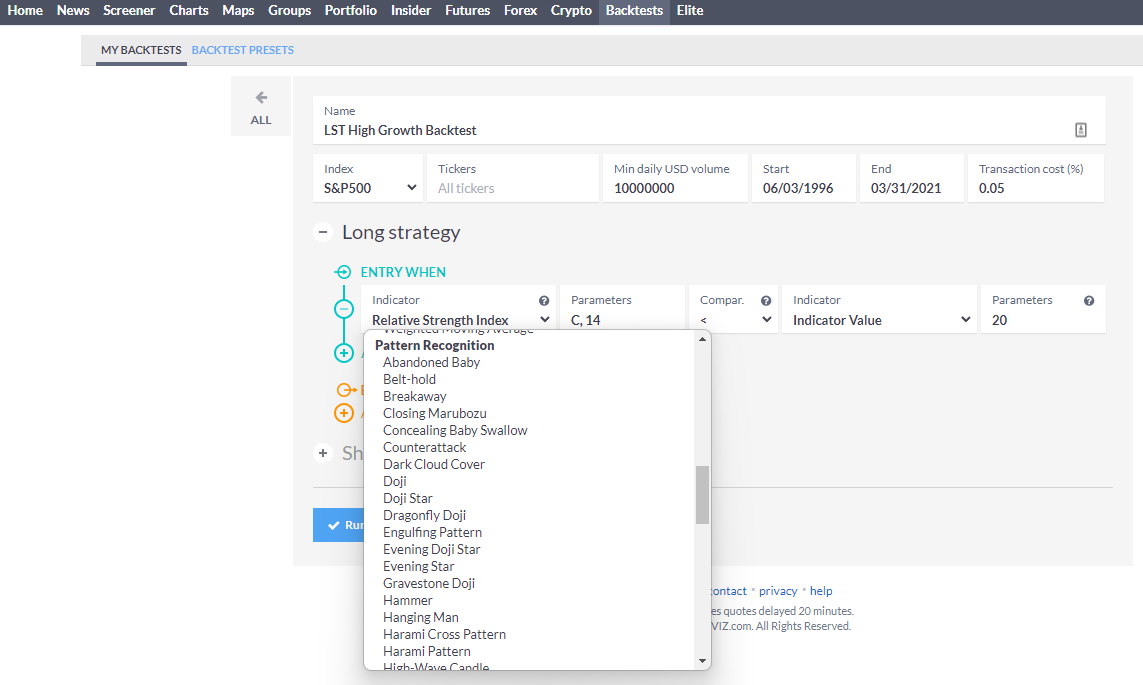
Finviz Elite Review: Building a Successful Backtested System
The Finviz Backtester offers over 100 unique indicators and automatically detects stock chart patterns to help build a truly unique system. After all this work, I created a system based on the Money Flow Index that has handsomely beaten the S&P 500 index over the last 24 years.
The system returned a profit of 1,588%, with a compounded annual return (CAGR) of 15.24% versus the S&P 500 of 10.86%. See the proof below.
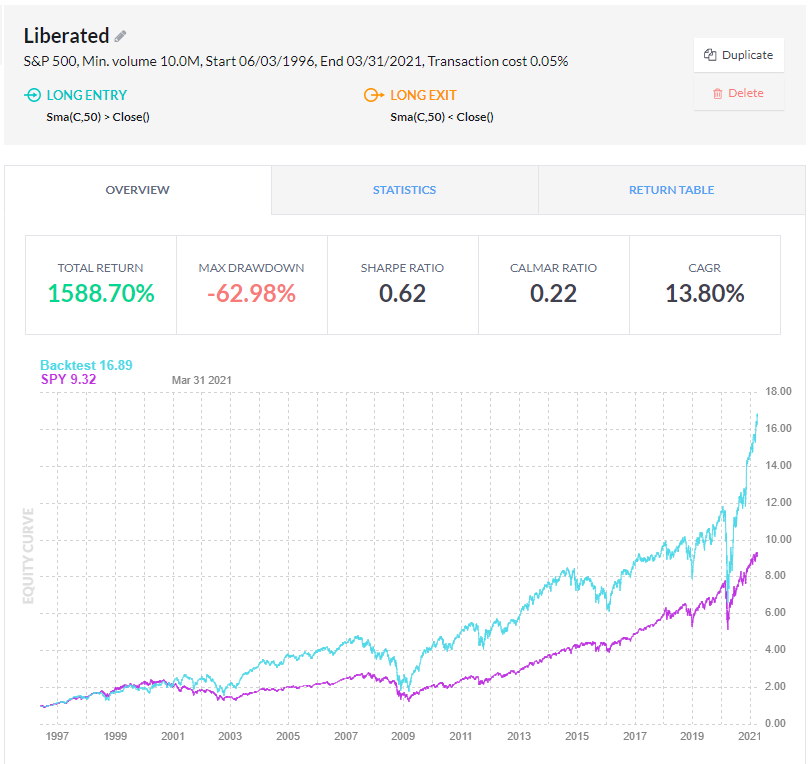
In any case, Finviz Free provides excellent stock chart pattern recognition, and FinViz Elite provides powerful backtesting.
For further information, read: Finviz Lab-Test, Rating & Benchmarks vs. Competition
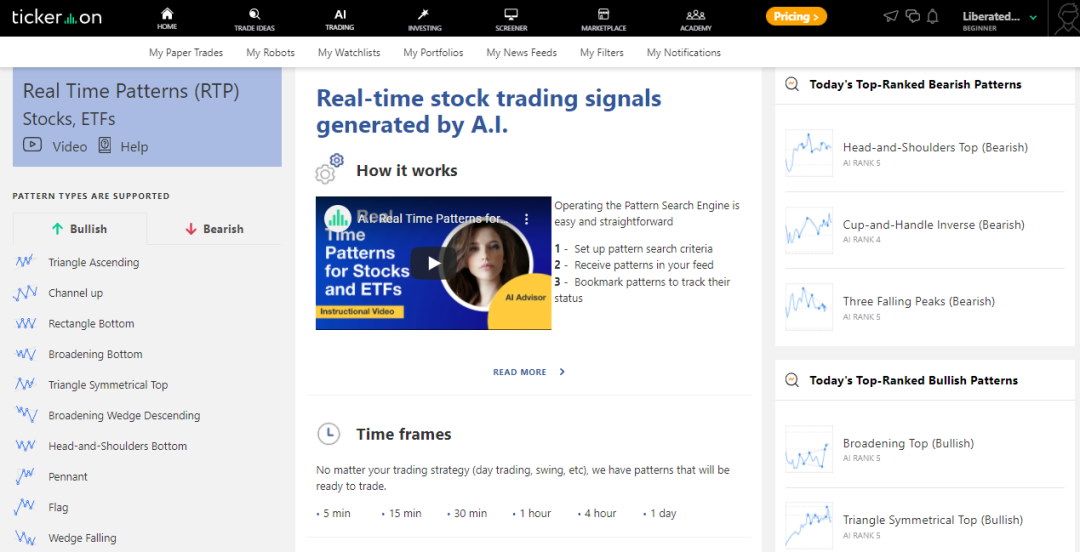
4. Tickeron: AI Stock Chart Patterns Recognition
Tickeron has impressive AI-powered chart pattern recognition and prediction algorithms for stocks, ETFs, Forex, and Crypto. Tickeron also has thematic model portfolios, specific pattern-based trading signals, success probability, and AI confidence levels.
My Tickeron testing confirms impressive AI-powered chart pattern recognition and prediction algorithms for stocks, ETFs, Forex, and Cryptocurrencies. Tickeron provides reliable thematic model portfolios, specific pattern-based trading signals, success probability, and AI confidence levels.
| Test | Tier | Score | Median |
|---|---|---|---|
| Lab Test Composite Score (CLPS) | A | 4.19 | 4.21 |
| Pricing Index: $ per Day | A | $4.11 | $2.74 |
| Value Score (VP) | B | 3.26 | 2.82 |
| Speed & Ease of Use | AAA | 4.83 | 4.50 |
| Chart Analysis Depth Index | C | 0.77 | 3.17 |
| Chart Pattern Depth & Accuracy | B | 3.43 | 2.73 |
| Scanning Performance | C | 2.05 | 3.38 |
| Backtesting Performance | C | 1.88 | 3.38 |
| Trading Bot & Auto-Trading Reliability | A | 4.00 | 2.50 |
| AI & Algo Index | AA | 4.50 | 2.00 |
| Alert Speed | A | 4.00 | 3.67 |
| Trade Signal Quality | AAA | 5.00 | 0.00 |
| Broker Connectivity & Ecosystem Depth | B | 3.17 | 2.00 |
| Portfolio Tool Performance | B | 3.00 | 2.80 |
| Financial News Speed & Depth | C | 2.80 | 2.80 |
| Community Utility Index (CUI) | C | 2.75 | 3.25 |
| Support Infrastructure & SLA Audit | C | 2.75 | 3.75 |
Pros
✔ 45 Streams of Trade Ideas
✔ AAA 5.00 Trade Signals
✔ Real-Time Pattern Recognition for Stocks, ETFs, Forex, and Crypto
✔ AI Trend Prediction Engines
✔ Investing Portfolios with Audited Track Records
✔ Build Your Portfolios with AI
Cons
✘ Custom Charting Limited
✘ Cannot Plot Indicators
✘ Complicated Pricing
Tested using benchmarking system v3.
See the 2026 v3 58-point Tickeron test and benchmarks.
Tickeron’s trading platform is unique and innovative. It combines artificial intelligence and human intelligence based on the community of traders, so you can compare what humans think versus what machines think.
| ⚡ Tickeron Features ? | Portfolios, Watchlists, Screening, 45 Streams of Trade Ideas |
| 🏆 Unique Features ? | Real-time AI Trading Signals for ETF, Forex & Crypto & Pattern Recognition, AI Portfolios |
| 🎯 Best for | Day & Swing Traders |
| ♲ Subscription | Monthly, Yearly |
| 💰 Price | $0 | $250 | $125 |
| 💻 OS | Web Browser, PC |
| 🎮 Trial | 14-Day Free Trial |
| ✂ Discount | 50% Discount on Yearly Plan |
| 🌎 Region | USA |
At the heart of Tickeron is its AI algorithms’ ability to spot 40 different stock chart patterns in real-time. You can select which pattern you want to trade, and it will filter stocks, Forex, or cryptocurrencies that currently show it. Patterns are split into bullish patterns for long trades or bearish patterns for those who wish to go short.
Tickeron’s real-time pattern recognition is particularly useful for swing or day traders, where market timing is the top priority. Tickeron can also scan the entire market and suggest which patterns work best on a particular day. In the screenshot above, you can see “Today’s Top Ranked Patterns,” which rates the potential success of the patterns based on the market’s current trading activity.
Ultimately, pattern recognition saves pattern traders a lot of work hunting for potential trade setups because it does all the work for them.
Trading Signals & Prediction
Tickeron has implemented a powerful feature called AI Confidence Level. Based on the stock’s history, the success rate of a particular pattern, and the market’s current direction, Tickeron can assign a confidence level to a trade prediction.
The screenshot below shows that the Tickeron AI predicts that ABUS has an 88% chance of declining in value and ACET has an 81% chance of increasing in value.
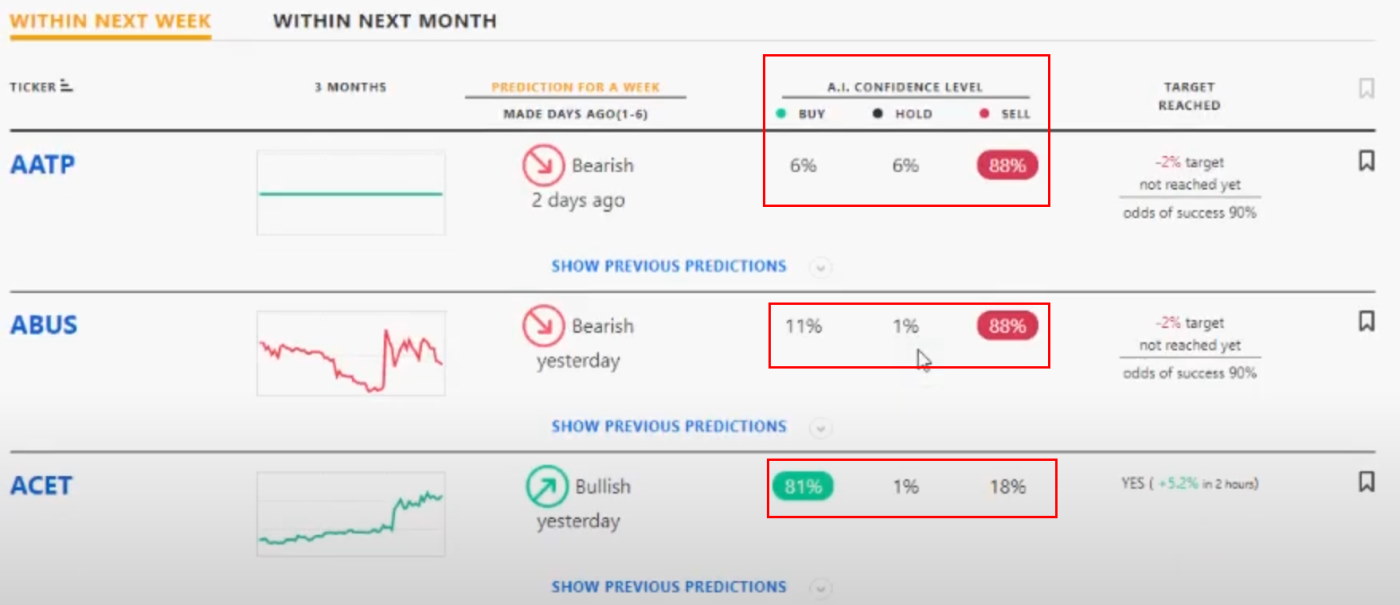
The outstanding feature of the Tickeron prediction engine is that you can click “Show previous predictions” to check if the AI has done a good job in the past with a particular pattern on specific stocks. The prediction engine provides the right level of clarity and granularity so you can make informed trading decisions.
Tickeron presents users with charts that already have patterns mapped and directions predicted; this is the single biggest benefit of the service. You will be disappointed if you want to perform your own technical analysis, configure your own indicators, or make chart annotations. Using AI in this platform means you will rely more on the algorithms than your creativity, which is probably good for most people.
For more information, read: Tickeron Test: Is Its AI Worth Your Money?
5. MetaStock: Candlestick Pattern Trading Tool
Combining MetaStock’s powerful technical analysis charting with Greg Morris’s candlestick pattern recognition add-on enables a stock trading system that predicts the probable win ratio of every pattern. This combination means a systematic trading strategy for buying and selling candlestick patterns.
My MetaStock testing highlights it as a robust trading platform. It offers over 300 charts and indicators for global markets, including stocks, ETFs, bonds, and Forex. MetaStock R/T excels with its advanced backtesting and forecasting features, alongside real-time news updates and efficient screening tools.
| Test | Tier | Score | Average |
|---|---|---|---|
| Lab Test Composite Score | AA | 4.42 | 4.21 |
| Pricing Index: $/day | A | $8.71 | $2.74 |
| Value Score (VP) | B | 3.26 | 2.82 |
| Speed & Ease of Use | B | 3.33 | 4.50 |
| Chart Analysis Depth Index | AAA | 4.83 | 3.17 |
| Chart Pattern Depth & Accuracy | B | 3.70 | 2.73 |
| Scanning Performance | B | 3.71 | 3.38 |
| Backtesting Performance | AAA | 4.81 | 3.38 |
| Trading Bot & Auto-Trading Reliability | C | 2.50 | 2.50 |
| AI & Algo Index | C | 2.50 | 2.00 |
| Alert Speed | B | 3.67 | 3.67 |
| Trade Signal Quality | C | 2.50 | 0.00 |
| Broker Connectivity & Ecosystem Depth | C | 1.67 | 2.00 |
| Portfolio Tool Performance | C | 2.60 | 2.80 |
| Financial News Speed & Depth | AAA | 5.00 | 2.30 |
| Community Utility Index (CUI) | B | 3.25 | 3.25 |
| Support Infrastructure & SLA Audit | A | 4.00 | 3.75 |
Tested using benchmarking system v3.
See the 2026 v3 58-point MetaStock test and benchmarks.
Pros
✔ Great Selection of Automated Expert Advisors
✔ Excellent Deep Backtesting
✔ Unique Stock Price Forecasting
✔ Large Library of Add-on Professional Strategies
✔ AAA Charts & Indicators
✔ AAA Institutional Real-Time News
✔ Xenith Add-On Rivals Bloomberg Terminals
✔ Works Online & Offline
Cons
✘ Takes Time To Learn
✘ Old School Windows App Design
✘ Too Many Add-ons
MetaStock is best for traders who need excellent real-time news, exceptional technical analysis, a vast stock systems marketplace with global data coverage, and excellent customer service.
However, the full Metastock suite costs $ 265 per month. It rivals the Bloomberg terminal in functionality but lacks the new AI trading features of TrendSpider and Trade Ideas, such as AI Bot trading and advanced pattern recognition.
| ⚡ Features? | Charts, Watchlists, Scanning, Backtesting |
| 🏆 Unique Features? | Algorithmic AI Forecasting, Real-time Global Trading News (Multi-language), Pattern Recognition with Add-ons. |
| 🎯 Best for | Stock, FX & Commodity Traders |
| ♲ Subscription | Monthly, Yearly |
| 💰 Price | $100 | $265 |
| 💻 OS | PC |
| ✂ Discount | 3 for 1 Deal Worth $530 |
| 🌎 Region | Global |
MetaStock is one of the biggest names in stock market analysis software. It offers fast global data and broad market coverage, including equities, futures, Forex, ETFs, and options.
Candlestick Pattern Trading System in MetaStock
Metastock is different from other vendors because its software runs locally on your PC, and you can buy one-off licenses and avoid monthly payments. They also operate a marketplace where professional traders sell their stock trading systems and signals as add-ons to MetaStock.
MetaStock does not natively provide candlestick recognition, so you will need to buy the add-on “Greg Morris’ Japanese Candle Recognition” for a one-off payment of $349. Greg Morris is seen as one of the global authorities on Japanese candlestick trading and has published on the topic.
The Accuracy of Candlestick Patterns
This add-on has a very sophisticated trading system, with full candlestick backtesting, analysis, and signals. It forecasts the next move in the stock price and the probability of the Candlestick signal being successful.
The probability rating of the candlestick recognition success is critical, and no other software offers this level of a professional trading system.
In the image below, this signal (highlighted in yellow) predicts a 77% chance of success.
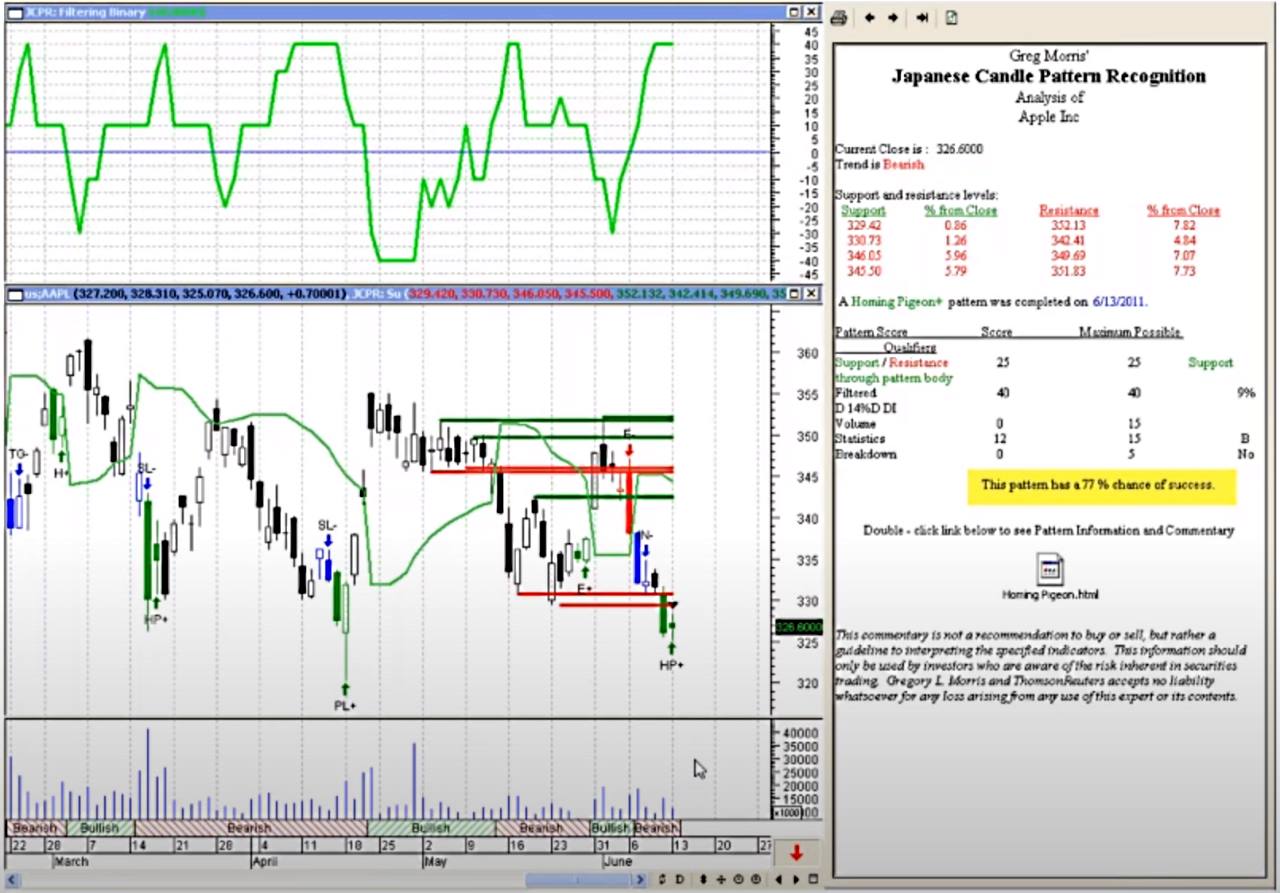
You get forecasting of the direction of the next move in stock price and also the probability of the candlestick signal being successful
Fundamental Scanning and Screening.
Using Refinitiv Xenith, you can see an in-depth analysis of company fundamentals, from debt structure to top 10 investors, including level II. Excellent watch lists featuring fundamentals and powerful market scanning get a perfect 10. MetaStock has full Xenith integration with institutional-level news, analysis, and outlook. This is the fastest global news service available, including translations into all major languages.
Stock Systems Back Testing & Forecasting.
Another area where MetaStock excels is its expert advisors. MetaStock harnesses many built-in systems to help you understand and profit from technical analysis patterns and well-researched systems as a beginner or intermediate trader. This is a key area of advantage. The most significant addition to the MetaStock arsenal is the forecasting functionality, which sets it apart from the crowd.
MetaStock still feels like a collection of separately developed applications requiring users’ education to make them work together. However, the vast selection of automated “expert advisors” you can deploy on the range of stocks in your purview makes MetaStock well worth the investment.
For more information, read: MetaStock R/T Review: My 9-Year Experience Revealed
Summary
TrendSpider offers robust backtesting, candlestick analysis, and interpretation on multiple timeframes. TradingView has the best free candlestick charting and recognition for global stock/Forex markets. Finally, MetaStock offers a powerful candlestick trading system with buy signals and win probabilities for professional traders. They are all excellent solutions; the choice is yours.
FAQ
How can I predict candlestick charts?
Many experts have run backtests to predict outcomes in candlestick charts. Success rates vary from 50-50 to 63%. Therefore, it is important to test the candlestick pattern’s success on specific stocks. You can perform this analysis using TradingView or TrendSpider.
How to read stock candles for beginners?
Beginners must decide whether to learn 147 candlestick patterns or use automated candlestick pattern recognition software. TrendSpider recognizes 147 candlestick patterns and TradingView recognizes 47. Both systems allow screening for candlestick patterns across markets and backtest the success rate.
How to recognize stock patterns?
To recognize stock patterns, you first need to memorize the many variations, then review each chart to spot the patterns. Alternatively, use automated pattern recognition using TrendSpider’s Market Scanner or the Finviz Screener.
How to predict the next Candlestick?
Predicting the next Candlestick is not as easy as you might think. Candlestick patterns, at best, offer only a 65% chance of predicting correctly, and at worst, they can be misleading. The best way to predict the next candle is to use bullish patterns in an uptrending market. Also, using candle patterns on an hourly or daily timeframe is more predictive than on a per-minute basis.
How to recognize candlestick patterns?
Manually recognizing candlestick patterns is laborious: both memorizing the patterns and examining the chart. This is why TradingView, FinViz, and TrendSpider have powerful algorithms to detect these patterns and save you time.
How many chart price patterns are there in the stock market?
Leading technical analysts, such as Murphy and Pring, define 20 major stock chart patterns. Chart patterns range from the very predictive Head & Shoulders and Double Top reversals to the less predictive Wedges and Pennants. All 20 chart patterns are covered in this article.
How do I programmatically find patterns in stock charts?
Programmatically finding patterns in stocks is the future of technical analysis for traders. TrendSpider’s Market Scanner, FinViz’s Stock Screener, TradingView’s Auto-Indicators, and Tickeron’s Pattern Engine have already fully programmatically automated the process.
What software has automatic Fibonacci patterns on stock charts?
The best software for automatic Fibonacci pattern recognition on stock charts is TrendSpider’s AutoFibs function and TradingView’s Auto Fib Extension and Retracement indicators. Automated Fibonacci pattern recognition is rare in charting services because it is so algorithmically complex.
What software is best for chart pattern backtesting?
TrendSpider has by far the best stock chart pattern backtesting, covering 123 candlestick patterns and 28 stock chart patterns. TrendSpider’s backtesting is powerful yet elegant, requiring no coding skills.
Hi Tom, you are welcome, I use Trendspider for all my pattern testing it is excellent.
thanks for the excellent work testing these charts. I tried both tradingview and trendspider. I preferred trendspider due to backtesting.