Motley Fool is a long-running stock-picking and investor education service, but how does it stack up in a benchmarked trading-tool lab test?
In this report, I score Motley Fool across 17 categories and 58 tests, pricing, value, speed, charting depth, scanning, automation, alerts, news, community, and support, so you can see where it fits (and where it doesn’t) in a real-world investing workflow.
Lab Test Composite Score
Motley Fool’s A 4.04 CLPS reflects a product that’s optimized for research consumption and decision support, not workflow speed for traders. Against the median CLPS (4.21), it’s slightly lower because many competing “tools” include full charting/scanning/backtesting stacks—areas Motley doesn’t try to win. The practical upside: if your bottleneck is finding high-conviction ideas and sticking with them, its structure is a feature.
The overall result might seem low, but when considering Motley Fool Stock Advisor and Epic, they are highly focused on stock recommendations, which earns an AAA 5.00
| Metric | Calculation | Motley Fool | High | Median | Low |
|---|---|---|---|---|---|
| Composite Lab Performance Score (CLPS) | Average for all ratings + 5X Superpower Boost for Top 5 killer features | 4.04 | 4.75 | 4.21 | 2.93 |
| Composite Lab Performance Score (CLPS) Overall Test Winners | TradingView 4.75 | TrendSpider 4.72 | Trade Ideas 4.52 |
In Context: Motley Fool is structurally an “investment advisory + research library.” This is evident in the CLPS: it can score extremely well on signal usefulness and community utility because the output is curated and repeatable (model portfolios, recurring picks, thesis framing).
Where it loses points is where a research publisher should lose—chart engineering, scanning depth, and execution tooling. If you already have a broker + charts, Motley’s job is to feed you better ideas and better conviction.
Motley Fool Benchmarked Lab Scores
| Test | Tier | Score | Average |
|---|---|---|---|
| Lab Test Composite Score | 4.04 | 4.04 | 4.21 |
| Pricing Index | AAA | $1.37 | $2.74 |
| Value Score (VP) | C | 2.89 | 2.82 |
| Speed & Ease of Use | AAA | 5.00 | 4.50 |
| Chart Analysis Depth Index | C | 0.50 | 3.17 |
| Chart Pattern Depth & Accuracy | N/A | N/A | 2.73 |
| Scanning Performance | C | 1.34 | 3.38 |
| Backtesting Performance | N/A | N/A | 3.38 |
| Trading Bot & Auto-Trading Reliability | N/A | N/A | 2.50 |
| AI & Algo Index | B | 3.50 | 2.00 |
| Alert Speed | C | 2.67 | 3.67 |
| Trade Signal Quality | AAA | 5.00 | 0.00 |
| Broker Connectivity & Ecosystem Depth | C | 2.00 | 2.00 |
| Portfolio Tool Performance | B | 3.50 | 2.80 |
| Financial News Speed & Depth | B | 3.00 | 2.80 |
| Community Utility Index (CUI) | A | 4.25 | 3.25 |
| Support Infrastructure & SLA Audit | B | 3.00 | 3.75 |
Who benefits most: long-term investors, portfolio builders, “busy professionals” who want structured ideas.
Who won’t: active traders needing scans, alerts, execution, or strategy testing inside one platform.


Reasons to Consider
- You want human-curated buy/sell recommendations (high Trade Signal Quality AAA 5.00) and a simple, readable research experience.
- You prefer low-friction daily usage AAA, fast access, fast consumption, and minimal UI complexity.
- You value community and long-horizon decision reinforcement (CUI is well above median).
Reasons to Avoid / Pair With Another Tool
- You need real-time news, scanning, or intraday alerts for execution—pair with a scanner/news terminal and a charting platform.
- You rely on technical analysis, indicators, pattern engines, or backtesting—Motley Fool is not a strategy lab.
- You want portfolio risk analytics (correlation, drawdown, factor exposure) beyond basic tracking—pair with a dedicated portfolio tool.
Verdict
The Motley Fool is best treated as a subscription for investors’ conviction and research. It can be a strong complement to a trading stack, but it is not a substitute for charting, scanning, backtesting, or automated execution platforms.
If your current stack already handles charts, scans, and execution, Motley can materially improve your idea pipeline and conviction. If you’re looking for a “do-everything trading platform,” the lab results are clear: you’ll be happier pairing it with a dedicated market tool rather than expecting Motley to become one.
Motley Fool sits at a Lab Test Composite Score (CLPS) of A 4.04, which puts it just below the benchmark High (4.75) and above the benchmark Median (4.21 is the median for CLPS, so it’s slightly under the median but still strong overall).
In plain English: this is an investing research + recommendations business, not a trading platform. You buy it for idea generation, model portfolios, and long-horizon conviction, not for scanning, chart engineering, or execution automation.
Pricing Index
Pricing Index is in dollars, not a 0–5 rating. Motley Fool’s $1.37/day is way below the median $2.74/day, and well below the “High” cost anchor ($9.99/day). That’s the “headline” affordability. The nuance lies in Effective Monthly Cost (EMC): if you upgrade to higher tiers to match the research-tool depth of dedicated platforms, the true comparable spend increases.
| Metric | Calculation | Motley Fool | High | Median | Low |
|---|---|---|---|---|---|
| Cost-per-day | $/day on an annual plan. Minimum viable plan with real-time exchange data | $1.37 | 9.99 | 2.74 | 0.74 |
| $ per feature | Effective Monthly Cost /Total Features | $3.78 | 23.37 | 5.95 | 1.94 |
| Effective Monthly Cost (EMC) | EMC = (Plan price + required real-time data fees + key premium add-ons) / month | $41.58 | 303.87 | 83.32 | 22.50 |
Motley Fool is cheap if you benchmark it as “a newsletter that sends stock picks.” Stock Advisor costs only $199 per year; it is a great deal.
If you want additional benefits such as screeners, portfolio analytics, deeper quantitative data, or something comparable to platforms that let you perform your own research, the $499 Epic service is realistic.
The benchmarking in this review uses the Epic service because using only Stock Advisor makes the platform a one-trick pony, which would score poorly overall.
So what: buy the plan that matches your workflow; don’t buy “cheap” and then expect “platform.”
Value Score (VP)
Motley Fool’s 2.89 is slightly above the median (2.82) on value, driven by feature quality (3.66) and strong device support (4.00)—you can consume it anywhere, fast. The drag is feature depth (1.00): it’s not trying to be a technical workstation; it’s trying to be a high-quality decision feed.
| Metric | Calculation | Motley Fool | High | Median | Low |
|---|---|---|---|---|---|
| Value Score | Sum of Feature Quality (60% Weight), Feature Depth (30%) & Device Support Depth (10%) | 2.89 | 4.37 | 2.82 | 1.70 |
| Value Rank | Percentile Ranking | 2.50 | 5.00 | 2.50 | 1.00 |
| Feature Quality | Average of All Feature Quality Ratings | 3.66 | 4.16 | 2.97 | 2.00 |
| Feature Breadth | Feature richness (count of meaningful core features) | 11 | 17 | 12 | 9 |
| Feature Depth | Percentile Ranking | 1.00 | 4.75 | 3.00 | 1.00 |
| Device Support Depth | Web 2 points, (PC, Android/iOS/ 1 Point each) | 4.00 | 5.00 | 2.00 | 1.00 |
| Value Score Test Winners | TradingView 4.37 | TrendSpider 4.20 | Trade Ideas 4.05 |
Motley Fool’s “value” is best understood as quality of decision support per dollar, not the number of technical widgets. The best use case is the investor who wants repeatable idea flow (picks, updates, thesis reminders) and can act through an existing broker.
If you’re looking for value defined as “tools that save clicks and generate trades,” your value score will be capped by limited depth in scanning, charting, and testing.
Best fit: buy-and-hold investors who want research leverage.
Not ideal: traders who define value as “edge from tooling.”
Speed & Ease of Use
Motley Fool scores 5.00, beating the median (4.50), because it’s built to be consumed fast: 2.14 seconds to load the core “chart” experience you’re using (typically price context + content), plus strong click-efficiency. This score does not mean it’s a fast trading workstation—it means low friction to reach actionable content.
| Metric | Calculation | Motley Fool | High | Median | Low |
|---|---|---|---|---|---|
| Speed & Use Index Rating | Average of Time to Chart Performance, Multimonitor Chart Speed & 3 Click Rule: Ease of Use | 5.00 | 5.00 | 4.50 | 3.30 |
| Time to Chart Speed (Seconds) | Seconds from clicking the icon to a fully loaded chart with 200 price bars & 2 indicators. | 2.14 | 17.03 | 4.70 | 1.60 |
| Time to Chart Performance | Speed to Chart Points | 5 | 5.00 | 4.50 | 3.00 |
| Multi-Chart Latency (ms) | N/A | 667.00 | 209.00 | 10.00 | |
| Multimonitor Chart Speed | Multi-Chart Sync Points | N/A | 5.00 | 3.50 | 0.00 |
| 3-Click Rule Test | Number of Clicks to place a trade or launch a scan | 3 | 6.00 | 3.00 | 2.00 |
| 3 Click Rule: Ease of Use | 5 Click Points. Each click > 3 = 1 minus point | 5 | 5.00 | 3.00 | 2.00 |
| Speed & Ease of Use Test Winners | TradingView 5.00 | Stock Rover 5.00 | Seeking Alpha 5.00 |
Motley Fool’s strength is “get me to the point”—latest updates, research, and pick rationale. That makes it feel instant compared with platforms that need layouts, indicators, timeframes, and saved scans.
If your real goal is to make fewer, better decisions, speed-to-insight is more important than multimonitor latency. If your goal is intraday reaction speed, this score won’t save you—because you still need execution and market tooling elsewhere.
Chart Analysis Depth Index
Motley Fool is 0.50 vs a median 3.17 because it’s not a charting stack. You get basic price context, not indicator engineering, custom scripting, or deep multi-chart workflows. If you buy Motley for charts, you’re buying the wrong product.
| Metric | Calculation | Motley Fool | High | Median | Low |
|---|---|---|---|---|---|
| Chart Analysis Depth Index | Average of Chart Depth, Indicator Depth & Custom Coding Scores | 0.50 | 5.00 | 3.17 | 0.50 |
| Chart Types | Total Count | 1 | 38.00 | 10.00 | 1.00 |
| Chart Depth | Chart Type Score 0.3 points per chart | 1.00 | 5.00 | 3.00 | 0.30 |
| Indicators | Total Count | 0 | 400.00 | 116.00 | 0.00 |
| Indicator Depth | Indicators Scores 0.025 points per indicator | 0.00 | 5.00 | 2.90 | 0.00 |
| Custom Indicator Coding | Available = 5 Points | 0.00 | 5.00 | 0.00 | 0.00 |
| Chart Analysis Depth Index Test Winners | TradingView 5.00 | MetaStock 5.00 | Optuma 5.00 |
Motley Fool’s charts exist to provide context and continuity—what happened after a pick, what’s the long-term trend, how volatile is the ride—not to be a decision engine. If you’re a technical analyst, pair Motley with a dedicated charting platform. If you’re fundamentally driven, you’ll likely prefer this “minimal charting, maximum narrative” model because it keeps you anchored to a thesis instead of indicator tweaking.
Chart Pattern Depth & Accuracy
Pattern recognition is excluded here (no pattern engine / no published pattern depth). This isn’t a flaw—it’s a category mismatch. Motley’s “pattern” is thesis + conviction, not candle detection.
| Metric | Calculation | Motley Fool | High | Median | Low |
|---|---|---|---|---|---|
| Pattern Recognition Efficacy & Accuracy | Average of Pattern Recognition Depth & Accuracy Scores | N/A | 4.88 | 2.73 | 0.00 |
| Total Patterns | Count of unique patterns recognized | N/A | 226.00 | 57.50 | 0.00 |
| Pattern Recognition Accuracy | Accuracy Points: 0.05 points per percent accurate | N/A | 4.75 | 4.48 | 0.00 |
| Chart Pattern Recognition & Accuracy Test Winners | TrendSpider 4.88 | Trade Ideas 4.62 | TradingView 3.98 |
In Context: If you’re a pattern trader, you shouldn’t try to “force-fit” Motley into your workflow. Use it upstream as an idea filter that narrows the scope of what you analyze technically.
Think of Motley as “what should I care about?” and your charting platform as “how do I trade it?” That division of labor often improves discipline: fewer symbols, deeper focus, clearer reasons.
Scanning Performance
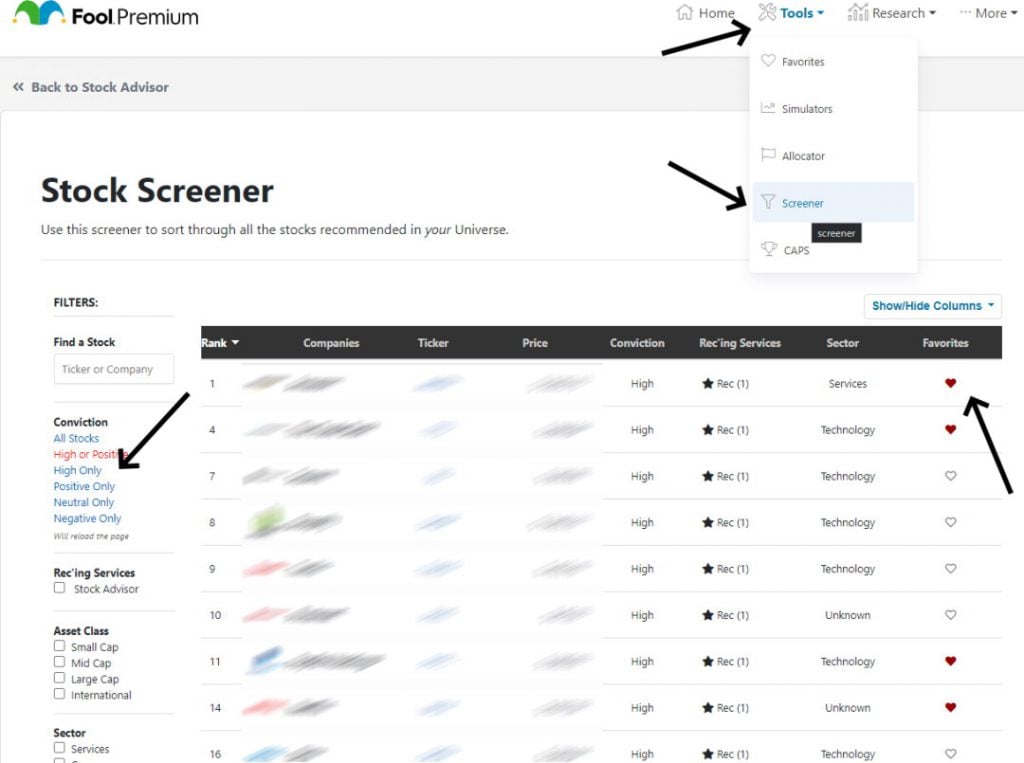
Motley scores 1.34 vs median 3.38 because the scanning layer is minimal: a small criteria set, no custom-code scanning, and no real-time refresh scanning. If your edge comes from finding setups first, this will not suffice.
In Motley Fool Stock Advisor and in the quant database in Epic, you can scan for 82 criteria. The scanning is fast at 200 milliseconds, but it is not customizable; you are screening a universe of Fool’s curated stocks.
| Metric | Calculation | Motley Fool | High | Median | Low |
|---|---|---|---|---|---|
| Market Scanning Latency & Depth | Average of Scanning Speed, Criteria & Customer Code Scores | 1.34 | 5.00 | 3.38 | 0.80 |
| Scanner Performance (ms) | Milliseconds to search the entire S&P 500 across 5 different criteria. | 200 | 2500.00 | 300.00 | 7.00 |
| Scanning Speed Points | Scanner Performance Points | 3 | 5.00 | 4.00 | 1.00 |
| Scanner Auto-Refresh Rate (seconds) | Auto-Refresh Speed(Not Scored) | N/A | 60.00 | 1.00 | 0.00 |
| Scanning Criteria & Depth | Total Criteria Count | 82 | 675.00 | 200.00 | 30.00 |
| Scanning Criteria & Depth | Scanning Criteria 0.0125 points per criteria | 1.03 | 5.00 | 2.50 | 0.38 |
| Custom Code Scanning | Exists 5 Points | 0.00 | 5.00 | 5.00 | 0.00 |
| Scanning Performance Test Winners | Stock Rover 5.00 | TradingView 4.83 | TrendSpider 4.67 |
Motley’s “scanning” is essentially editorial curation—you’re receiving pre-filtered ideas, not building a machine to search the market. That can be a feature for long-term investors (less noise, more thesis).
But for traders, the absence of deep criteria + auto-refresh is decisive: you’ll miss the speed advantage that dedicated scanners provide. If scanning is a core part of your process, pair Motley with Finviz/Trade Ideas/TrendSpider and treat Motley as an idea input, not as a market discovery tool.
Backtesting Performance
Backtesting is excluded in this Motley Fool audit, as it does not exist in the product suite. There is no integrated “simulate strategies, generate reports, and iterate parameters” workflow comparable to backtesting platforms.
| Metric | Calculation | Motley Fool | High | Median | Low |
|---|---|---|---|---|---|
| Quantitative Backtesting Fidelity | Average of Backtesting Speed, No Coding Required, Flexible Coding, Report Quality & Multi-Stock Backtesting Scores | N/A | 4.90 | 3.38 | 0.00 |
| Backtesting Speed (ms) | Time required to run a strategy simulation over 10 years of daily data or 2 months of 5-minute data (milliseconds) | N/A | 6000.00 | 302.00 | 7.00 |
| Backtesting Speed | Backtesting Speed Points | N/A | 5.00 | 4.25 | 0.00 |
| No Coding Required | Zero Code Backtesting 5 Points | N/A | 5.00 | 5.00 | 0.00 |
| Flexible Coding Backtesting | Exists = 5 points | N/A | 5.00 | 5.00 | 0.00 |
| Backtesting Report Quality | Backtesting Report Quality Percent | N/A | 100.00 | 70.00 | 0.00 |
| Backtesting Report Quality | % of total reporting criteria available. 0.05 points per 1% | N/A | 5.00 | 2.25 | 0.00 |
| Multi-Stock Basket Backtesting | If Exists 5 Points | N/A | 5.00 | 5.00 | 0.00 |
| Backtesting Performance Test Winners | Optuma 4.94 | TrendSpider 4.88 | MetaStock 4.81 |
In Context: Motley’s philosophy is not “test 400 strategies.” It’s “buy high-quality businesses and hold.” That’s why backtesting isn’t a core product surface. If you’re an investor, that’s fine—your performance model is about diversification, position sizing, and behavioral discipline. If you’re systematic, you should treat Motley as a source of research inspiration and then validate ideas on a backtesting-native platform before putting money behind rules.
Trading Bot & Auto-Trading Reliability
Automation is excluded here. Motley doesn’t present a bot framework, webhook-to-execution pipeline, or broker-linked automation path as a product promise.
| Metric | Calculation | Motley Fool | High | Median | Low |
|---|---|---|---|---|---|
| Automated Execution & Bot Reliability | Sum of Automation Path, Strategy/Bot Sophistication, Operational Assurance Points | N/A | 4.50 | 2.50 | 1.50 |
| Automation Path | Automation Path (0.0–2.0) | N/A | 2.00 | 1.00 | 1.00 |
| Strategy/Bot Sophistication | Strategy/Bot Sophistication (0.0–2.0) | N/A | 2.00 | 1.50 | 1.00 |
| Operational Assurance | Operational Assurance (0.0–1.0) | N/A | 1.00 | 0.00 | 0.00 |
| Bot & Auto-Trading Reliability Test Winners | TrendSpider 4.50 | Trade Ideas 4.00 | Tickeron 4.00 |
In Context: This is the cleanest “category mismatch” in the whole audit. Motley is not trying to automate trading, so you shouldn’t grade it like a bot platform. The practical workflow is: Motley generates candidates and thesis; your broker handles execution; your risk management handles sizing and discipline. If you need automation, don’t retrofit a content publisher into that role—pair it with a platform designed for alerts, execution, and monitoring.
AI & Algo Index
Motley scores 3.50 vs median 2.00, which is strong for a research publisher. The score is driven by Algo Depth (2.00) and some AI Layer (1.00), but note the transparency is only 0.50: you may benefit from internal tooling, but the user-facing product is still mostly human-authored research.
| Metric | Calculation | Motley Fool | High | Median | Low |
|---|---|---|---|---|---|
| Algorithmic Intelligence & AI Tier Index | Sum of Algo Depth, AI Layer & Transparency Points | 3.50 | 5.00 | 2.00 | 1.00 |
| Algo Depth | Algo Depth (0.0–2.0) | 2.00 | 2.00 | 1.50 | 1.00 |
| AI Layer | AI Layer (0.0–2.0) | 1.00 | 2.00 | 0.00 | 0.00 |
| Transparency | Transparency (0.0–1.0) | 0.5 | 1.00 | 1.00 | 0.00 |
| AI & Algo Index Test Winners | TrendSpider 5.00 | Trade Ideas 4.50 | Tickeron 4.50 |
Motley Fools is a human-curated recommendations/service model rather than an AI decision engine. Algorithms are used in its quantitative research, but they are limited.
Analyst Picks: While they use AI for internal research, the “tool” provided to the user is human-authored content, not an interactive reasoning engine.
“AI” in a consumer investing product often refers to summaries, tagging, and research acceleration—not to auto-generated strategies. Motley’s advantage is that the user experience remains thesis-first and readable. That’s valuable for investors who want to stay aligned with long-term logic. But you should not interpret this category as “AI will trade for me.” The output remains human-framed recommendations and portfolio guidance, not an algorithmic execution system.
Alert Speed
Motley scores 2.67 vs median 3.67 because alerts are content-driven, not market-tick driven. You can get notifications, but not the kind of high-frequency, multi-condition, price/indicator alert engine that traders expect.
Notifications depend on publication timing, and recommendations, rather than market-tick evaluation.
| Metric | Calculation | Motley Fool | High | Median | Low |
|---|---|---|---|---|---|
| Alert Trigger Latency & Delivery Speed | Average of Concurrent Alerts, Alert Streams Richness & Alert Speed Rating Scores | 2.67 | 4.67 | 3.67 | 2.33 |
| Concurrent Alerts | 1 point per 50, to a max of 5 points | 5 | 5.00 | 5.00 | 5.00 |
| Concurrent Alert Count | Unlimited | 2000.00 | 875.00 | 400.00 | |
| Alert Streams Richness | 1 point per stream, max 5 points | 2 | 5.00 | 2.00 | 1.00 |
| Alert Speed Rating | 1 | 5.00 | 3.00 | 1.00 | |
| Speed Metric | Content-driven (newsletter/trade-alert schedule) |
| Alert Speed Test Winners | TradingView 4.67 | TrendSpider 4.33 | Benzinga Pro 4.33 |
In Context: This is where investors and traders diverge. Investors mostly need “tell me when the thesis changes” or “remind me about updates.” Traders need “tell me when price/volume/indicator conditions trigger.” Motley’s alerting is the former.
If you want real-time market condition alerts, pair Motley with a platform built for technical triggers. If you’re long-term, basic notifications can be enough—because a 5-minute candle doesn’t decide your holding period.
Trade Signal Quality
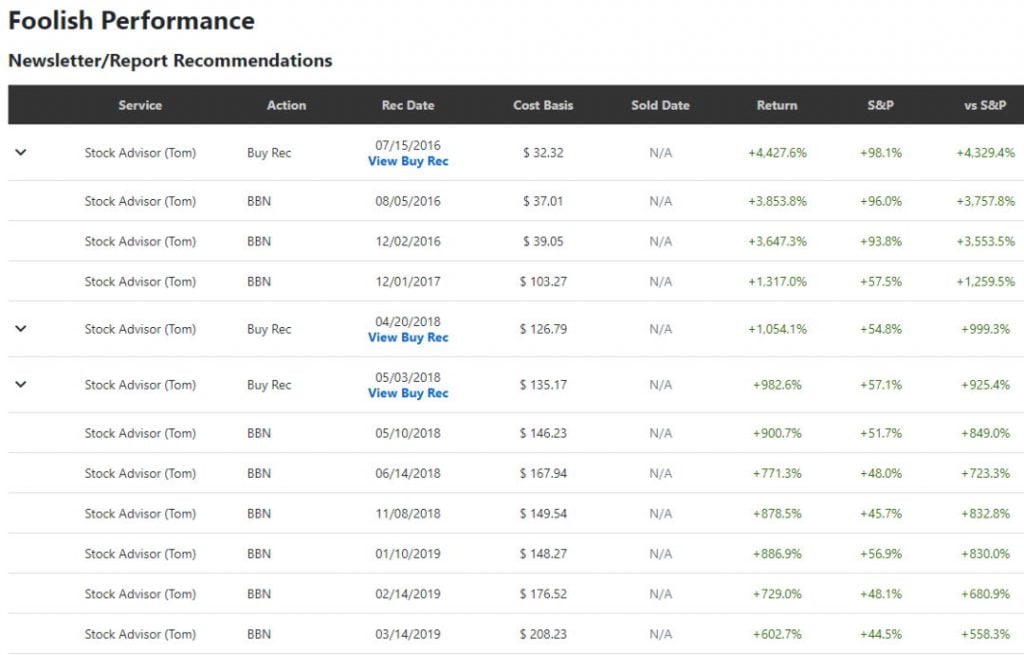
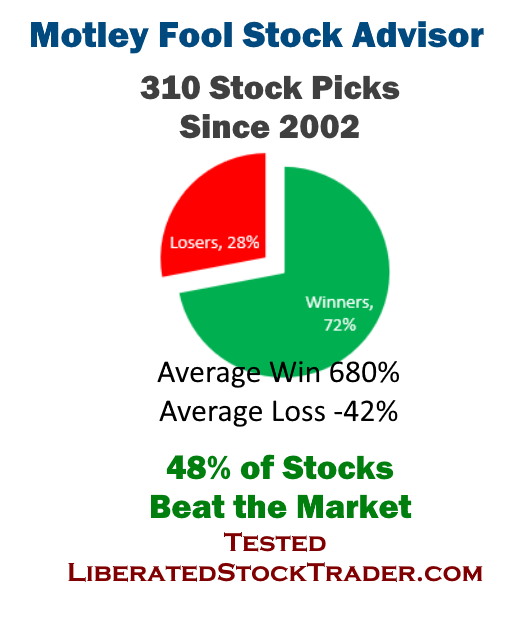
Motley scores 5.00 in this rubric because it provides audited, explicit recommendations (i.e., actionable picks and portfolio guidance). This category is not “predictive quant alpha”; it’s “does the product deliver clear, testable signals for the user to act on?”
| Metric | Calculation | Motley Fool | High | Median | Low |
|---|---|---|---|---|---|
| Signal Alpha & Predictive Efficacy | 5 = Audited specific signals; 2.5 = gauges | 5.00 | 5.00 | 0.00 | 0.00 |
| Trade Signal Quality Test Winners | Trade Ideas 5.00 | Seeking Alpha 5.00 | Tickeron 5.00 | Motley Fool 5.00 |
In Context: Motley’s entire value proposition is signals: recurring picks, portfolio guidance, and thesis updates that map to “buy/hold/sell conviction.” The key nuance is that these are long-horizon signals, not trading signals. If you treat them like swing entries, you’ll misapply them. Used correctly—diversified sizing, patience, and time for thesis to play out—this is exactly the kind of signal structure many investors lack.
Broker Connectivity & Ecosystem Depth
Motley scores 2.00, which sits at the median. That’s mostly because it’s distributed as a research service that can coexist with any broker, rather than a platform with direct broker APIs and measured order-routing latency.
Broker connectivity is another area in which the toolset is lacking; it would be a great addition to link with your broker and allow Fool to display your stocks, versus its universe of recommendations. But sadly not.
| Metric | Calculation | Motley Fool | High | Median | Low |
|---|---|---|---|---|---|
| Asset & Data Coverage Index | Average of Live Trading, Broker Integration, Asset & Data Coverage Scored | 2.00 | 5.00 | 2.00 | 0.67 |
| Live Trading | 5 Points | N/A | 5.00 | 5.00 | 0.00 |
| Total number of brokers integrated | N/A | 1200.00 | 2.00 | 0.00 | |
| Asset & Data Coverage | Stocks, Options, FX, USA, International – 1 point each | 2.00 | 5.00 | 2.00 | 2.00 |
| Broker Connectivity & Ecosystem Test Winners | TradingView 5.00 | MetaTrader 5.00 | TrendSpider 4.43 |
In Context: For a research publisher, “broker connectivity” is more about portability than API integration. You can act on recommendations in any brokerage account, which is the right model for most investors.
But if you want a single environment where research → signal → order routing happens with measured latency, you need a trading platform. Motley is better treated as an upstream decision layer that feeds your existing execution stack.
Portfolio Tool Performance
Motley scores 3.50 vs median 2.80, a pleasant surprise for an advisory product. The key is coverage: 33/80 (41.2%) of critical portfolio metrics are covered. That’s not “institutional risk analytics,” but it can be enough to support a guided long-term portfolio.
| Metric | Calculation | Motley Fool | High | Median | Low |
|---|---|---|---|---|---|
| Portfolio Health & Risk Analytics | Composite rating | 3.50 | 4.80 | 2.80 | 2.00 |
| Health Check & Reporting Depth | % of “Critical Financial Metrics” covered | 33/80 (41.2%) | 76/80 (95.0%) | 36/80 (45.0%) | 20/80 (25.0%) |
| Portfolio Tool Performance Test Winners | Stock Rover 4.80 | Portfolio 123 4.80 | Seeking Alpha 4.30 |
Motley’s portfolio tooling is “good enough” for the investor who wants a single place to see holdings + guidance, but it won’t replace a true portfolio analytics platform. Consider this portfolio organization and coaching rather than portfolio engineering.
If you need correlation matrices, factor exposures, Monte Carlo retirement modeling, or rigorous drawdown controls, use Stock Rover/Portfolio123 as the analytics layer and keep Motley as the thesis and conviction layer.
Financial News Speed & Depth
Motley scores 3.00 vs median 2.80—but interpret this carefully. The “speed” is not wire-speed; my audit note is that the news is curated for thesis relevance rather than immediate price action. A 30+ minute delay is irrelevant to long-term investors and fatal to day traders.
| Metric | Calculation | Motley Fool | High | Median | Low |
|---|---|---|---|---|---|
| Financial News Speed & Quality Rating | Weighted rubric | 3.00 | 5.00 | 2.80 | 0.00 |
| Wire Delay | Seconds of delay vs primary wire feeds | 30+ mins | < 1 s | 60–300 s | Hours/Days |
| Financial News Speed & Depth Test Winners | MetaStock 5.00 | Benzinga Pro 5.00 | Scanz 5.00 |
News is curated for long-term thesis impact rather than immediate price action.
Motley’s “news” is best described as interpretation—what matters, why it matters, and what investors should do with it. That is a higher value than speed for the long-term user because it prevents overtrading and anchors decisions in fundamentals.
But if your process depends on being first to headlines, you’re shopping in the wrong aisle. Pair Motley with a real-time news terminal if you’re trading catalysts; keep Motley for a durable thesis.
Community Utility Index (CUI)
Motley scores 4.25, well above the median (3.25). That’s a strong “ecosystem” signal: the community is large enough to feel alive, and the contribution quality is above average (4.50), even if it’s not technical code-sharing like chart-script communities.
Fool has a massive subscriber base that follows expert leads but contributes less than other peer-to-peer platforms. Most interactions happen on legacy-style bulletin boards.
| Metric | Calculation | Motley Fool | High | Median | Low |
|---|---|---|---|---|---|
| Community Utility Index | Avg of size + contribution quality | 4.25 | 5.00 | 3.25 | 1.75 |
| Active Community Size | Active Users scale | 4.00 | 5.00 | 3.25 | 1.80 |
| Quality of Community Contribution | Quality of IP scale | 4.50 | 5.00 | 3.50 | 1.50 |
| Community Utility Index Test Winners | TradingView 5.00 | MetaTrader 5.00 | Trade Ideas 4.75 |
In Context: Motley’s community is “investor-social” rather than “developer-social.” You’re not getting thousands of new indicators per day; you’re getting discussions around picks, portfolio moves, and thesis framing. That has real utility for long-term investors because it reinforces discipline and provides alternate viewpoints. The risk is echo-chamber behavior—so the best use is to treat the community as a sanity check and idea amplifier, not a substitute for risk management.
Support Infrastructure & SLA Audit
Motley scores 3.00, below the median (3.75). It has acceptable access channels and reasonable response times, but it’s not built like a trading terminal support org with immediate “down system” urgency.
| Metric | Calculation | Motley Fool | High | Median | Low |
|---|---|---|---|---|---|
| Support SLA Audit: Time-to-Human Benchmarks | Avg of comm channels + response time | 3.00 | 5.00 | 3.75 | 1.00 |
| Support Communication Channels | Access scale | 3.00 | 5.00 | 3.50 | 1.00 |
| Support Response Times | SLA scale | 3.00 | 5.00 | 4.00 | 1.00 |
| Support Infrastructure & SLA Audit Winners | TrendSpider 5.00 | TC2000 5.00 | ThinkorSwim 4.75 |
Support expectations should match product risk. If a charting terminal breaks mid-session, that’s an execution risk event. If a research subscription has a login issue, it’s frustrating but rarely market-critical.
Motley’s support profile is consistent with that of a subscription publisher: generally functional, often billing- and account-oriented, and less “ops-engineered” than that of trading platforms.
If you require high-assurance uptime and immediate escalation paths, you’ll want a dedicated trading platform alongside Motley.