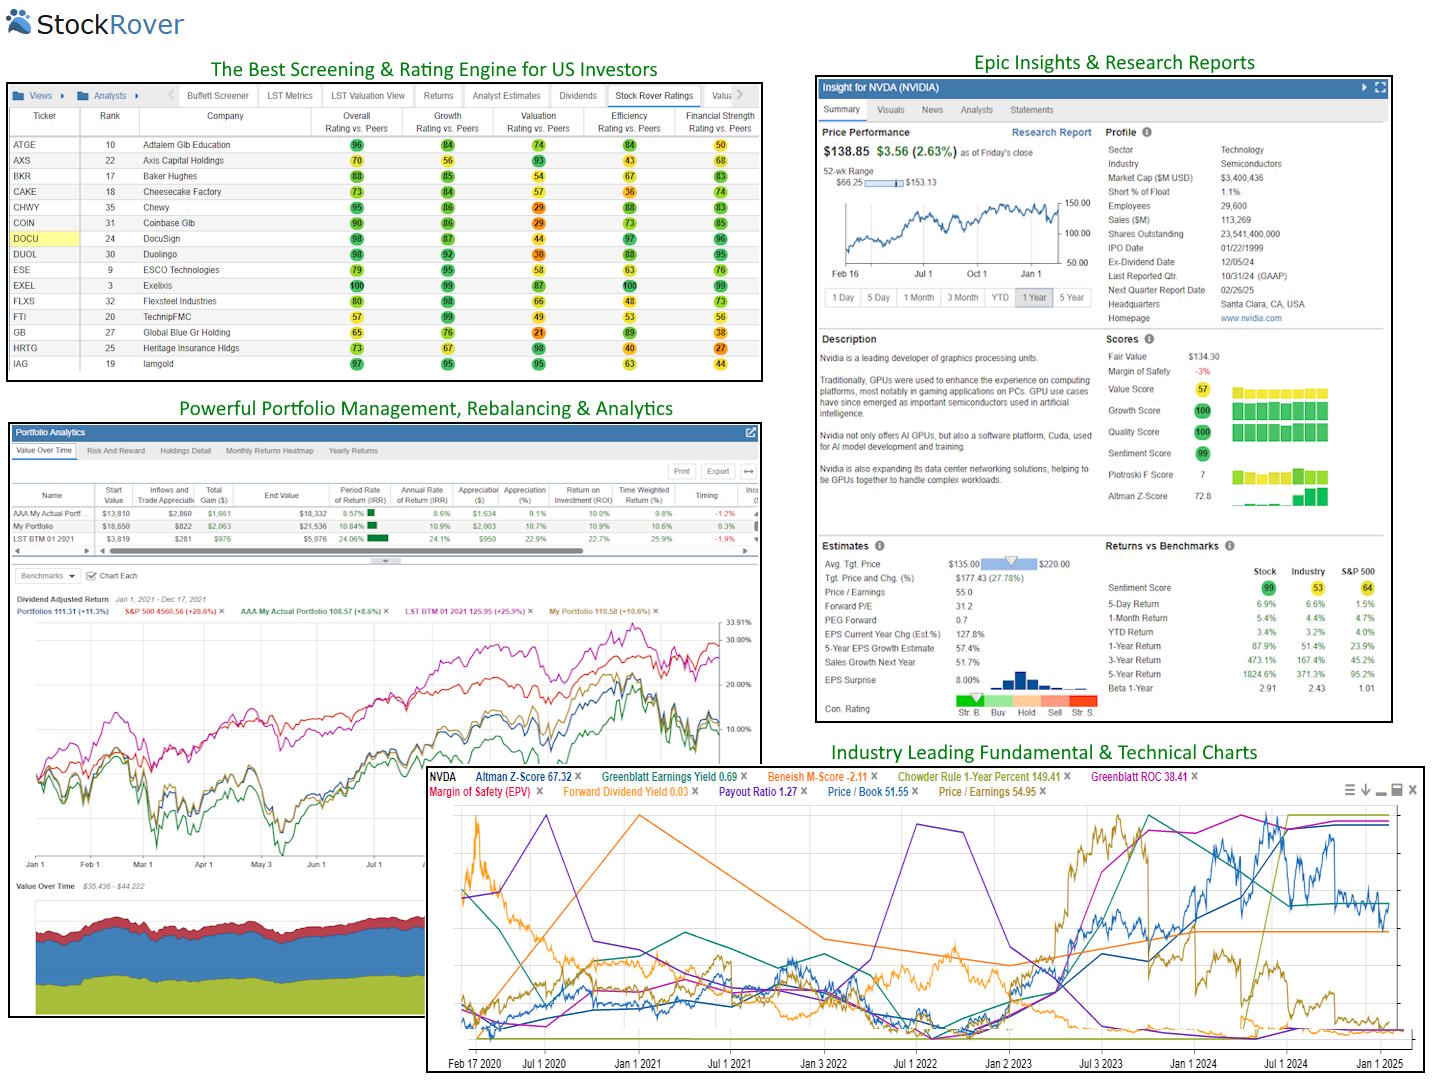
Stock Rover is a fundamentals-first research and portfolio platform, and my lab results reflect that: it scores 4.37 on the Composite Lab Performance Score (CLPS), beating the median 4.19 across the 17 benchmark categories below.
Where it really separates itself is in portfolio health/risk analytics, screening depth, and value for money, while it intentionally lags in pattern trading, live execution, and news terminal speed.
Our 58-point scientific Stock Rover lab test, audit, and benchmarking include speed, accuracy, value, and feature depth with data-driven precision.
Lab Test Composite Score
Stock Rover’s CLPS is AA 4.37, above the median 4.19 and within striking distance of the leaders. This is what you want to see from a portfolio-first platform: strong “daily workflow” utility (screening, research depth, reporting) rather than a narrow specialty score inflated by one feature.
| Metric | Calculation | Stock Rover | High | Median | Low |
|---|---|---|---|---|---|
| Composite Lab Performance Score (CLPS) | Average for all ratings + 5X Superpower boost for Top 5 killer features | 4.37 | 4.75 | 4.19 | 2.90 |
| Composite Lab Performance Score (CLPS) Overall Test Winners | TradingView 4.75 | TrendSpider 4.72 | Trade Ideas 4.52 |
A CLPS above median typically means fewer “tool gaps” you’ll need to patch with paid add-ons. Stock Rover’s profile is consistent: it wins by being a complete research + portfolio system, not by pretending to be a broker terminal.
In Context: Stock Rover is built for investors who want repeatable decisions: screen → research → buy/hold → monitor risk and fundamentals.
That’s why CLPS matters: it signals whether the platform supports the full lifecycle without forcing you into three subscriptions and a spreadsheet. If your process is fundamentals and portfolio discipline first, Stock Rover tends to feel like a home base rather than a single-purpose widget.
Benchmarked Lab Scores
| Test | Tier | Score | Average |
|---|---|---|---|
| Lab Test Composite Score | AA | 4.37 | 4.19 |
| Pricing Index | AAA | $0.77 | $2.74 |
| Value Score (VP) | B | 3.63 | 2.82 |
| Speed & Ease of Use | AAA | 5.00 | 4.50 |
| Chart Analysis Depth Index | AA | 4.50 | 3.50 |
| Chart Pattern Depth & Accuracy | N/A | N/A | 2.73 |
| Scanning Performance | AAA | 5.00 | 4.50 |
| Backtesting Performance | A | 4.00 | 4.00 |
| Trading Bot & Auto-Trading Reliability | C | 2.50 | 1.50 |
| AI & Algo Index | C | 2.50 | 2.00 |
| Alert Speed | C | 2.67 | 1.50 |
| Trade Signal Quality | C | 2.50 | 0.00 |
| Broker Connectivity & Ecosystem Depth | C | 2.25 | 4.50 |
| Portfolio Tool Performance | AAA | 4.80 | 2.80 |
| Financial News Speed & Depth | C | 2.00 | 2.30 |
| Community Utility Index (CUI) | C | 2.75 | 4.00 |
| Support Infrastructure & SLA Audit | B | 3.50 | 3.50 |
Reasons to Consider Stock Rover
- Best-in-class Portfolio Tools: 4.80 with 76/80 (95%) health metric coverage.
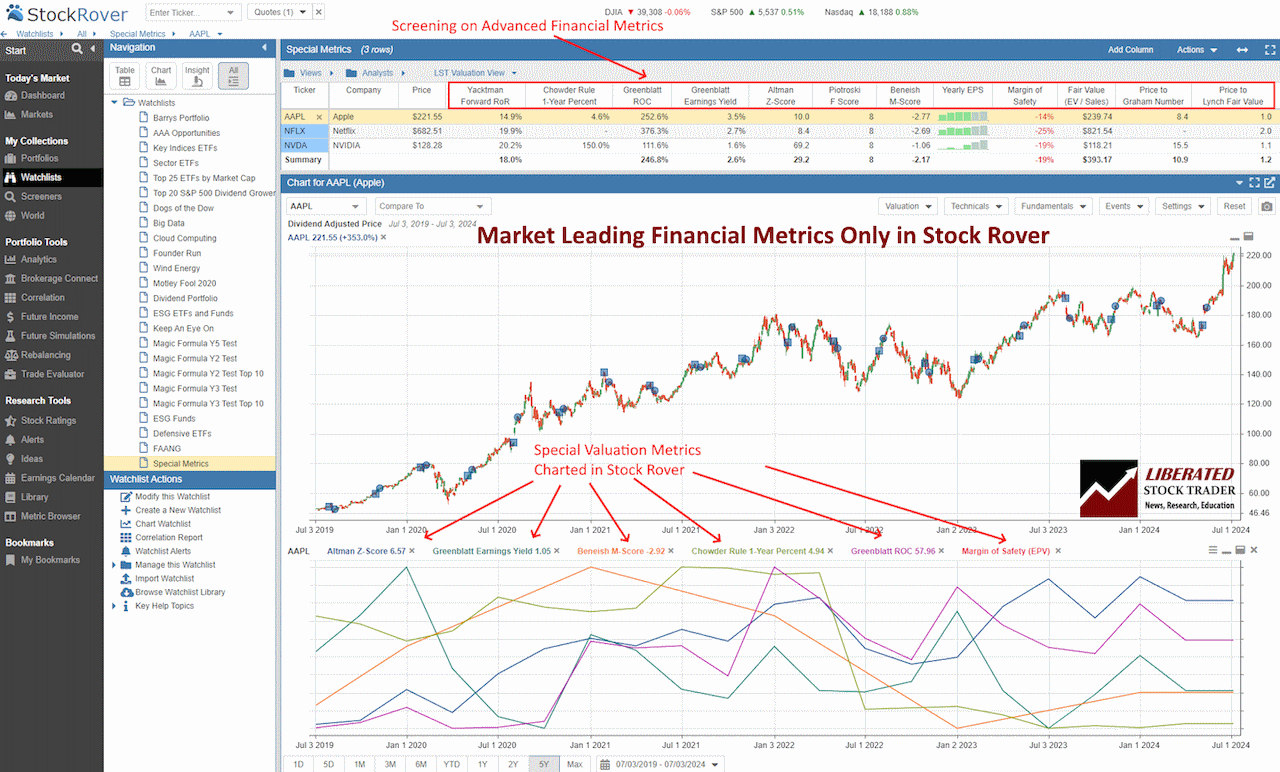
- Elite Screening Depth: 5.00 scanning score with extremely deep criteria support.
- Excellent Price Economics: $0.77/day and low EMC for a year-round research workflow.
- Low-Frictions Workflow: 5.00 speed/ease rating supports consistent research habits.
Reasons to Avoid or Pair With Another Tool
- Not a pattern trader’s platform: Chart pattern detection is effectively absent.
- Not a broker terminal: Weak ecosystem/execution depth (2.25).
- Not a news-first platform: News speed/depth is below median (2.00).
- Automation is monitoring, not trading: Alerts exist, but no bot execution reliability profile.
Verdict
If your priority is fundamentals, screening discipline, and portfolio risk control, Stock Rover earns its spot with above-median CLPS 4.37 and category-leading portfolio analytics. If your edge depends on patterns, real-time news, or in-platform execution, pair it with a trading-native platform—Stock Rover is the research and portfolio operating system, not the trading terminal.
Our 58-point scientific Finviz lab test, audit, and benchmarking include speed, accuracy, value, and feature depth with data-driven precision. Here are the 17 test categories.
Pricing Index
Stock Rover’s AAA $0.77/day is far below the median $2.74/day, which is exactly what value-focused investors want: low carrying cost for a tool you’ll use all year, not just during “active trading months.”
| Metric | Calculation | Stock Rover | High | Median | Low |
|---|---|---|---|---|---|
| Cost-per-day | $/day on an annual plan. Minimum viable plan with real-time exchange data | $0.77 | $9.99 | $2.74 | $0.74 |
| $ per feature | Effective Monthly Cost /Total Features | $1.94 | $28.92 | $4.29 | $0.00 |
| Effective Monthly Cost (EMC) | EMC = (Plan price + required real-time data fees + any required add-ons) / month | $23.33 | $376.00 | $60.00 | $0.00 |
Stock Rover is “cheap enough to keep” even if you’re not trading daily—which matters because fundamentals/portfolio work is ongoing. In my audit notes, the plan basis used here is Premium Plus Service, so you’re not comparing a stripped free-tier plan.
In Context: Pricing is not just “can I afford it”—it’s whether the tool earns its seat on your desk every day. For portfolio investors, low daily cost reduces the pressure to “force trades” just to justify subscriptions. Stock Rover’s economics fit long-horizon workflows: you pay a modest fee and use it continuously for screening, valuation, position sizing, dividend planning, and periodic rebalancing. That’s a better match than paying news-terminal prices for a platform you only open on earnings days.
Value Score (VP)
Stock Rover’s Value Score is 3.63, comfortably above the median 2.82. This score blends feature quality and feature breadth/depth—and Stock Rover does well because its fundamental database and portfolio analytics are genuinely usable, not checkbox features.
| Metric | Calculation | Stock Rover | High | Median | Low |
|---|---|---|---|---|---|
| Value Score | Sum of Value Rank, Feature Quality, Breadth, Depth & Device Support | 3.63 | 4.37 | 2.82 | 1.70 |
| Value Rank | Relative value rank, based on score to price | 4.00 | 5.00 | 3.00 | 1.00 |
| Feature Quality | Subjective evaluation of feature quality. Scale 0 to 5, 0 is no features. | 4.00 | 5.00 | 3.50 | 2.00 |
| Feature Breadth | Total features. 1 Point Per Feature | 12 | 17 | 12 | 9 |
| Feature Depth | Subjective evaluation of feature depth. Scale 0 to 5 | 4.25 | 5.00 | 3.00 | 2.00 |
| Device Support Depth | 1 point per PC, Mac, Web, Android, iOS. | 2.00 | 4.00 | 4.00 | 1.00 |
| Value Score Test Winners | TradingView 4.37 | TrendSpider 4.20 | Trade Ideas 4.05 |
The “value” story here is straightforward: strong research depth at a low cost, with the main tradeoff being the depth of device support. If you need full cross-device parity (especially mobile-first), this is the one weak link in an otherwise high-value package.
Stock Rover’s value is rooted in fundamentals and portfolio discipline: faster screening, cleaner validation of thesis (quality, valuation, growth, risk), and better ongoing monitoring. If your strategy is long-term compounding and risk control, that’s real ROI. If you’re day trading off patterns and executions, you’ll pay for features you won’t use.
In Context: Value Score is the “regret filter.” It tells you whether you’ll look back in 90 days and think “I paid for fluff,” or “this actually changed my decision quality.”
Speed & Ease of Use
Stock Rover scores a best-in-class AAA AAA vs the median 4.50. That means low friction: you can get from “idea” to “decision” quickly without wrestling with menus or loading delays.
| Metric | Calculation | Stock Rover | High | Median | Low |
|---|---|---|---|---|---|
| Speed & Use Index Rating | Average of Time to Chart Performance, Multimonitor Chart Speed & 3 Click | 5.00 | 5.00 | 4.50 | 3.25 |
| Time to Chart Speed (Seconds) | Seconds from clicking the icon to a fully loaded chart with 200 price bars & 2 indicators. | 4.04 | 17.03 | 4.70 | 1.55 |
| Time to Chart Performance | 17.03 – 1.55 / seconds from clicking tool icon to chart | 4.50 | 5.00 | 4.50 | 1.00 |
| Multi-Chart Latency (ms) | Delay in milliseconds when syncing 4 monitors/charts. | 295 | 2000 | 375 | 20 |
| 3-Click Rule Test | Number of Clicks to view a chart or a scan | 2 | 10 | 2 | 2 |
| Speed & Ease of Use Test Winners | TradingView 5.00 | Stock Rover 5.00 | Seeking Alpha 5.00 |
In my audit notes, I flagged that a deep, fundamental database can take time to initialize; that’s normal for data-heavy tools, but Stock Rover is lightning-fast.
In Context: Speed isn’t “nice to have” when you’re screening hundreds of tickers and validating a thesis; it’s the difference between doing the work and procrastinating it. Stock Rover’s speed profile supports investor workflows: jump from screener to fundamentals to portfolio impact quickly, without UI friction.
The “3-click” result matters because it reflects learnability—if it’s fast to reach the right view, you’ll use it more often. If you research weekly and rebalance monthly, this is the kind of speed that compounds.
Chart Analysis Depth Index
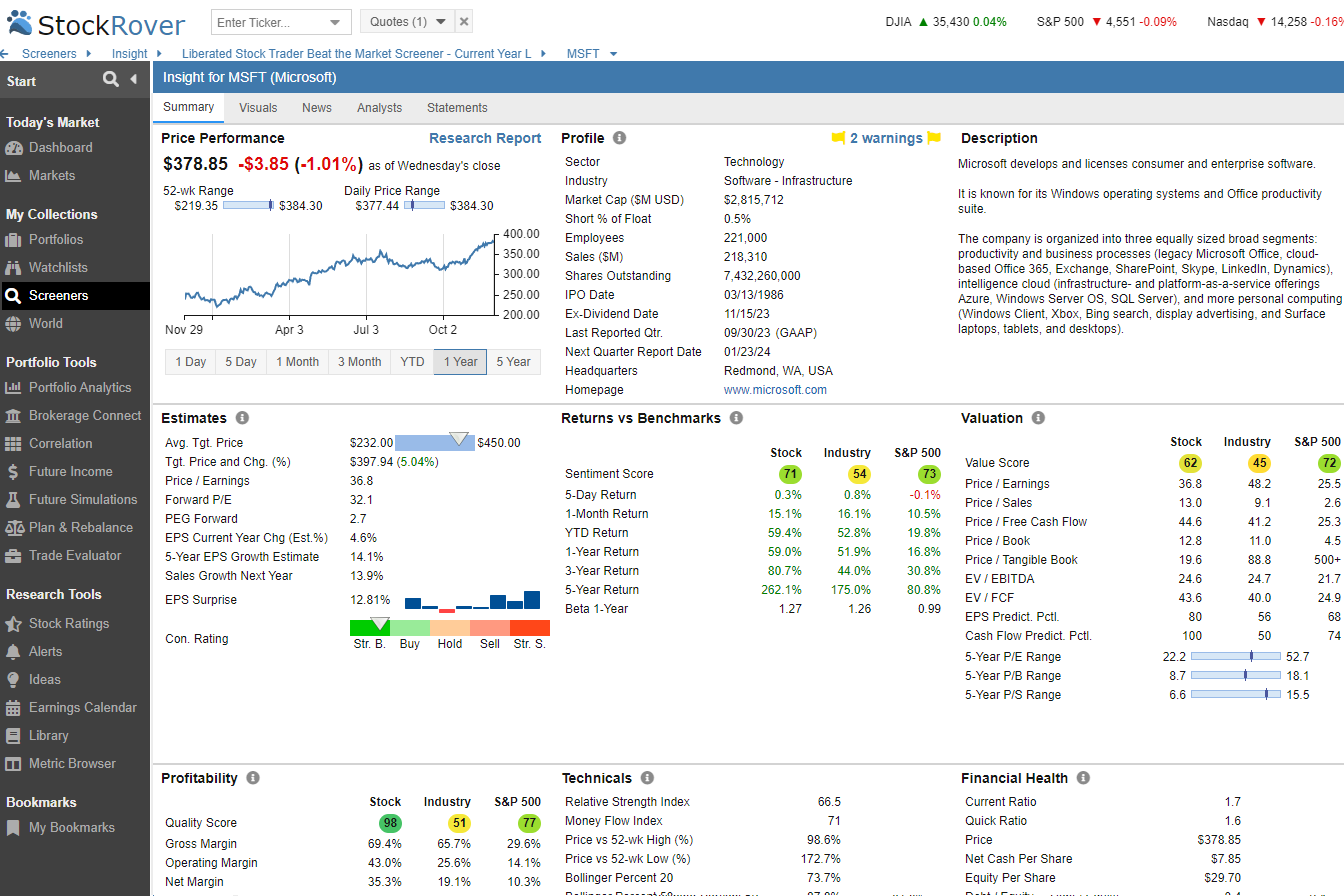
Stock Rover scores rating [v=”4.50″ show=”tier”] 4.50, well above the median 3.50. This is not a day-trader charting terminal, but it’s more than sufficient for investors who want price context alongside fundamentals.
| Metric | Calculation | Stock Rover | High | Median | Low |
|---|---|---|---|---|---|
| Chart Analysis Depth Index | Avg of Chart Types, Indicator Depth, Custom Coding | 4.50 | 5.00 | 3.50 | 2.00 |
| Chart Types Total Count | Total number of chart types. 0.2 per chart type | 10 | 22 | 12 | 0 |
| Chart Types Depth | 22 chart types = 5 points. 0.2 point per chart type | 2.00 | 5.00 | 3.00 | 0.00 |
| Indicators Total Count | Total number of indicators. 0.001 points per indicator | 300 | 700 | 228 | 0 |
| Indicator Depth | 700 indicators = 5 points. 0.2 point per chart type | 2.00 | 5.00 | 2.00 | 0.00 |
| Custom Indicator Coding | Exists 5 Points | 0.00 | 5.00 | 5.00 | 0.00 |
| Chart Analysis Depth Index Test Winners | TradingView 5.00 | MetaStock 5.00 | Optuma 5.00 |
In my audit notes, I highlight what Stock Rover excels at: fundamental ratios and comparisons (with a large set of fundamental indicators). The tradeoff is that you cannot code custom indicators.
The real advantage is how charts connect to fundamentals: you can validate whether price action matches underlying quality and valuation changes. If you need advanced custom studies and pattern tooling, pair it with a charting-native platform.
In Context: Chart depth matters differently for investors than day traders. You’re not trying to scalp ticks—you’re trying to avoid buying a “value trap” or adding risk at the wrong time. Stock Rover’s charts are useful for confirming trend regime, volatility, and timing entries/exits around your fundamental thesis.
Chart Pattern Depth & Accuracy
This category is not applicable to Stock Rover, and my dataset shows no test scores here. That’s not a flaw—it’s an honest product focus decision: Stock Rover is built for fundamentals and portfolio analytics, not automated chart pattern detection.
| Metric | Calculation | Stock Rover | High | Median | Low |
|---|---|---|---|---|---|
| Pattern Recognition Efficacy & Accuracy | Pattern Depth Points + Pattern Accuracy Points | – | 4.50 | 2.73 | 1.00 |
| Total Patterns | Total Patterns Scanned | – | 226 | 57.50 | 0 |
| Pattern Recognition Depth | 0.022 points per detected pattern | – | 5.00 | 1.00 | 0.00 |
| Candle Patterns Recognized | Total patterns | – | 150 | 57.50 | 0 |
| Chart Pattern Recognition & Accuracy Test Winners | TrendSpider 4.88 | Trade Ideas 4.62 | TradingView 3.98 |
In my audit notes: “Zero pattern logic; focuses on fundamental data.” If pattern trading is your edge, this is simply the wrong tool class.
In Context: Pattern recognition is primarily a trader feature: it automates visual setups and short-term triggers. Stock Rover’s audience is different—investors who want quality screens, valuation discipline, and portfolio oversight.
For them, “pattern depth” won’t move returns nearly as much as avoiding weak balance sheets, overpaying for growth, or drifting into unintended risk concentration. The right interpretation isn’t “Stock Rover fails here,” it’s “use the correct specialist tool if patterns are your strategy.” Stock Rover stays in its lane—and that’s good.
Scanning Performance
Stock Rover posts an elite AAA 5.00 vs a 4.50 median. This is a core strength: fast, deep filtering and a large set of criteria—ideal for systematic investors.
| Metric | Calculation | Stock Rover | High | Median | Low |
|---|---|---|---|---|---|
| Market Scanning Latency & Depth | Avg of Scanner Speed Points, Criteria Depth, and Custom Coding | 5.00 | 5.00 | 4.50 | 3.00 |
| Scanner Performance (ms) | Milliseconds to search the entire S&P 500 across 5 different criteria. | 131 | 2000 | 194 | 36 |
| Scanning Speed (ms) | <100ms 5 points, <200ms 4.5 points, <500ms 4 points, <1000ms 3 points, <2000ms 2 points | 4.50 | 5.00 | 4.50 | 2.00 |
| Scanning Criteria & Depth | Total Criteria Count | 675 | 675 | 257 | 30 |
| Scanning Criteria | Scanning Criteria 0.0125 points per criteria | 0.00 | 5.00 | 3.21 | 0.38 |
| Custom Code Scanning | Exists 5 Points | 5.00 | 5.00 | 5.00 | 0.00 |
| Scanning Performance Test Winners | Stock Rover 5.00 | TradingView 4.83 | TrendSpider 4.67 |
The big caveat is the Auto-Refresh Rate row: it’s not scored, and “0” should be read as “not part of the test” rather than “instant refresh.” Practically: Stock Rover is outstanding for research screening, not necessarily for intraday scanning.
If you require intraday auto-refresh scanning for momentum entries, use a trader scanner; for fundamentals-based universes, Stock Rover is exactly the right tool.
In Context: Screening is where investor edge often lives: the quality of your candidates determines the ceiling on returns. Stock Rover’s strength is deep factor-based filtering—valuation, profitability, balance sheet health, growth stability, dividends, and more—at a speed that makes iteration painless. That matters because real screening is iterative: you tighten rules, sanity-check, and re-run until the output matches your thesis.
Backtesting Performance
Stock Rover lands at 4.00, matching the 4.00 median. It shows strong speed and flexibility, but weaker reporting depth in this benchmark—so it’s better for “quick validation” than for institutional-grade analytics.
| Metric | Calculation | Stock Rover | High | Median | Low |
|---|---|---|---|---|---|
| Quantitative Backtesting Fidelity | Avg. speed, flexible coding, report quality, multi-asset, no-code req. | 4.00 | 5.00 | 4.00 | 1.50 |
| Backtesting Speed (ms) | Time required to run a strategy simulation over 10 years | 103 | 2422 | 204 | 103 |
| Backtesting Speed (ms) Points | <200ms 5 points, <400ms 4.5 points, <600ms 4 points, <1000ms 3 points, <2000ms 2 points | 5.00 | 5.00 | 4.50 | 2.00 |
| No Coding Required | Exists | 5.00 | 5.00 | 1.00 | 0.00 |
| Flexible Coding | 5 for full custom coding, 3 for rules-based logic only, 1 for fixed template testing | 5.00 | 5.00 | 5.00 | 1.00 |
| Backtesting Report Quality | Advanced metrics and reports. 1-100%. | 15 | 100 | 50 | 0 |
| Backtesting Report Quality Points | 20% = 1 point, 40% = 2 points, 60% = 3 points, 80% = 4 points, 100% = 5 points | 0.00 | 5.00 | 2.50 | 0.00 |
| Multi-Stock Basket Backtesting | 5 for basket backtesting, 0 for single stock only | 5.00 | 5.00 | 5.00 | 0.00 |
| Backtesting Performance Test Winners | Optuma 4.94 | TrendSpider 4.88 | MetaStock 4.81 |
The headline: fast backtests and strong flexibility, but thin reporting in this rubric. If you need deep stats (distribution, regime splits, robustness), you’ll likely pair Stock Rover with a dedicated backtesting engine.
The limitation is reporting depth: if you’re doing serious strategy research, you want more diagnostics than a simple equity curve. For most investors, fast + flexible is enough to avoid bad ideas before real money is at risk.
In Context: Backtesting is not just “did it work?”—it’s “why did it work, and will it survive?” Many investors use backtests to sanity-check factor tilts (value, quality, dividend growth) and portfolio rules (rebalance cadence, constraints). Stock Rover’s strength is making those tests easy and fast.
Trading Bot & Auto-Trading Reliability
Stock Rover scores 2.50, above the median 1.50, but this is still not an automation platform. It supports alerting and monitoring, not broker-connected, resilient execution.
| Metric | Calculation | Stock Rover | High | Median | Low |
|---|---|---|---|---|---|
| Automated Execution & Bot Reliability | Avg of Execution Path, Strategy Sophistication and Operational Assurance | 2.50 | 5.00 | 1.50 | 0.00 |
| Automation Path | 1 = alerts only, 3 = webhook/API to broker, 5 = native bot/trading execution | 1.00 | 5.00 | 1.00 | 0.00 |
| Strategy/Bot Sophistication | Avg sophistication rating | 1.50 | 5.00 | 2.00 | 0.00 |
| Operational Assurance | (SLA + monitoring + failover documentation). 5 = strong, 0 = none | 0.00 | 5.00 | 0.00 | 0.00 |
| Bot & Auto-Trading Reliability Test Winners | TrendSpider 4.50 | Trade Ideas 4.00 | Tickeron 4.00 |
In my audit notes: Stock Rover provides email/SMS alerts but no broker execution, webhooks, or SLA documentation. That’s fine for investors; it’s a hard “no” for hands-off automated trading.
If you want fully automated execution, you need broker connectivity, clear failure modes, and operational controls. Stock Rover instead excels at ongoing monitoring—flagging thesis breaks (fundamentals, risk, valuation) so you can decide. Pair it with a broker or bot tool if automation is the goal.
In Context: Automation reliability matters when your strategy depends on execution timing and system uptime. Stock Rover is not designed to be the “hands” that trade; it’s designed to be the “brain” that screens and monitors. Investors often confuse these roles and buy the wrong platform.
AI & Algo Index
Stock Rover hits 2.50, slightly above the median 2.00. The story is: real algorithmic structure (factor models and rules), strong transparency, but no AI layer.
| Metric | Calculation | Stock Rover | High | Median | Low |
|---|---|---|---|---|---|
| Algorithmic Intelligence & AI Tier Index | Sum of Algo Depth, AI Layer & Transparency Points | 2.50 | 5.00 | 2.00 | 1.00 |
| Algo Depth | 0.5 = Screeners/alerts only; 1.0 = Rules-based logic; 1.5 = Backtesting+factor models; 2.0 = advanced quant platform | 1.50 | 2.00 | 1.50 | 1.00 |
| AI Layer | 0 = none; 1 = assistive AI; 1.5 = ML signals core feature; 2 = AI-native decisioning | 0.00 | 2.00 | 0.00 | 0.00 |
| Transparency | 0 = black box; 0.5 = partial; 1 = clear methodology + validation artifacts | 1.00 | 1.00 | 1.00 | 0.00 |
| AI & Algo Index Test Winners | TrendSpider 5.00 | Trade Ideas 4.50 | Tickeron 4.50 |
If you want explainable, repeatable screening logic, this is a positive profile. If you want ML forecasts or agentic “AI picks,” Stock Rover isn’t trying to be that—and the score reflects it.
In Context: “AI” is often marketing. What investors need is clear rules, consistent rankings, and transparency into why a stock qualifies. Stock Rover’s algorithmic value is a factor-based structure—screening and rating logic that you can understand and iterate on. That reduces decision noise and helps you avoid style drift.
A pure AI layer can be useful, but it can also become a black box that’s hard to trust when markets change if your edge is disciplined process, transparency, and algorithm depth matter more than flashy AI.
Alert Speed
Stock Rover posts 2.67, above the median 1.50, but this category is nuanced: it supports many alerts, but it’s not designed for low-latency trading triggers.
| Metric | Calculation | Stock Rover | High | Median | Low |
|---|---|---|---|---|---|
| Alert Trigger Latency & Delivery Speed | Avg of concurrent alerts, alert streams richness & alert speed rating | 2.67 | 5.00 | 1.50 | 0.00 |
| Concurrent Alerts | How many concurrent alerts (1 point per 50, to a max of 5 points) | 5.00 | 5.00 | 1.00 | 0.00 |
| Concurrent Alert Count | Total number of concurrent alerts | Unlimited | Unlimited | 75 | 0 |
| Alert Streams Richness | Multi-channel streams (email, webhook, sms, app alert). 1 point per stream, max 5 points. | 2.00 | 5.00 | 2.00 | 0.00 |
| Alert Speed Rating | User tested alert latency timing (0-5) | 1.00 | 5.00 | 0.00 | 0.00 |
| Alert Speed Test Winners | TradingView 4.67 | TrendSpider 4.33 | Benzinga Pro 4.33 |
In my audit notes: alerts exist (email/text), but there’s no clear latency disclosure. Practically, treat Stock Rover alerts as investor notifications—not scalper-grade execution signals.
Stock Rover’s alert profile fits monitoring: watchlists, thesis-break triggers, and scheduled review. If your strategy relies on intraday timing, choose a trading-native alert engine; if your strategy requires discipline over months, Stock Rover alerts are usually sufficient.
In Context: Alerts are only as good as the action you can take after receiving them. For long-term investors, an alert that says “valuation got stretched” or “fundamentals deteriorated” is valuable, even if it arrives minutes later. For day traders, that delay can destroy the edge.
Trade Signal Quality
Stock Rover scores 2.50 vs a median of 0.00. The key interpretation: Stock Rover can guide decisions through rankings and factor signals, but it’s not a “buy/sell call” machine.
| Metric | Calculation | Stock Rover | High | Median | Low |
|---|---|---|---|---|---|
| Signal Alpha & Predictive Efficacy | Avg of Signal Quality and Recommendations | 2.50 | 5.00 | 0.00 | 0.00 |
| Trade Signal Quality Test Winners | Trade Ideas 5.00 | Seeking Alpha 5.00 | Tickeron 5.00 | Motley Fool 5.00 |
If you want trade signals with predictive claims, look elsewhere. If you want structured decision support (quality/valuation filters that reduce mistakes), this is a meaningful “signal” category score.
In Context: “Signals” can mean two very different things: (1) short-term trading calls, or (2) systematic evidence that improves long-term decision quality. Stock Rover is the second type. Its value comes from reducing errors, buying low-quality companies, overpaying, ignoring concentration risk, or missing dividend sustainability issues. Those are the mistakes that quietly destroy compounding. If you’re looking for “enter now, exit now” signals, you’ll be disappointed. If you want signals that keep your process honest, Stock Rover is a good fit.
Broker Connectivity & Ecosystem Depth
This is a weak category for Stock Rover: 2.25 vs the median 4.50. The reason is simple: Stock Rover is not a live execution platform.
| Metric | Calculation | Stock Rover | High | Median | Low |
|---|---|---|---|---|---|
| Asset & Data Coverage Index | Avg of broker integration, asset & data coverage, and live trading | 2.25 | 5.00 | 4.50 | 0.00 |
| Live Trading | Total number of brokers supported for direct, live trade execution. | N/A | 5.00 | 5.00 | 0.00 |
| Total number of brokers integrated | Total number of brokers supported for direct, live trade execution. | 100 | 100 | 50 | 0 |
| Broker Integration Points | 0.5 points for each broker. 100 = 5 points | 2.50 | 5.00 | 2.50 | 0.00 |
| Asset & Data Coverage Points | Stocks, Options, FX, USA Exchanges, International Exchanges. 1 point each | 1.00 | 4.00 | 4.00 | 0.00 |
| Broker Connectivity & Ecosystem Test Winners | TradingView 5.00 | MetaTrader 5.00 | TrendSpider 4.43 |
Interpretation: great for account connectivity/tracking, not for execution and multi-asset coverage. If you trade options/FX/crypto directly inside your platform, this won’t be your hub.
In Context: Ecosystem depth matters when you want one place to research, execute, and manage orders. Stock Rover’s ecosystem strength is “portfolio visibility,” not trading infrastructure. Many investors don’t need in-platform execution—they use their broker directly and want a better research layer on top. That’s a valid setup: Stock Rover becomes the decision engine, the broker becomes the execution engine.
If you want tight integration (alerts → orders → risk controls), pick a charting/trading platform. If you want better decision-making and oversight, broker connectivity for tracking may be sufficient.
Portfolio Tool Performance
This is Stock Rover’s signature win: AAA 4.80 vs the median 2.80, tying for best-in-class with Portfolio123 in this dataset.
| Metric | Calculation | Stock Rover | High | Median | Low |
|---|---|---|---|---|---|
| Portfolio Health & Risk Analytics | Health Check & Reporting Depth % of “Critical Financial Metrics” covered | 4.80 | 4.80 | 2.80 | 2.00 |
| Portfolio Tool Performance Test Winners | Stock Rover 4.80 | Portfolio 123 4.80 | Seeking Alpha 4.30 |
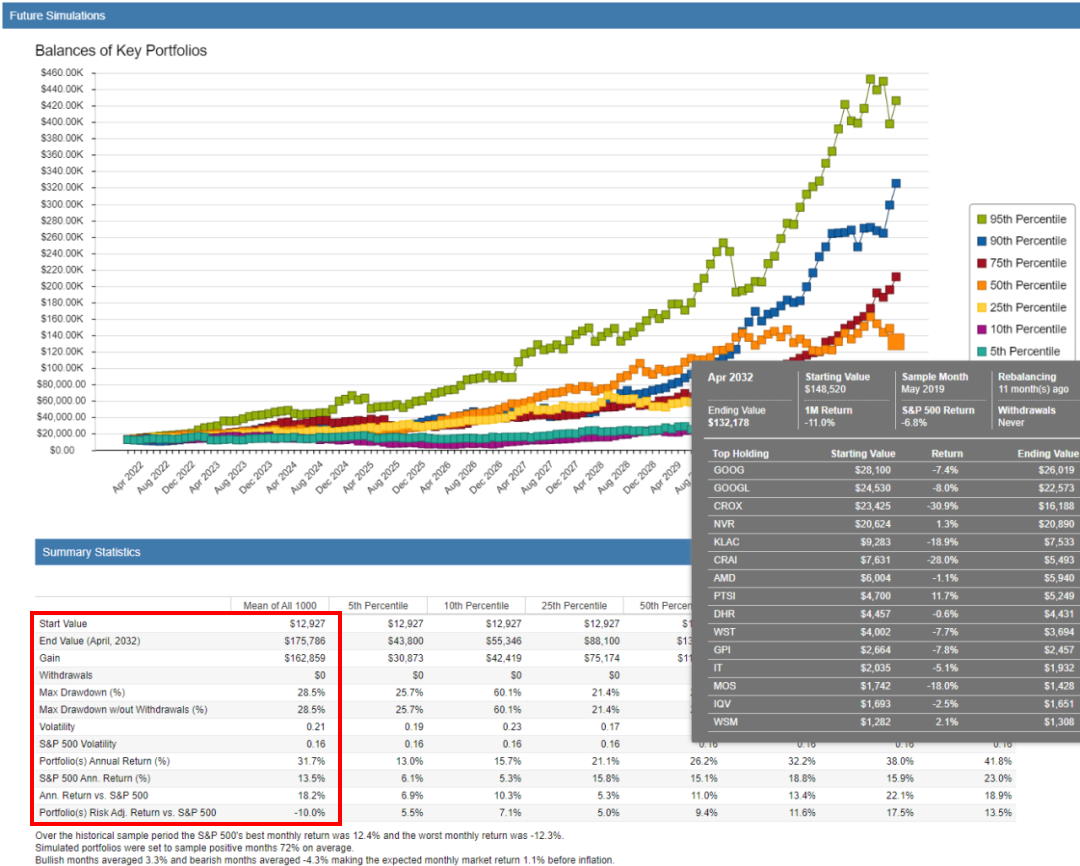
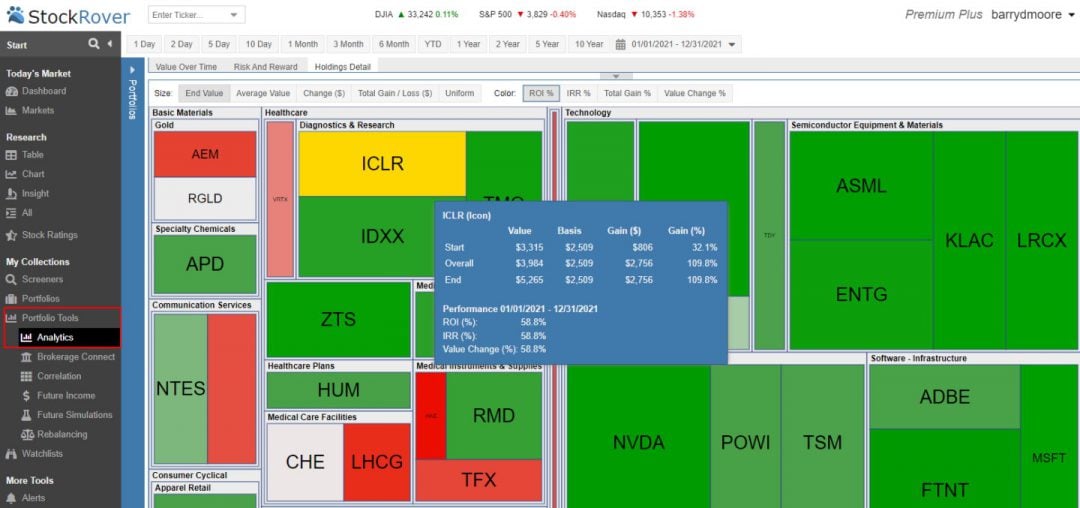
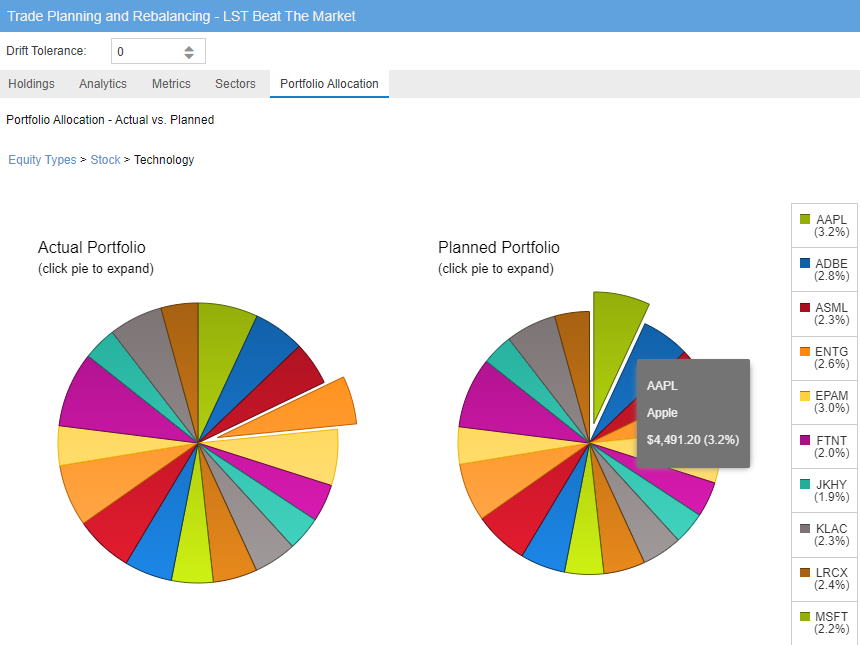
In my audit notes, I highlighted the real-world “portfolio operator” features: emailed performance reports, correlation tools, dividend projections, rebalancing, and Monte Carlo simulation. That’s the difference between owning stocks and running a portfolio.
In Context: Portfolio analytics is where investors quietly win: better diversification, fewer hidden concentration risks, and a clearer understanding of what actually drives returns (factors, sectors, macro exposure). Stock Rover’s strength is making these insights usable without requiring a quant background.
The “health check” metric matters because it captures coverage: risk metrics, dividends, correlations, and portfolio diagnostics. If you manage a real portfolio (not just a watchlist), this category often determines whether a tool becomes indispensable. That’s Stock Rover’s core value proposition.
Financial News Speed & Depth
Stock Rover scores 2.00, slightly below the median 2.30. It’s not a news terminal, and it shouldn’t be judged like one.
| Metric | Calculation | Stock Rover | High | Median | Low |
|---|---|---|---|---|---|
| Financial News Speed & Quality Rating | Avg of News Speed Rating and Depth of News & Summaries | 2.00 | 5.00 | 2.30 | 0.75 |
| Financial News Speed & Depth Test Winners | MetaStock 5.00 | Benzinga Pro 5.00 | Scanz 5.00 |
In my audit notes: “Not designed for news trading… best effort… for fundamentalists.” That’s the correct framing—use Stock Rover for research, not for racing headlines.
Stock Rover’s role is to help you understand what you own, why you own it, and what risks you’re taking. If you do need real-time news, pair Stock Rover with a dedicated news service. You’ll get better results than expecting a single platform to be both a research lab and a newswire terminal.
In Context: News speed matters most when your strategy is event-driven: earnings reactions, breaking headlines, and intraday catalysts. For fundamentals-first investors, news is usually a confirming input, not a trading trigger—what matters is context, not milliseconds.
Community Utility Index (CUI)
Stock Rover scores 2.75, below the median 4.00. This isn’t a “social charting” platform, so the lower community score is expected.
| Metric | Calculation | Stock Rover | High | Median | Low |
|---|---|---|---|---|---|
| Community Utility Index | Avg of Active Community Size, Quality, and Community Features | 2.75 | 5.00 | 4.00 | 2.00 |
| Active Community Size | Millions of active users 5. 1000 active users = 0 | 2.50 | 5.00 | 4.00 | 0.00 |
| Community Content Quality | Assessed 0 to 5 | 3.00 | 5.00 | 4.00 | 1.00 |
| Community Features | Social trade idea sharing, private chat, and sharing indicators/scripts. 0-5 | 2.75 | 5.00 | 4.00 | 1.00 |
| Community Utility Index Test Winners | TradingView 5.00 | MetaTrader 5.00 | Trade Ideas 4.75 |
For many investors, this isn’t a negative. In fact, fewer “hot takes” can be a feature, not a bug—especially if your edge is process discipline.
Stock Rover is positioned as a research workstation: you bring your thesis, and it gives you tools to validate it. If you want idea flow and social confirmation, you’ll get more from TradingView-style ecosystems.
If you want less distraction and more evidence, a smaller community footprint may actually improve decision hygiene. Choose based on how you personally make decisions—social reinforcement vs independent research.
In Context: Community features help when you learn by observing other traders’ setups, scripts, and shared charts. But communities can also create noise and performance-chasing.
Support Infrastructure & SLA Audit
Stock Rover is exactly median here at 3.50. That’s “solid support” rather than elite, and for most investors, that’s acceptable—especially if documentation is strong.
| Metric | Calculation | Stock Rover | High | Median | Low |
|---|---|---|---|---|---|
| Support SLA Audit: Time-to-Human Benchmarks | Average of Support Communication Channels & Support Response Time Scores | 3.50 | 5.00 | 3.50 | 1.00 |
| Support Communication Channels | Communication Channels (The “Access” Scale) | 3.00 | 5.00 | 3.00 | 1.00 |
| Support Response Times | Response Times (The “SLA” Scale) | 4.00 | 5.00 | 3.50 | 1.00 |
| Stated SLA & Tested Outcomes | ~2-4 Hours | – | – | – |
| Support Infrastructure & SLA Audit Winners | TrendSpider 5.00 | TC2000 5.00 | ThinkorSwim 4.75 |
In my audit notes: “Methodical email-first support supported by elite-level documentation…” This is usually what you want for a serious research tool—reliable answers, not hype.
In Context: Support quality becomes critical when the tool is part of your financial workflow: portfolio imports, data integrity questions, and screening logic that needs clarification. Stock Rover’s profile suggests you can generally get help without drama, but it’s not positioned as “instant phone support” for active traders who need answers mid-session.
For most investors, good documentation plus predictable response times is the ideal mix. If you’re highly time-sensitive (intraday trading), prioritize platforms with live chat/phone SLAs; otherwise, this level is typically sufficient.