Bullish stock chart patterns in technical analysis are used to identify potential buying opportunities.
My research indicates that the most reliable and accurate bullish patterns are the cup-and-handle, with a 95% bullish success rate, the head-and-shoulders (89%), the double-bottom (88%), and the triple-bottom (87%).
The most profitable chart pattern is the bullish rectangle top, with an average profit of 51%.
Bullish chart patterns signal future price increases, but not all patterns are accurate or profitable. Discover the winning patterns that take stock traders to new heights!
Bullish Chart Pattern Reliability & Profitability
This table displays the success rates of bullish patterns (probability of a price increase in bull markets) and the average price increase after emerging through pattern resistance. For example, the Cup and Handle pattern has a 95% chance of success when the price moves up through the resistance level, with an average gain of 54%.
| Chart Pattern | Success Rate | Average Price Change |
| Cup and Handle | 95% | 54% |
| Inverse Head & Shoulders | 89% | 45% |
| Double Bottom | 88% | 50% |
| Triple Bottom | 87% | 45% |
| Descending Triangle | 87% | 38% |
| Rectangle Top | 85% | 51% |
| Bull Flag | 85% | 39% |
| Ascending Triangle | 83% | 43% |
| Falling Wedge | 74% | 38% |
| Pennant Pattern | 46% | 7% |
All statistics in this article are sourced with permission from Tom Bulkowski and his excellent book The Encyclopedia of Chart Patterns (Wiley 2021)
Automatically Identify Bullish Chart Patterns
You can automatically identify bullish patterns using TradingView. Go to TradingView and click Indicators > Technicals > Patterns. Next, select Bullish Patterns. Now, a chart with any bull pattern formations will be clearly marked.
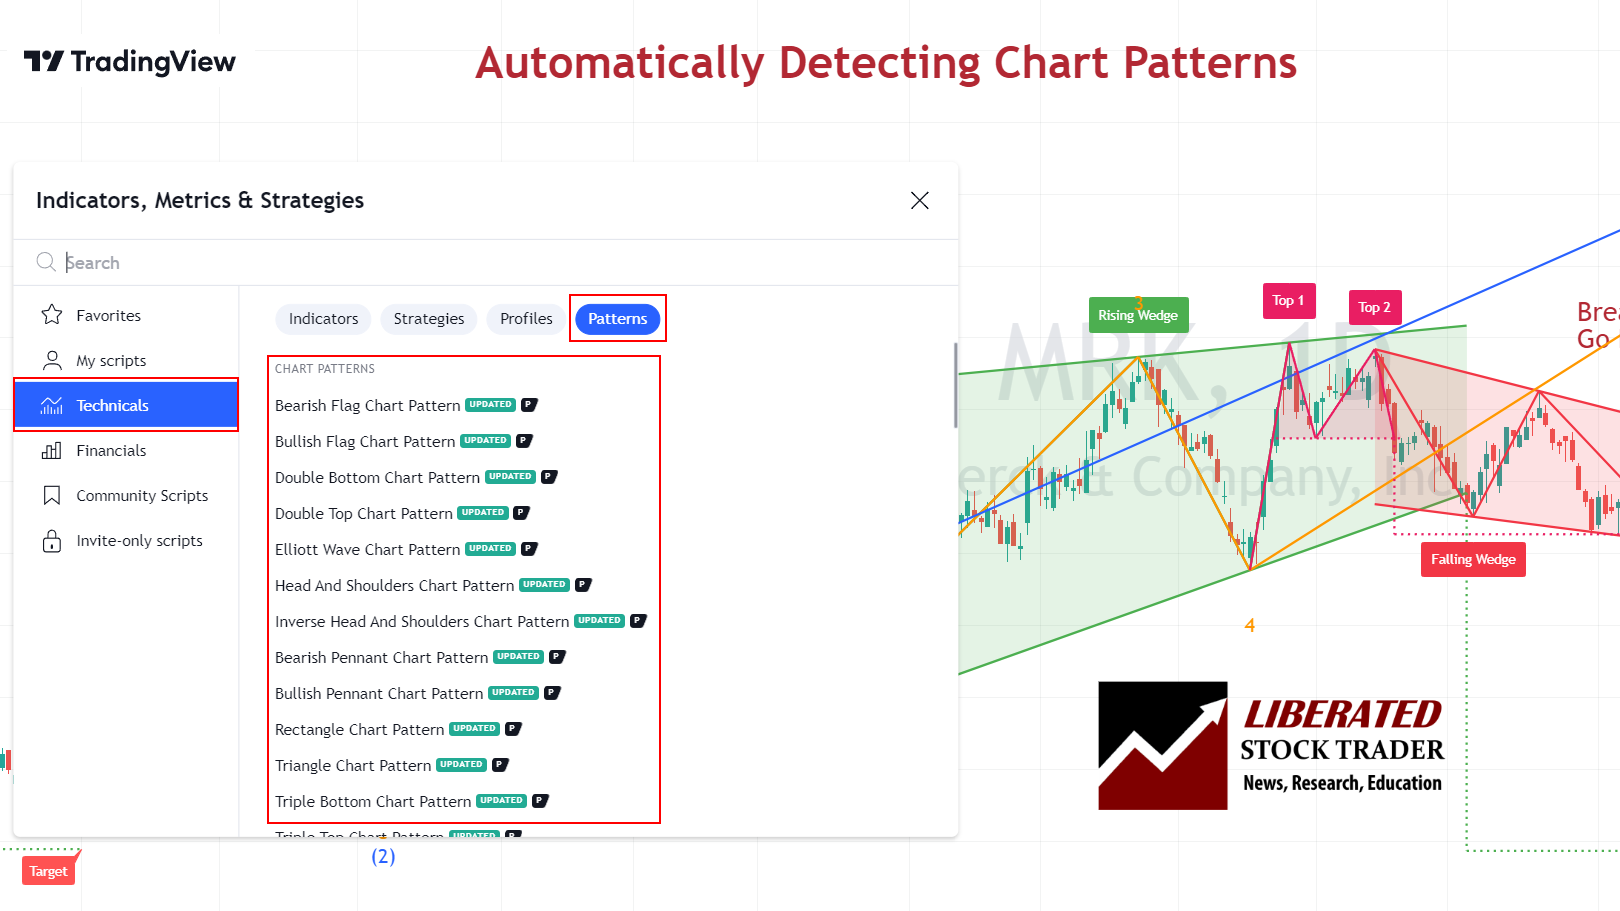
Get Automatic Pattern Recognition Free with TradingView
Scanning for Bullish Chart Patterns
There are currently two trading platforms offering bullish chart pattern scanning and screening. TrendSpider and FinViz enable complete market scanning for bullish and bearish patterns. Finviz is a fast, free pattern scanner, whereas TrendSpider enables full backtesting, scanning, and strategy testing for chart patterns.
Scanning for Bullish Patterns with TrendSpider
Scanning for bullish patterns with TrendSpider is easy. Visit TrendSpider, select Market Scanner > All of the Following > Chart Pattern > Select Pattern > Scan, and you will be presented with a list of stocks with bullish patterns.
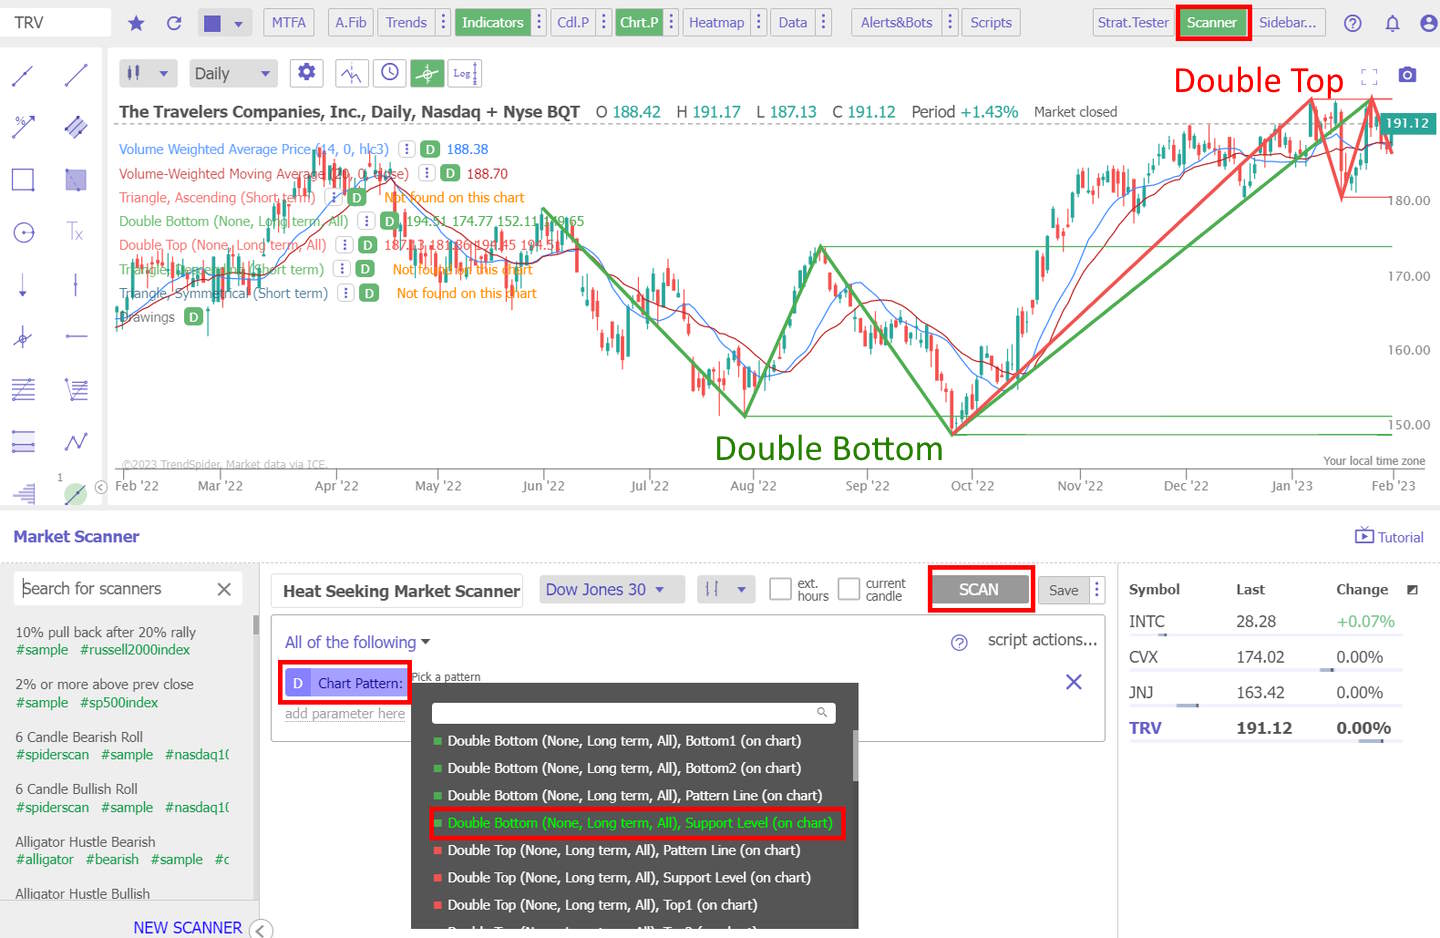
Scan for this Chart Pattern with TrendSpider
One of the major benefits of using AI-driven technical analysis tools like TrendSpider is that they allow traders to compare the performance of their strategy over different periods and markets. With TrendSpider, you can go back in time to find stocks exhibiting bullish patterns and then use the platform’s advanced analytics tools to analyze how effective this pattern was for trading at any given time.
TradingView 4.8/5⭐ : The Best Trading Platform I’ve Tested in 20+ Years
With lightning-fast charts, powerful pattern recognition, smart screening, backtesting, and a global community of 20+ million traders — it’s a powerful edge in today’s markets.

If you want one platform that gives you an edge, this is it.
Scanning For Bullish Patterns with FinViz
FinViz has a great feature for scanning bullish patterns. You can easily find stocks exhibiting this pattern by selecting Screener > Technical > Charts > Pattern > Select Pattern. This is extremely useful to traders who want to monitor potential bull trade opportunities.
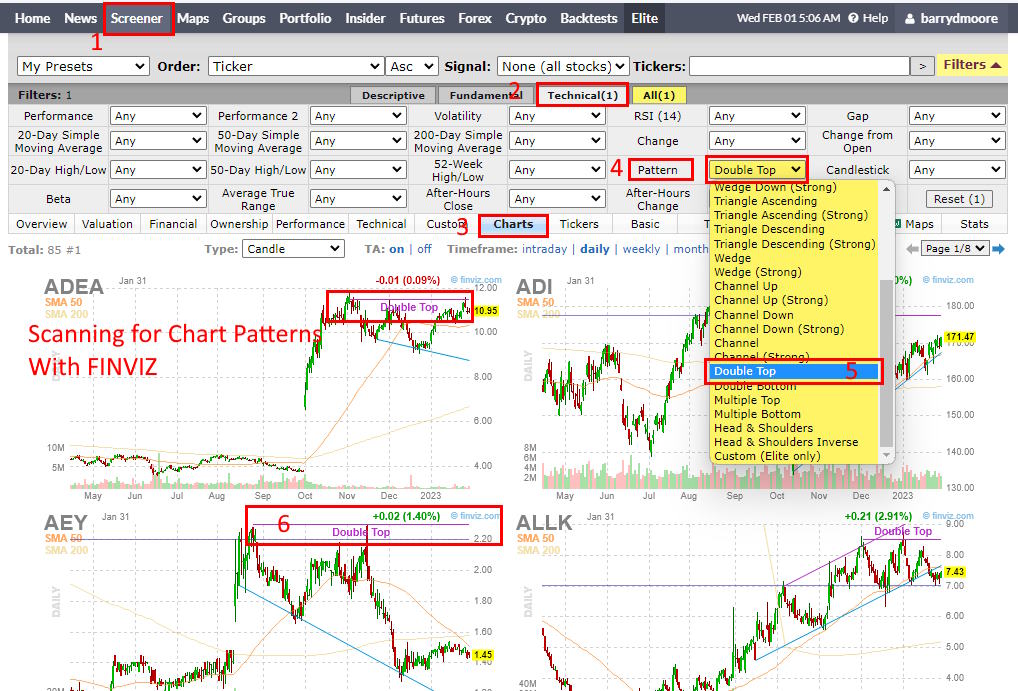
Scan for this Chart Pattern with FinViz
FinViz offers a range of pre-defined filters and sorting options, enabling traders to quickly narrow their search by sector, industry, market capitalization, and more. After selecting the desired criteria, traders can apply the filter to the Finviz screener.
10 Bullish Patterns Proven Reliable & Profitable
1. Cup and Handle Pattern: 95% Bullish
According to research, the cup and handle is a bullish continuation chart pattern, with an impressive 95% success rate. The pattern consists of two distinct parts: the cup and the handle. The “cup” portion of the pattern forms with a downward move in price, followed by an upward rally that terminates near the price level where it began. This forms a U-shape or “cup.” The “handle” forms when the price pulls back downward again, usually within a 5-20% range and near the cup’s low before resuming its upward trend.
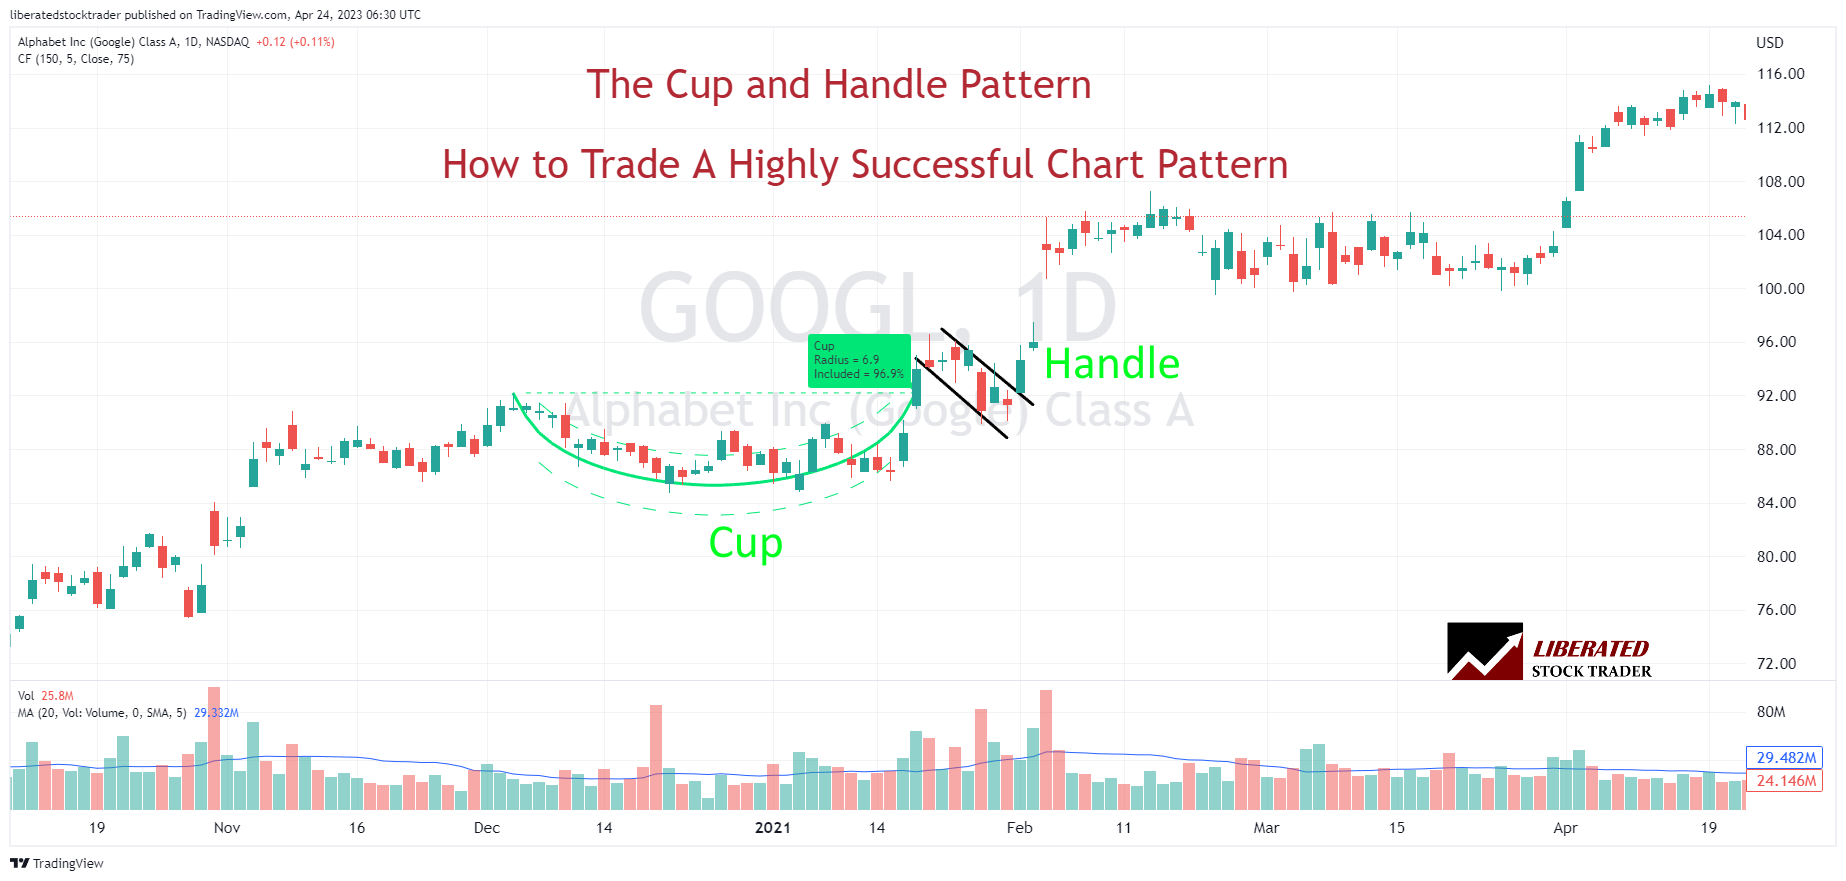
Auto-detect this Chart Pattern with TradingView
The cup and handle chart pattern is difficult to identify. First, you will notice a “cup” shape in the chart that forms when an asset’s price rises, then retraces in a long U-shape that forms over at least 30 trading days. Secondly, you will see two declining trendlines forming the “handle.” The handle should be less steep than the cup and last at least five days.
The breakout occurs when the asset’s price breaches the cup pattern’s highest point, known as the resistance line. This often indicates that a strong uptrend will occur. Traders look for a strong volume increase to confirm the breakout. After the breakout, you can expect to see a long upward price trend that lasts anywhere from several weeks to several months.
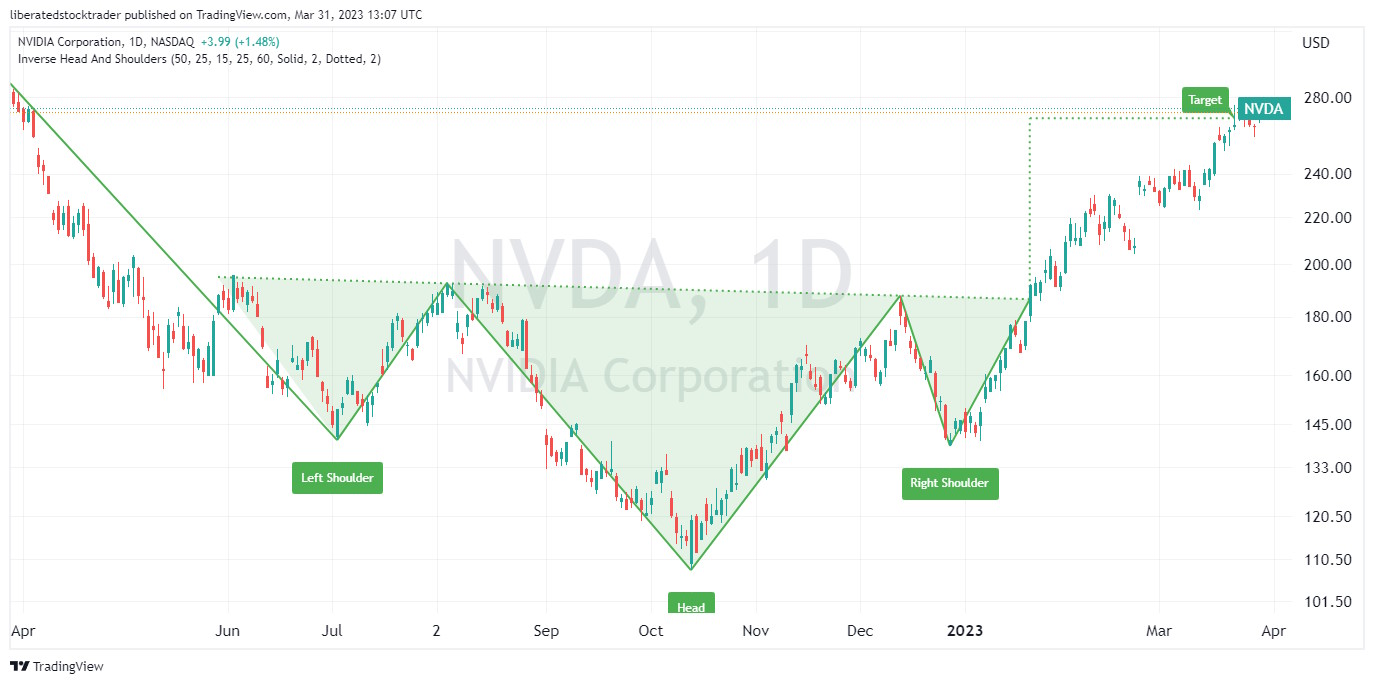
2. Inverse Head and Shoulders: 89% Bullish
The inverse head-and-shoulders pattern is an extremely bullish chart formation with a high probability of a strong uptrend. Detailed research shows an 89% success rate for reversing an existing downtrend. With an average price increase of 45%, it is one of the most reliable chart patterns.
Auto-detect this Chart Pattern with TradingView
The inverse head-and-shoulders pattern occurs when the price of a security hits the bottom three times, with two troughs forming the “shoulders” and the third lower trough forming the “head.” This pattern can indicate that the security’s price could soon begin to move higher.
The inverse head and shoulders has been used for decades as a reliable indicator of potential reversals. The pattern is highly reliable because it requires three tests of the same resistance and a neckline break before it can be considered valid. This increases the accuracy of the signal and improves its reliability.
3. Double Bottom Pattern: 88% Bullish
The double bottom chart pattern is a technical analysis trading strategy in which the trader attempts to identify a reversal point in the market. Traders look for two consecutive low points separated by an intervening peak, creating a “W” shape on the price chart.
The double bottom chart pattern is considered a reliable reversal point in the market, with an 88% success rate in bull markets. This is because buyers begin to take control of the market when the price breaks above the intervening peak, and the trend could change from bearish to bullish.
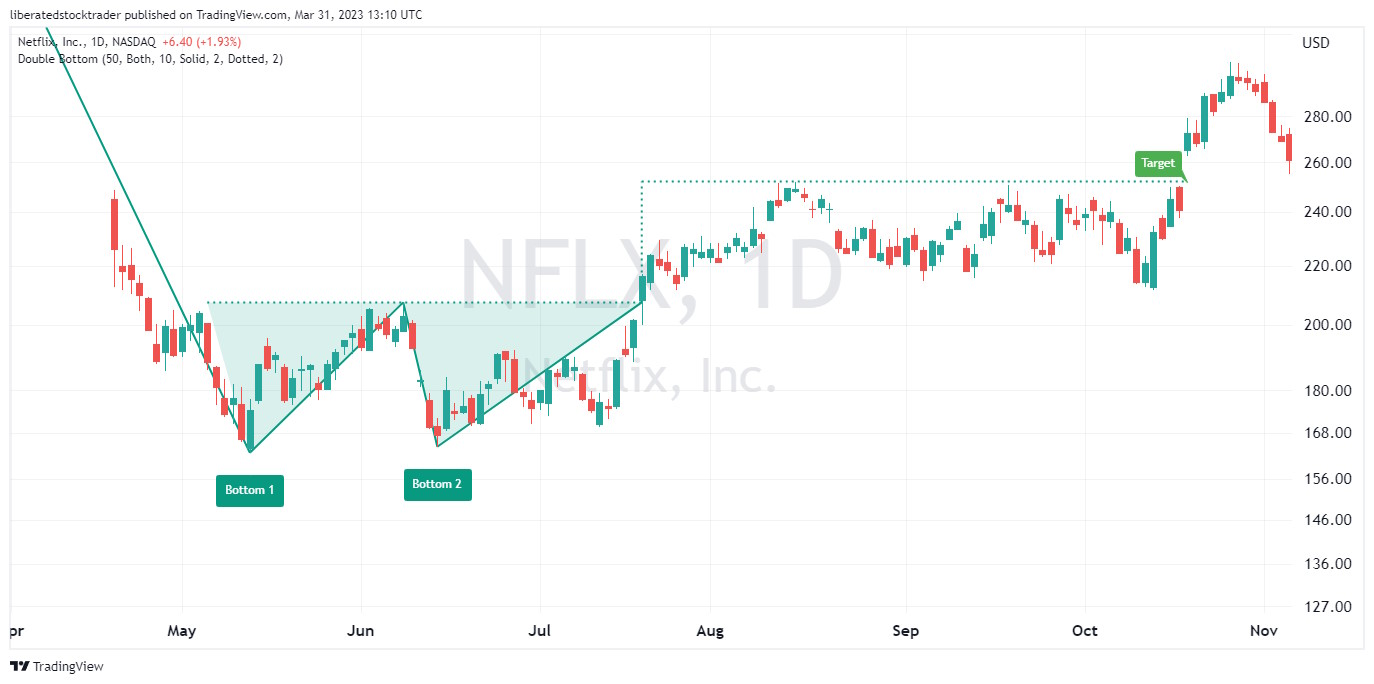
To identify a Double Bottom chart pattern, look for two distinct lows in the security’s price that form a “W”-shaped pattern. Generally, the pattern should be visible on an intraday and daily chart.
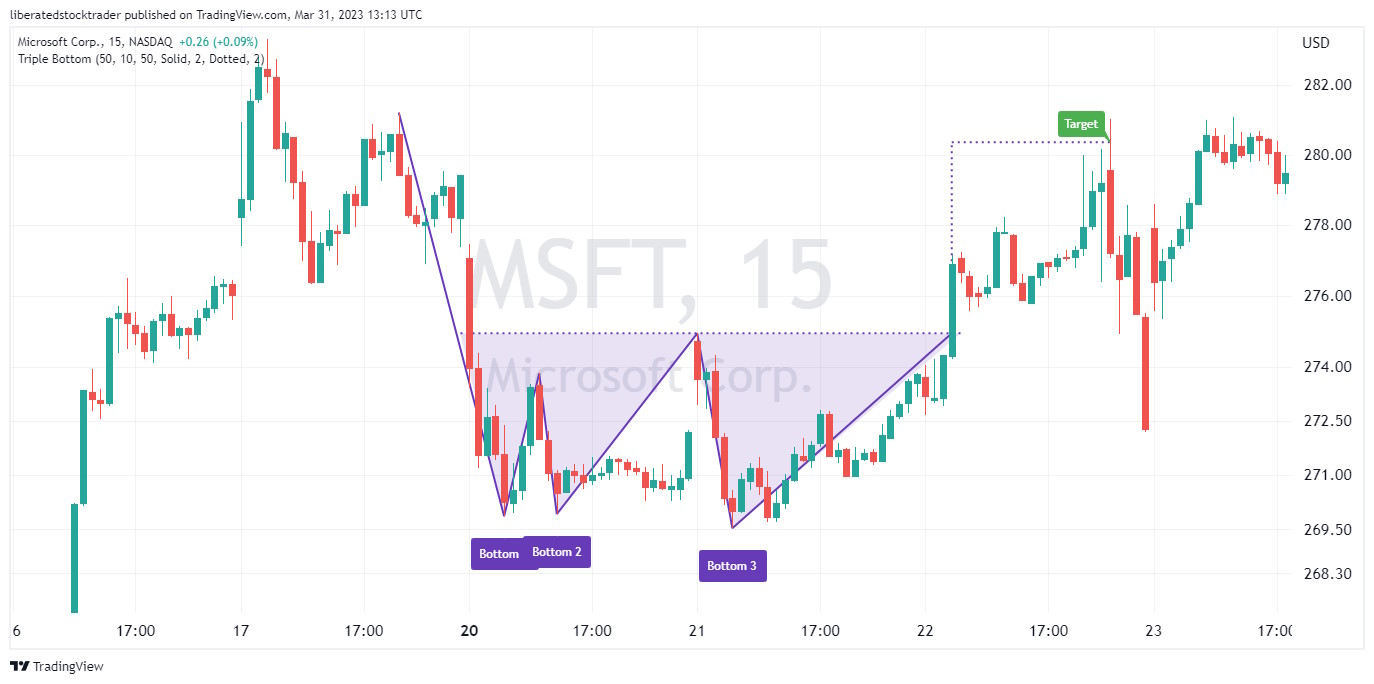
4. Triple Bottom: 87% Bullish
The triple bottom chart pattern is a technical analysis trading strategy in which the trader attempts to identify a reversal point in the market. Traders look for three consecutive low points separated by intervening peaks, creating a “VVV” shape on the price chart.
To identify a triple bottom chart pattern, look for three distinct lows in the security’s price that form a “VVV”-shaped pattern. Generally, the pattern should be visible on an intraday and daily chart. Triple bottoms occur more frequently on 15-minute and hourly charts.
Auto-detect this Chart Pattern with TradingView
The triple bottom chart pattern is considered a reliable reversal point in the market, with an 87% success rate in bull markets. This is because buyers begin to take control of the market when the price breaks above the intervening peaks, and the trend could change from bearish to bullish.
5. Descending Triangle: 87% Bullish
A descending triangle is a powerful technical analysis pattern with a predictive accuracy of 87%. The pattern is flexible and can break out up or down, and it is a continuation or a reversal pattern.
A descending triangle has one declining trendline that connects a series of lower highs and a second horizontal trendline that connects a series of lows. A descending triangle can be bearish or bullish or a reversal or continuation pattern, depending on the direction of the price breakout.
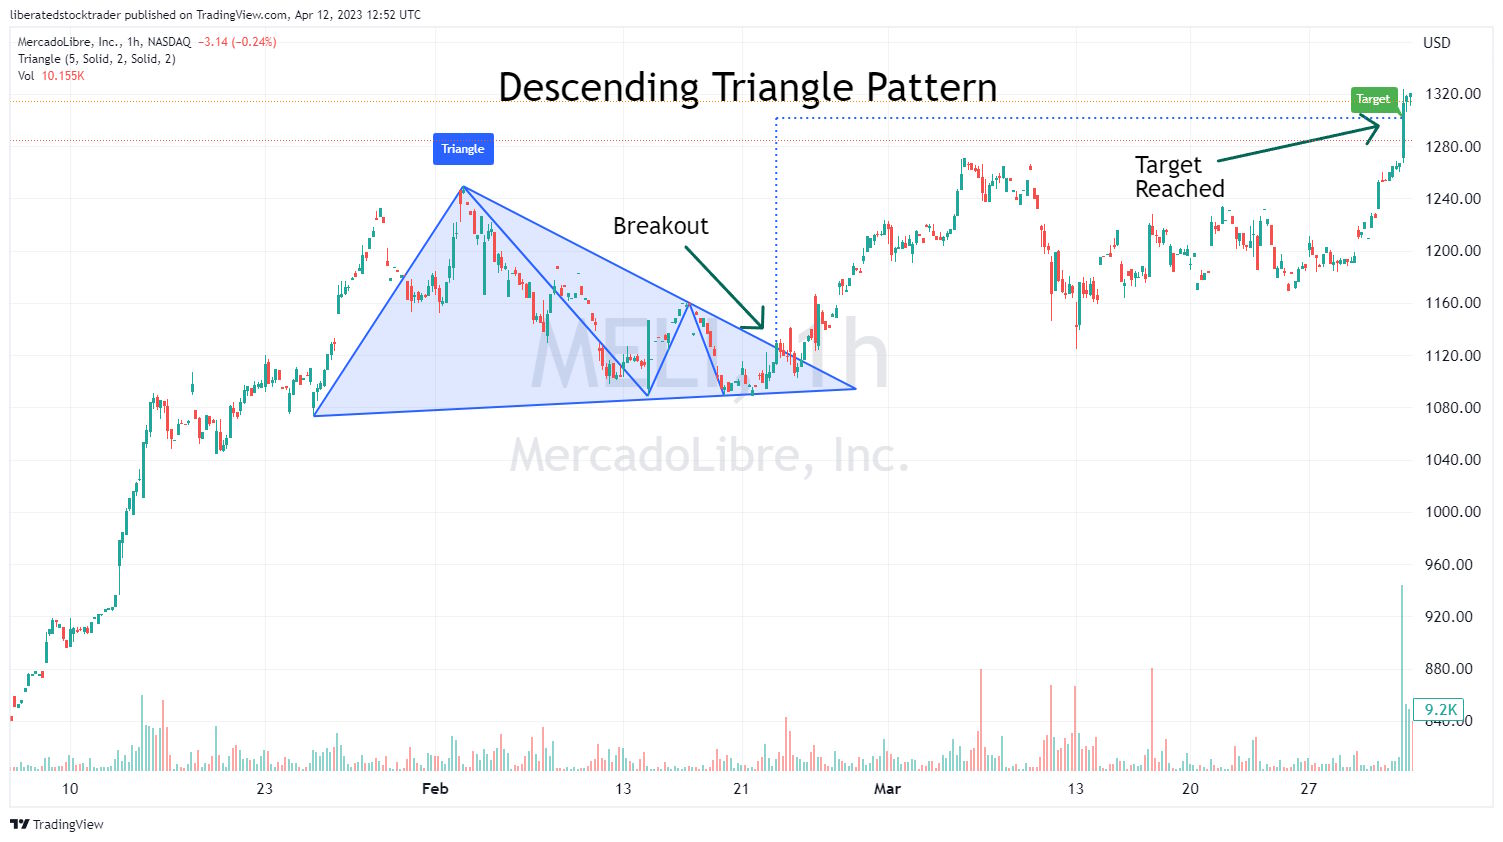
The descending triangle chart pattern is considered a reliable continuation or reversal point in the market, with an 87% success rate on an upward breakout in bull markets. This is because buyers begin to take control of the market when the price breaks above the triangle.
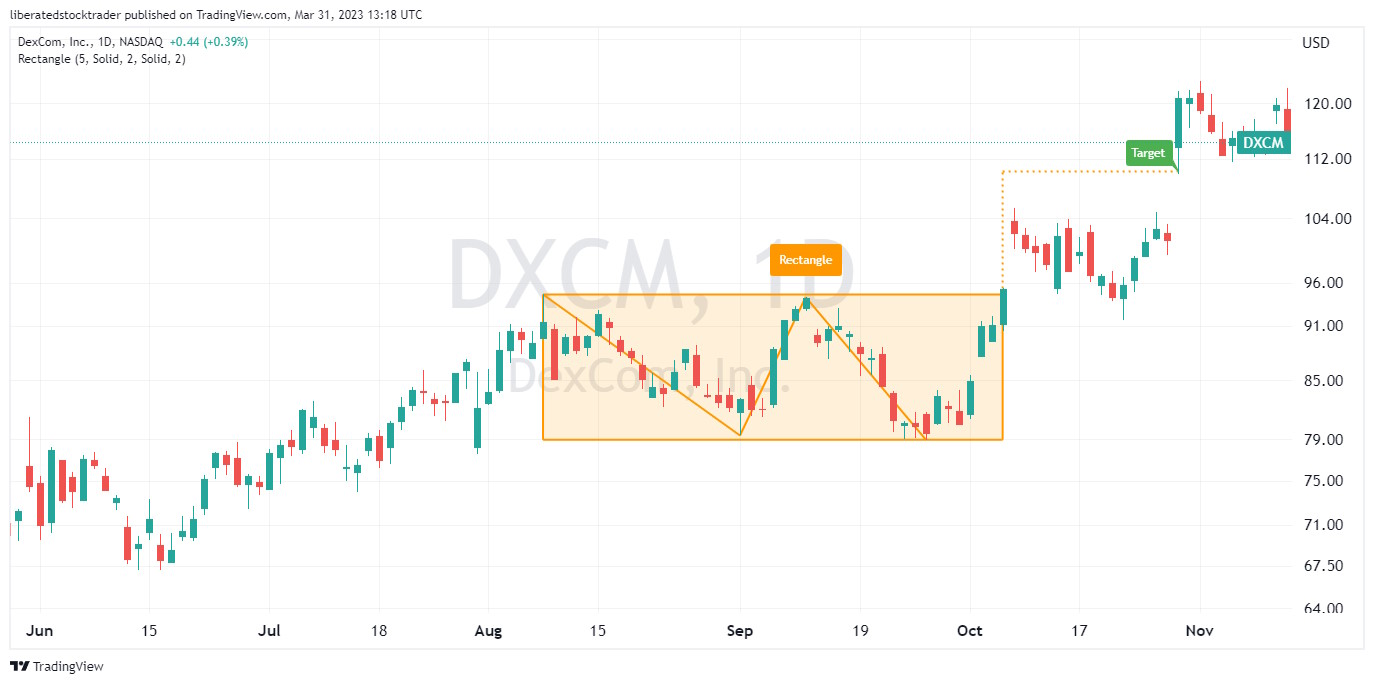
6. Rectangle Pattern: 85% Bullish
A rectangle is a well-established technical analysis pattern with a predictive accuracy of 85%. The pattern is flexible, can break out up or down, and is a continuation or reversal pattern. A rectangle can be bearish or bullish, depending on the direction of the price breakout.
Auto-detect this Chart Pattern with TradingView
This pattern is also known as “rectangle consolidation,” “box,” and “rectangular formation.”
The rectangle chart pattern usually develops after a strong price move, forming a period of consolidation or rest. It can also form after a range-bound market or during a period of low volatility.
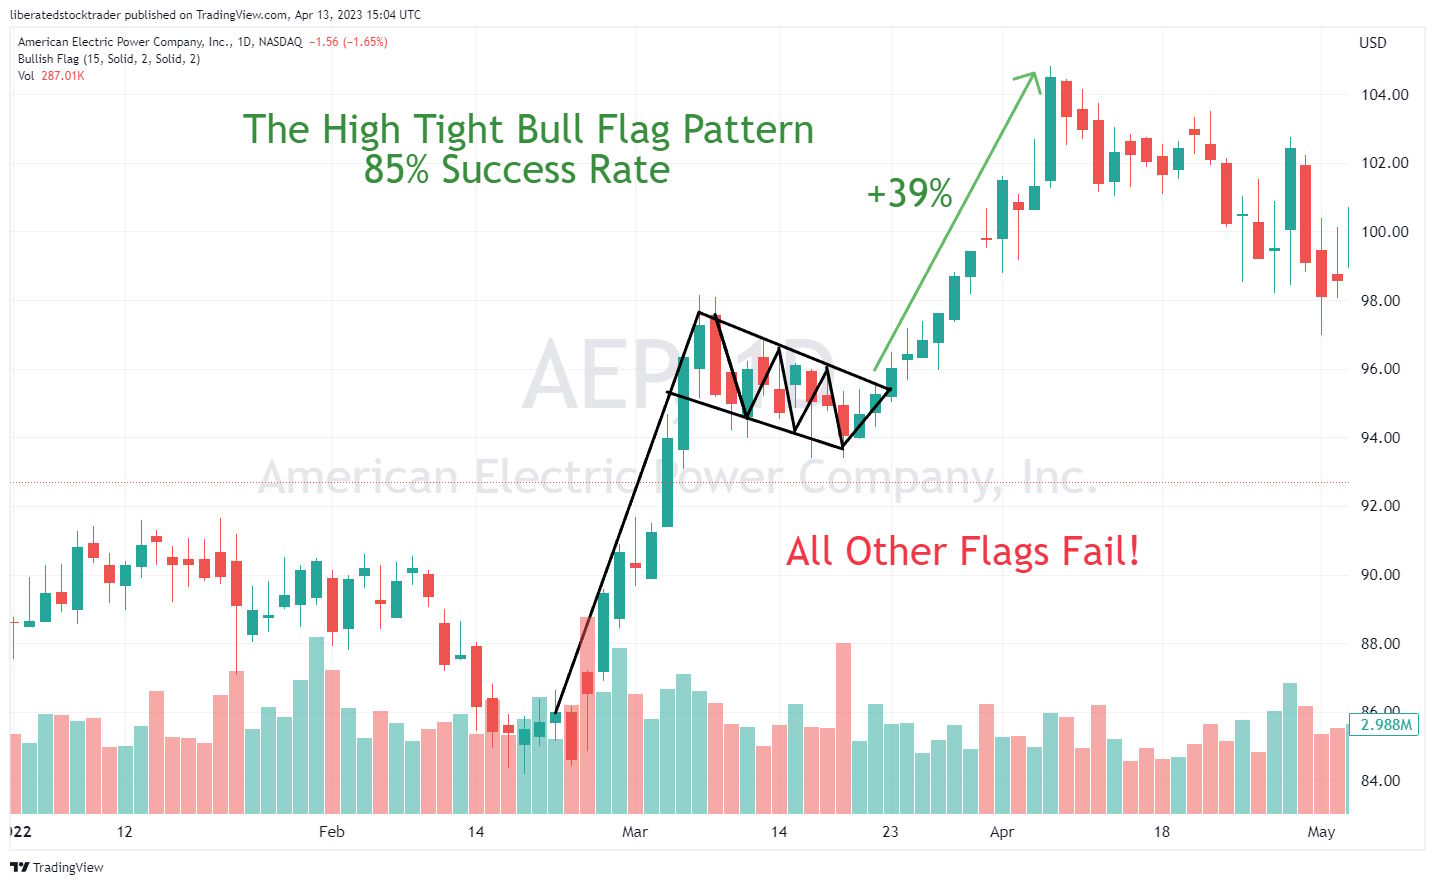
7. Bull Flag Pattern: 85% Bullish
A bullish flag is a popular yet widely misunderstood technical analysis pattern characterized by a rapid upward price trend followed by parallel downslope consolidation. The price increase resembles a flag pole, while the price consolidation is the flag.
Auto-detect this Chart Pattern with TradingView
The bull flag is a continuation pattern that forms during an explosive price increase, followed by a downward price consolidation. The price consolidation is caused by traders profiting from the strong trend, taking profits, and looking to short the stock.
Most flag patterns slope in the opposite direction from the previous trend, but some can be horizontal and resemble a rectangle pattern.
There are three flag patterns: the bull flag, the bear flag, and the high-tight bull flag. Research on 1,028 trades shows that standard loose flag patterns have a failure rate of 55%. In contrast, a high, tight bull flag pattern has a success rate of 85% with an average gain of +39%.* Source
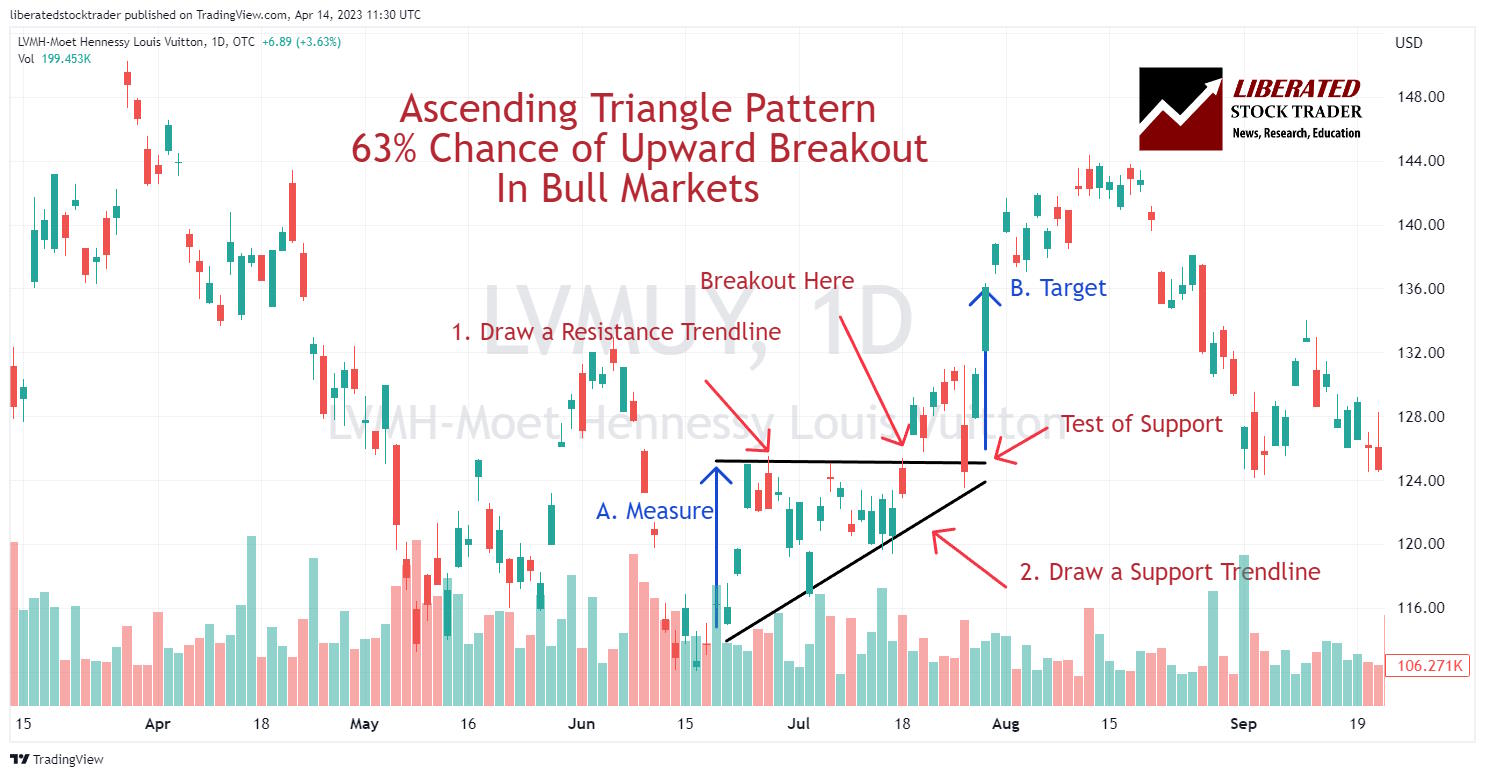
8. Ascending Triangle: 83% Bullish
The ascending triangle pattern is a reliable bullish continuation pattern popular with knowledgeable traders.
An ascending triangle is a powerful technical analysis pattern with a predictive accuracy of 83%. It is flexible, can break out up or down, and can be a continuation or reversal pattern.
An ascending triangle has one inclining trendline connecting a series of higher lows and a second horizontal trendline connecting a series of highs. Depending on the direction of the price breakout, an ascending triangle can be bearish or bullish, or a reversal or continuation pattern.
Auto-detect this Chart Pattern with TradingView
The ascending triangle chart pattern occurs when sellers are in control at the resistance price points. As buyers become more active, demand starts to outstrip supply, and the lows move higher. Eventually, a breakout occurs in either direction, signaling a reversal or continuation of the trend.
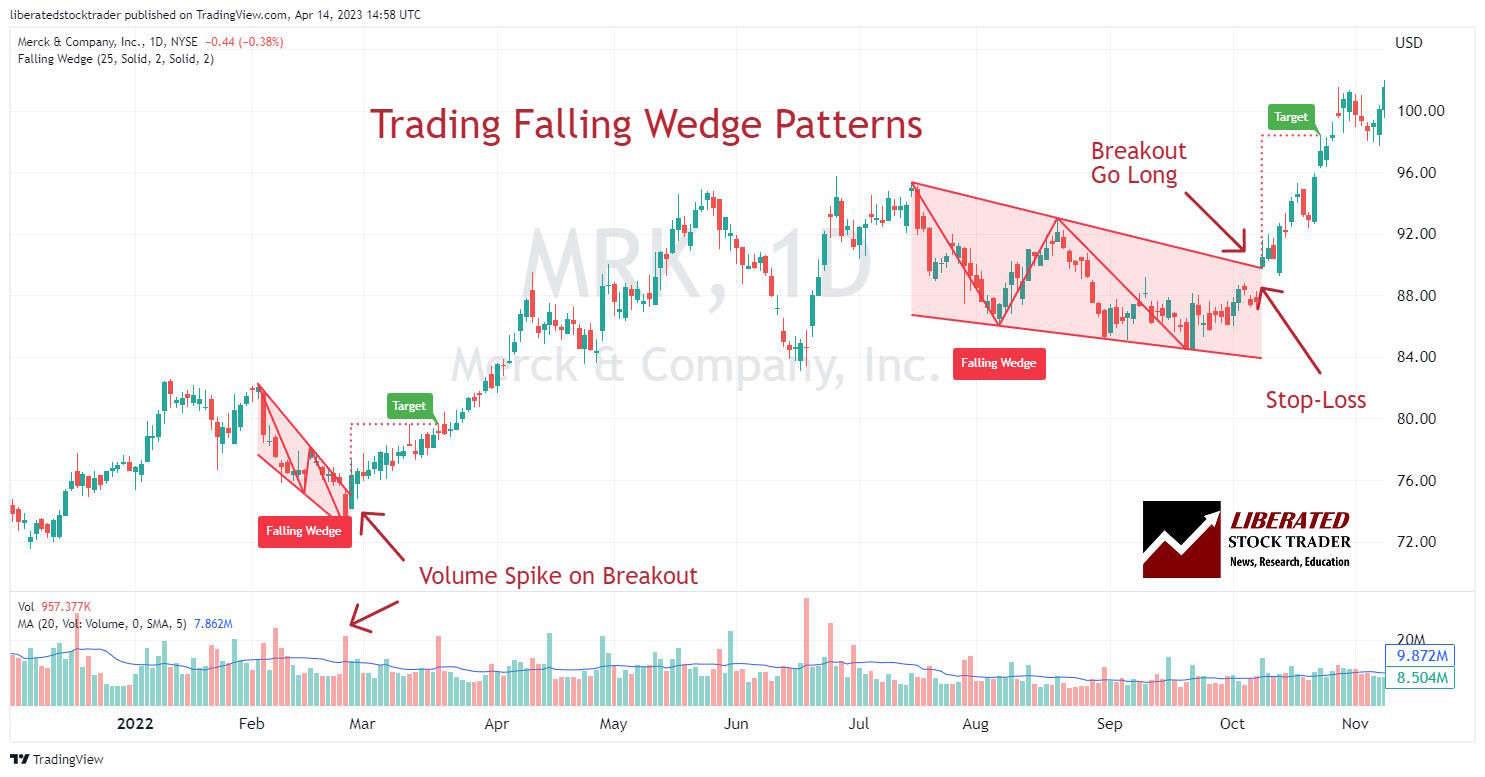
9. Falling Wedge Pattern – 74% Bullish
A Falling Wedge is considered a bullish wedge, signaling a potential rally after the price breaks out. It is a technical analysis pattern with a predictive accuracy of 74%. The pattern can break out up or down but is primarily considered bullish, rising 68% of the time.
Auto-detect this Chart Pattern with TradingView
The falling wedge is formed when an asset price rises, but instead of continuing its upward trajectory, it contracts as the trading range tightens. This contraction is reflected in the slope of two falling and converging trend lines plotted above and below the price action.
Traders should be cautious when they see the falling wedge form. As the price action continues to fall, the trading range tightens, indicating that selling pressure pushes the stock downward. Ultimately, there is a 68% chance of an upwards breakout as buyers take control.
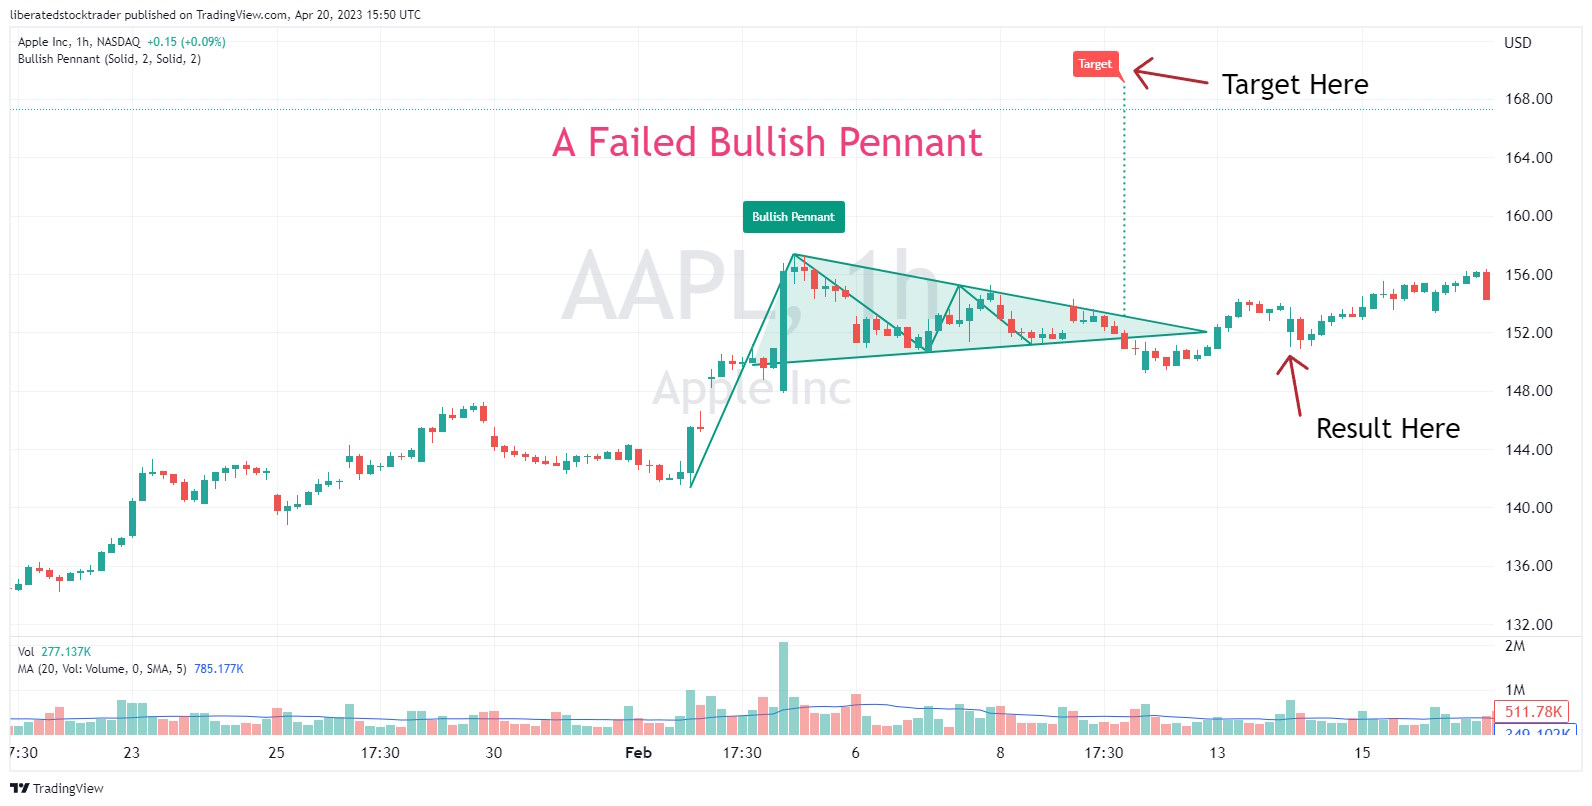
10. Pennant Pattern: 54% Bullish
A bullish pennant is a popular yet widely misunderstood technical analysis pattern characterized by a period of consolidation in the form of a symmetrical triangle. Generally, this pattern is regarded as a continuation pattern and appears after a sharp rally. It is composed of two converging trendlines connecting highs and lows, and followed by a breakout to the upside.
A bullish pennant is a popular yet widely misunderstood technical analysis pattern characterized by a period of consolidation in the form of a symmetrical triangle. Generally, this pattern is regarded as a continuation pattern and appears after a sharp rally. It is composed of two converging trendlines connecting highs and lows, and followed by a breakout to the upside.
A bullish pennant is not reliable or accurate. It has a 54% success rate on an upside breakout and achieves an average 7% profit in bull markets. This pattern’s failure rate is 46%, which must be avoided.
FAQ
Is a head and shoulders pattern bullish?
No, according to research, a head and shoulders pattern is a bearish pattern 81 percent of the time. The inverse head and shoulders pattern occurring at the bottom of a bear market is considered extremely bullish, with an 89 percent upside probability.
What are bullish patterns?
Bullish patterns are chart formations indicating that the trend will likely continue upward. Bullish patterns include cup and handle, ascending triangle, double bottom, and triple bottom. These patterns are generally a sign that buyers are entering the market and prices will likely increase.
What is a bullish stock pattern?
Bullish stock patterns are technical analysis patterns that indicate a probable increase in the price of a stock. Investors and traders can use these patterns to identify potential trading opportunities. They include the cup and handle, ascending triangle, double bottom, and inverse head and shoulders.
What is the most bullish chart pattern?
The most bullish chart pattern is the cup and handle, which has an exceptional bullish success rate of 95 percent. With a potential average profit of 54 percent, the cup and handle is the best bull pattern.
Is a bullish pattern good?
Yes, a bullish pattern typically indicates that the stock price is more likely to increase than decrease. This makes them an attractive opportunity for traders and investors looking to capitalize on rising prices. They also offer a favorable risk/reward ratio as they usually have limited downside potential while offering significant upside potential.
How to find bullish patterns?
You can automatically find bullish chart patterns with TradingView's pattern recognition algorithms. If you want to scan entire markets for bearish patterns, I would recommend Finviz.
Do bullish chart patterns really work?
Yes, bullish patterns really work. According to decades of research, chart patterns work between 45 and 95 percent, depending on the pattern and the market. For example, a double bottom pattern in a bull market is predictive, with an accuracy of 88 percent and an average price change of +50 percent.
How do I use bullish patterns?
Bullish chart patterns are used to identify potential trading opportunities. When a bullish pattern is formed, you should watch closely for the pattern to break out upwards. If the asset price breaks up through the resistance, it is a buy; if it breaks down through support, it is a sell.
How important are bullish patterns?
Bullish patterns are incredibly important for traders in stocks and ETFs because the natural direction of the market is up. This means bullish patterns hold the most potential profits of all patterns because they go with the trend. For example, an ascending triangle has an 83 percent chance of success.
What is the most profitable bullish pattern?
According to decades of academic testing, the most profitable bullish pattern in trading is the rectangle top, with an 85 percent chance of success and an average of 51 percent profit in a bull market. This pattern has been tested and documented in the Encyclopedia of Chart Patterns by Tom Bulkowski.
What is the psychology behind bullish patterns?
Bullish patterns reflect the psychology of market participants and how they perceive a security's value. Chartists use these patterns to determine when buyers are in control, which can be used to identify potential breakouts. Traders look for trends in price and volume that signify positive market sentiment.
How do you trade bullish patterns?
Trading bullish patterns is all about timing when the market turns. A trader should look for the signs of a pattern forming, such as volume spikes or narrowing price movements. Once a bullish pattern is identified, traders can execute trades based on their interpretation of the data.
How many bullish patterns are there?
According to the Encyclopedia of Chart Patterns by Tom Bulkowski, 38 distinct bullish patterns have been identified, documented, and tested. You can try to learn each chart pattern or use pattern recognition software to perform the work for you.
Which timeframe is best for bullish patterns?
The best timeframes for bullish patterns are daily and weekly. Research suggests that the longer the timeframe, the more reliable and accurate the chart pattern. Chart patterns on shorter timeframes from 1 to 10 minutes can be less accurate due to the outsize impact of block trades.
Why do bullish patterns fail in trading?
Bullish patterns fail in trading because market sentiment can change quickly. The impact of breaking financial news can disrupt the market and cause a bullish pattern to fail. Even a high probability pattern can fail if there is market-moving news, such as Federal Reserve interest hikes or an industry-impacting announcement.
What is the easiest bullish pattern to trade?
The rectangle or Darvas Box is the easiest bullish pattern to trade. It occurs when a stock consolidates within a defined price range, forming highs and lows. A breakout from this range can signal the start of an uptrend or downtrend. Experienced traders watch for volume expansion to validate and rely on these breakouts.
Which bullish patterns are most reliable?
The most reliable stock chart patterns do not occur often. The head and shoulders bottom has a reliability of 89 percent in a bull market, but it does not occur often. However, the double bottom chart pattern has a reliability of 88 percent and occurs regularly.
Learn the Success Rates of 65 Chart Patterns
The Encyclopedia of Chart Patterns by Tom Bulkowski details the reliability and success rates of 65 chart patterns and shows you how to trade them. It is an indispensable resource for traders and investors seeking to enhance their profitability by leveraging stock chart patterns. This comprehensive reference book provides in-depth explanations and detailed illustrations of over 65 different patterns, including Head and Shoulders, Double Tops, Wedges, Flags, Gaps, and more.
