
TradingView beats thinkorswim in my head-to-head lab testing, scoring a higher Composite Lab Performance Score of 4.75. TradingView wins because it is the stronger all-round platform: better chart depth, stronger scanning, broader broker connectivity, better community, stronger alerting, better backtesting, and superior multi-market coverage. It is the better choice for traders who want one platform for charting, screening, strategy testing, community research, and global market access.
Verdict
TradingView is the stronger overall platform in my lab testing. It wins the majority of categories, including CLPS, Value, Speed & Ease, Chart Analysis, Pattern Recognition, Scanning, Backtesting, AI & Algo, Alerts, Broker Connectivity, Portfolio Tools, and Community. Its 4.75 overall score makes it the better choice for most traders who want a modern, multi-asset, community-powered charting and strategy platform.
thinkorswim remains an excellent choice for a different user: the active Schwab trader. It is especially strong in live trading, options workflows, thinkScript customization, alerts, support, and broker-connected execution.
TradingView Lab Ratings
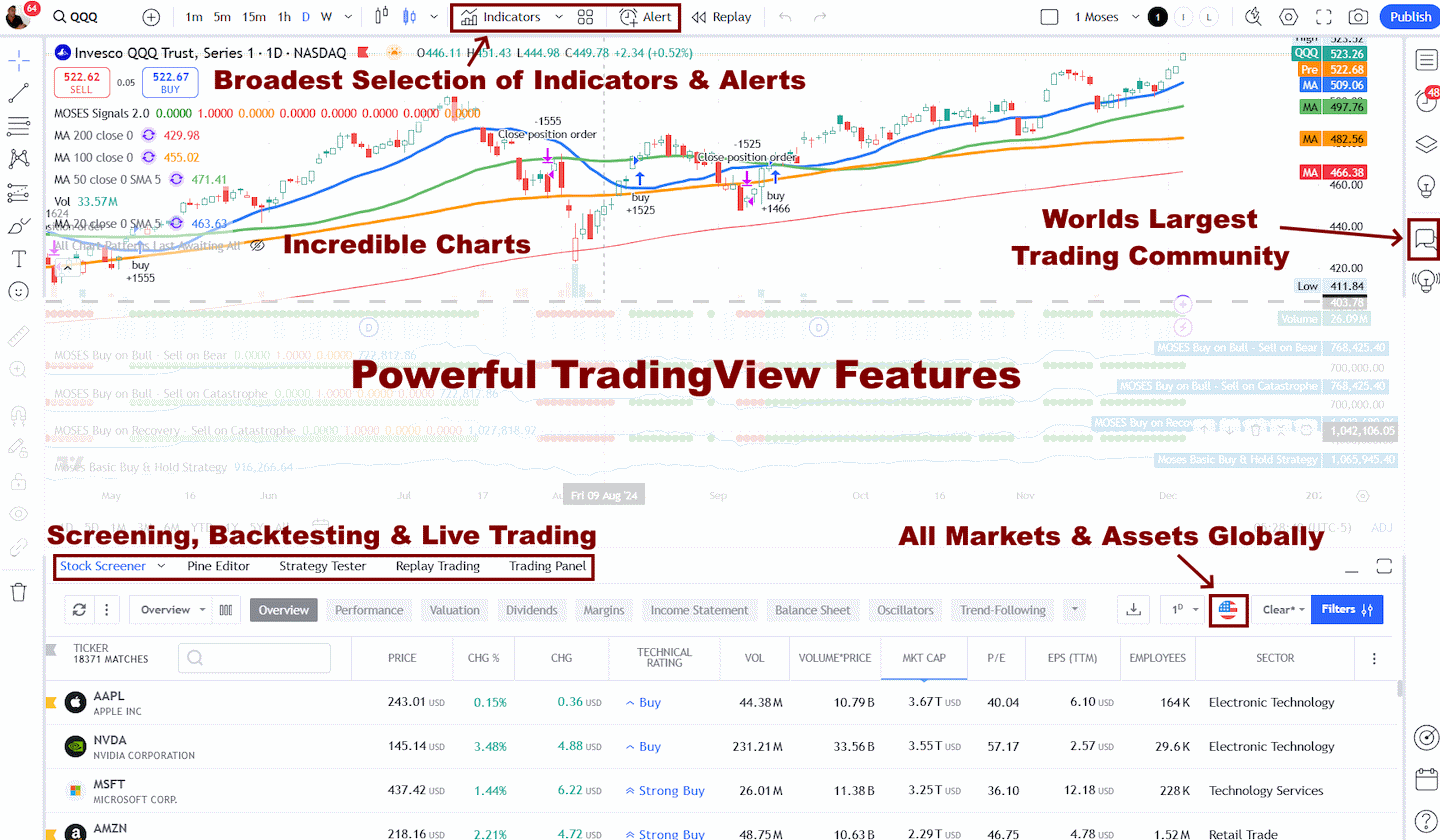
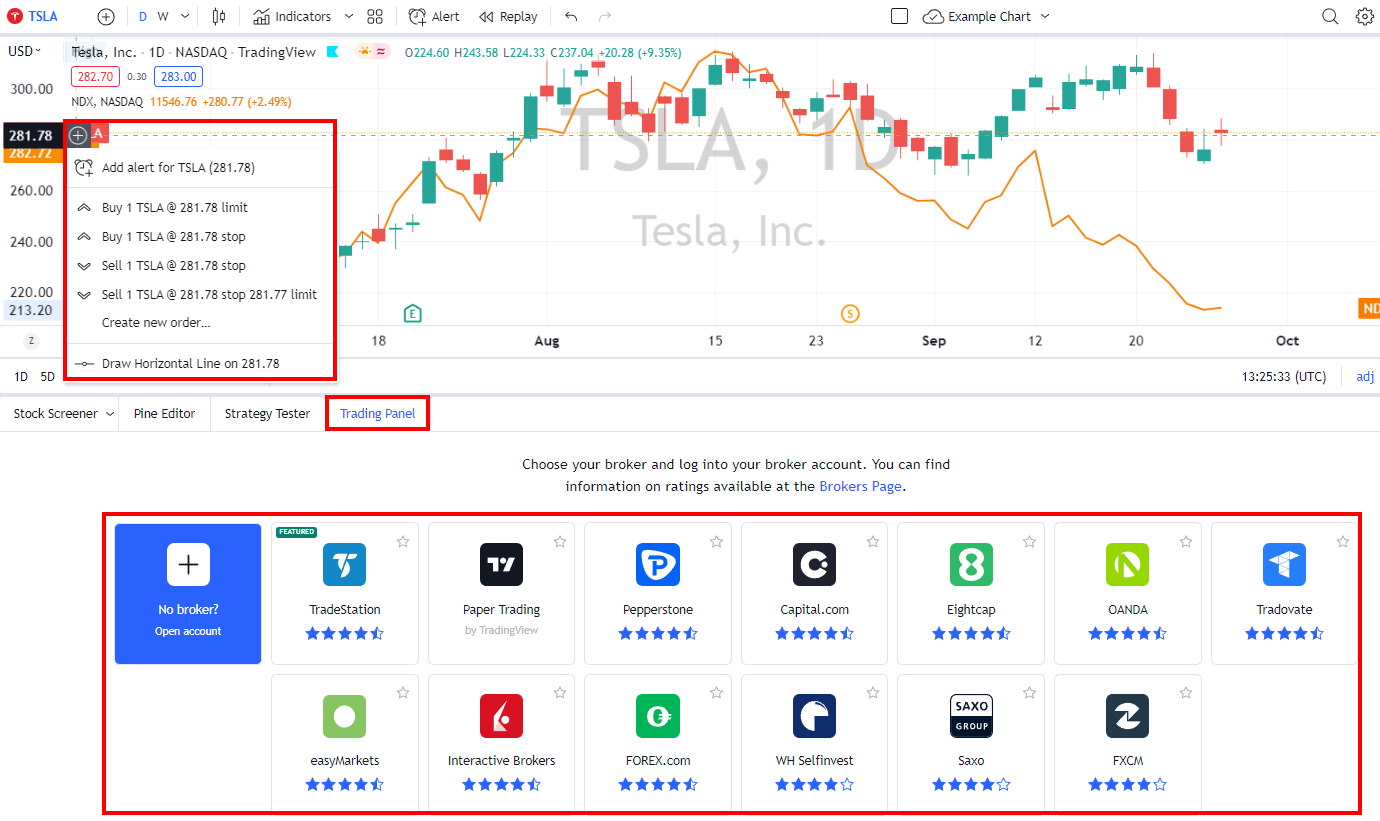
TradingView is the world’s premier trading platform, trusted by over 20 million active traders. It offers a seamless blend of powerful charting tools, advanced screening features, and in-depth analysis, covering a wide range of assets, including stocks, indices, ETFs, and cryptocurrencies.
| Test | Tier | Score | Average |
|---|---|---|---|
| Composite Lab Performance Score | AAA | 4.75 | 4.21 |
| Pricing Index: $ per Day | AA | $1.97 | $2.74 |
| Value Score (VP) | AA | 4.37 | 2.82 |
| Speed & Ease of Use | AAA | 5.00 | 4.50 |
| Chart Analysis Depth Index | AAA | 5.00 | 3.17 |
| Chart Pattern Depth & Accuracy | B | 3.98 | 2.73 |
| Scanning Performance | AAA | 4.83 | 3.38 |
| Backtesting Performance | A | 4.19 | 3.38 |
| Trading Bot & Auto-Trading Reliability | B | 3.50 | 2.50 |
| AI & Algo Index | A | 4.00 | 2.00 |
| Alert Speed | AA | 4.67 | 3.67 |
| Trade Signal Quality | C | 2.50 | 0.00 |
| Broker Connectivity & Ecosystem Depth | AAA | 5.00 | 1.55 |
| Portfolio Tool Performance | B | 3.60 | 2.80 |
| Financial News Speed & Depth | B | 3.00 | 2.30 |
| Community Utility Index (CUI) | AAA | 5.00 | 3.25 |
| Support Infrastructure & SLA Audit | B | 3.25 | 3.75 |
Tested using benchmarking system v3.
See the 2026 v3 58-point TradingView test and benchmarks.
Pros
✔ 20 million users sharing ideas
✔ AAA Speed & ease of use
✔ Trading from charts
✔ Powerful screening and technical analysis
✔ All stock exchanges globally
✔ AAA Broker connectivity and asset coverage
✔ 100,000+ user-generated strategies
✔ Free and low-cost plans
✔ Flexible backtesting with Pine Script
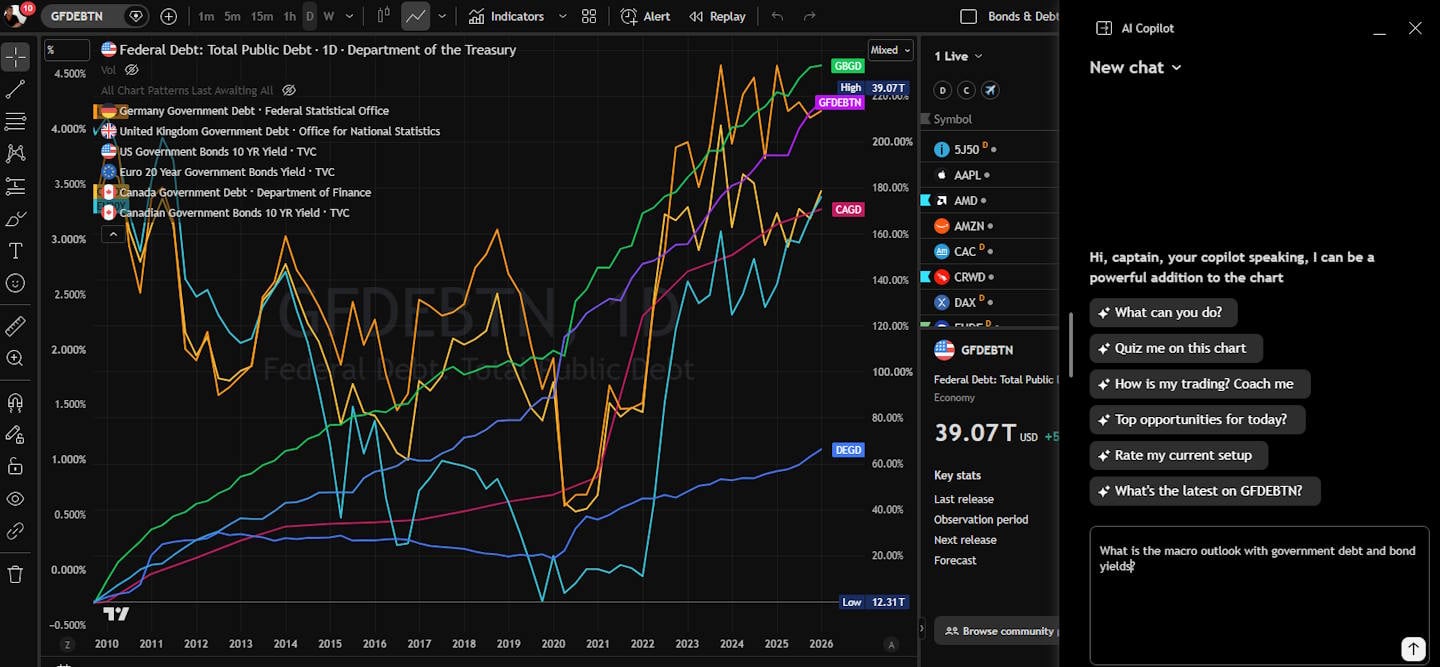
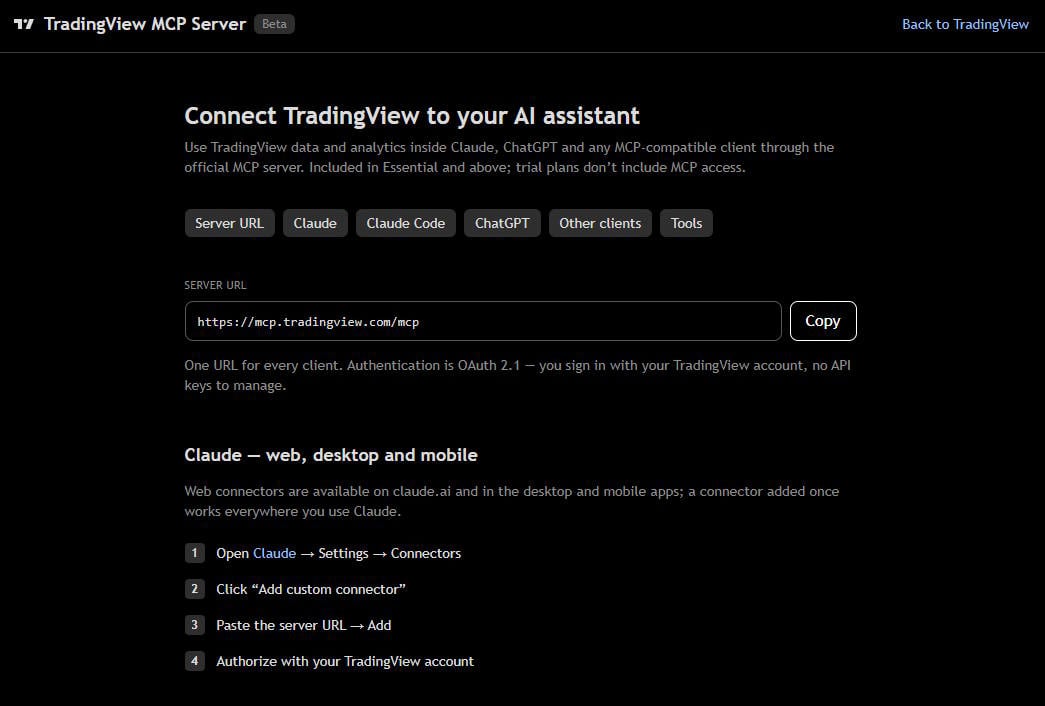
✔ New ChatBot & AI MCP Servers
Cons
✘ Not ideal for value or dividend investors
✘ Coding skills required for backtesting and custom indicators
✘ Average portfolio tools

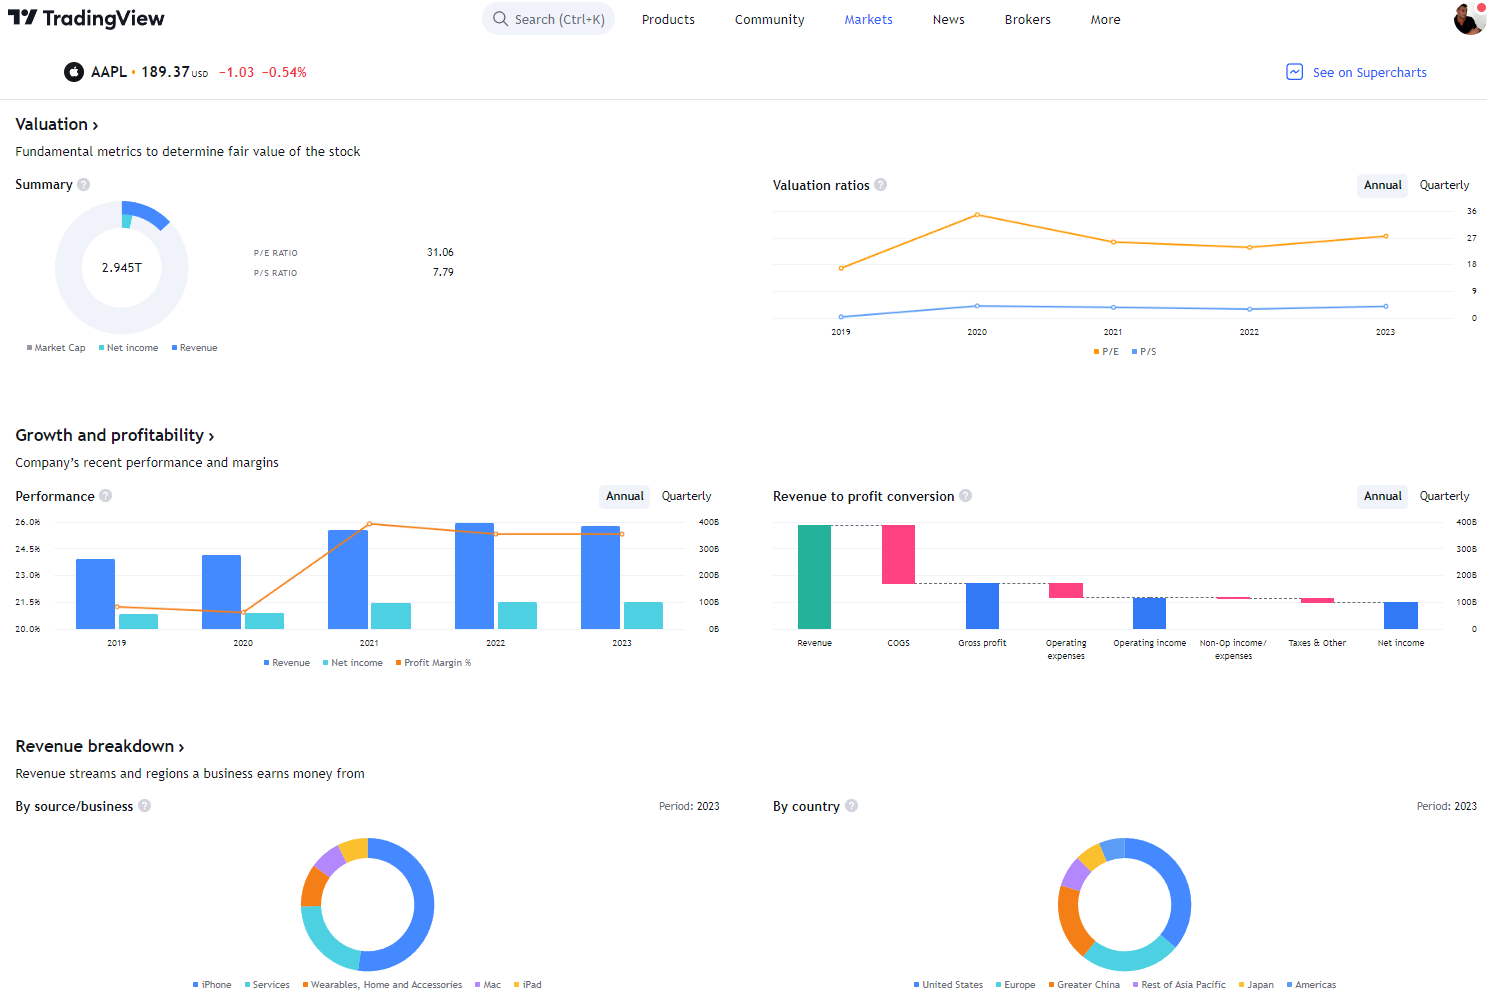
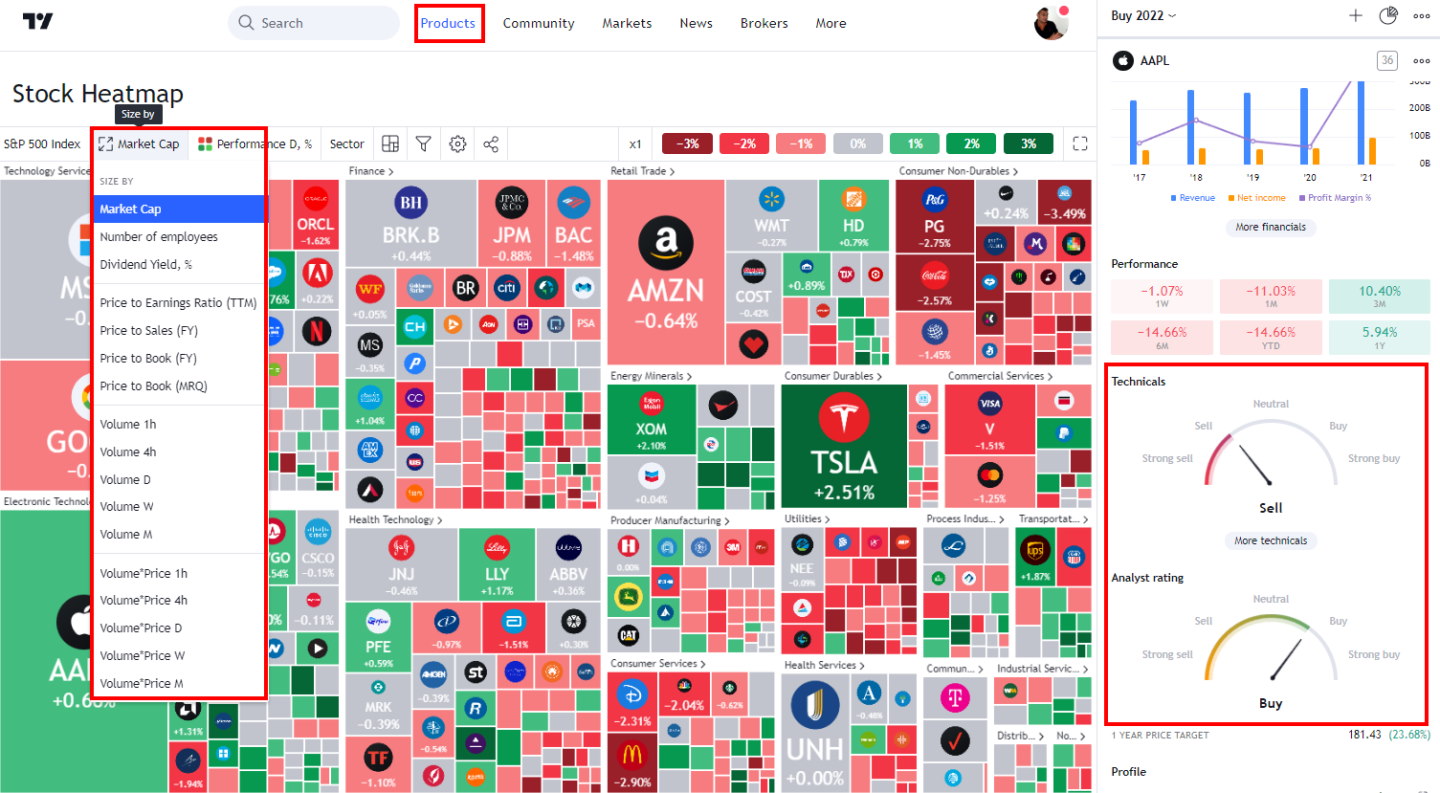
TradingView provides best-in-class technical analysis tools to analyze financial markets. It offers heatmaps, super charts, indicators, strategy development tools, and backtesting capabilities.
Its vibrant community of traders shares ideas, strategies, and custom indicators, making it an invaluable resource for learning and collaboration.

thinkorswim Lab Ratings
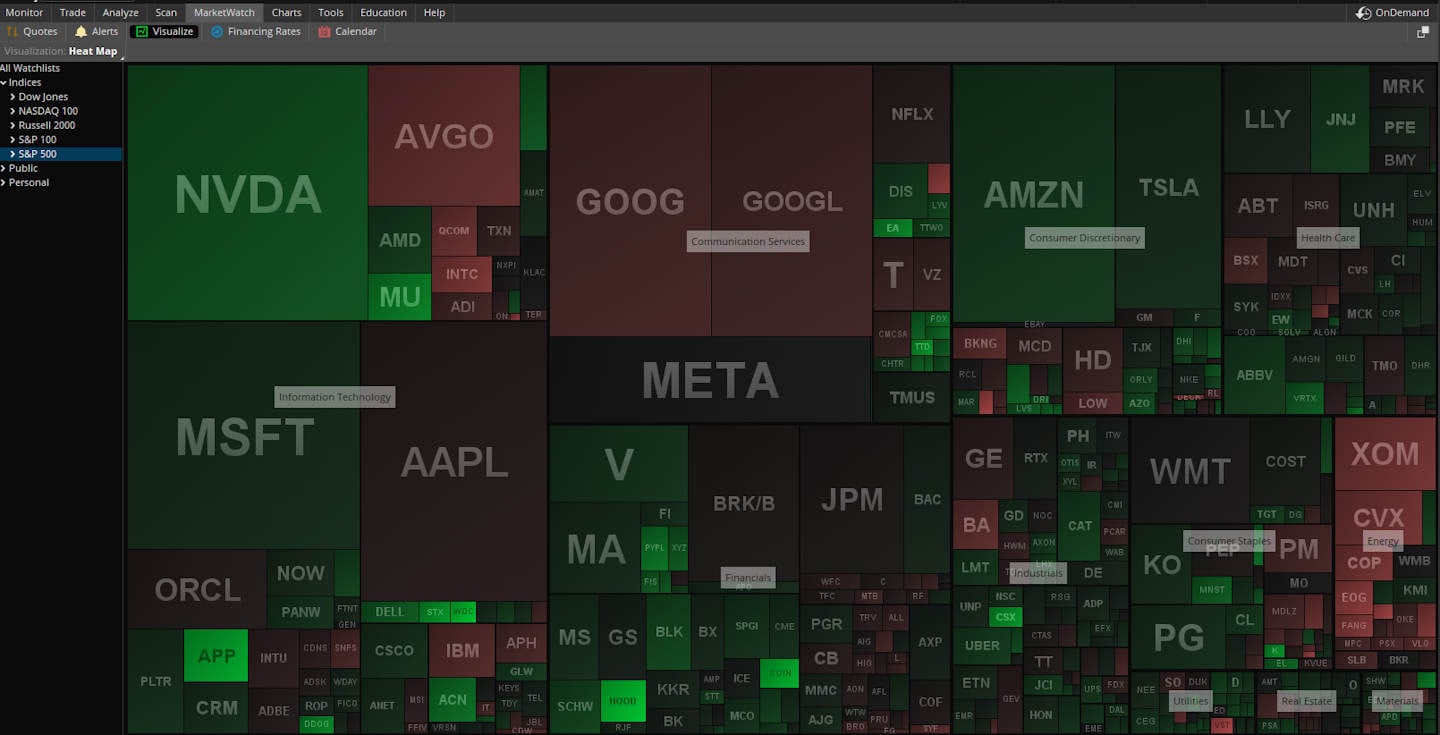
ToS is good for active U.S. traders who want advanced charts, options workflows, custom indicators, scanning, alerts, and live trading inside a broker-owned ecosystem. This is not a modern social charting network or AI trading assistant. thinkorswim is a trading workstation.
| Test | Tier | Score | Average |
|---|---|---|---|
| Composite Lab Performance Score (CLPS) | A | 4.17 | 4.21 |
| Pricing Index | AAA | $0 | $2.74 |
| Value Score (VP) | C | 2.86 | 2.82 |
| Speed & Ease of Use | B | 3.67 | 4.50 |
| Chart Analysis Depth Index | AA | 4.33 | 3.17 |
| Chart Pattern Depth & Accuracy | B | 3.63 | 2.73 |
| Scanning Performance | B | 3.50 | 3.38 |
| Backtesting Performance | B | 3.50 | 3.38 |
| Trading Bot & Auto-Trading Reliability | B | 3.00 | 2.50 |
| AI & Algo Index | C | 1.50 | 2.00 |
| Alert Speed | A | 4.00 | 3.67 |
| Trade Signal Quality | C | 0.00 | 0.00 |
| Broker Connectivity & Ecosystem Depth | C | 2.70 | 2.00 |
| Portfolio Tool Performance | C | 2.60 | 2.80 |
| Financial News Speed & Depth | B | 3.00 | 2.80 |
| Community Utility Index (CUI) | B | 3.50 | 3.25 |
| Support Infrastructure & SLA Audit | A | 4.00 | 3.75 |
Tested using benchmarking system v3.
See the 2026 v3 58-point thinkorswim test and benchmarks.
Pros
✔ Free for Schwab Clients
✔ Good technical customization.
✔ Trading from charts
✔ Solid Options Workflow
✔ Good Support
✔ AAA Brokerage
✔ 100,000+ user-generated strategies
✔ Free and low-cost plans
✔ Flexible backtesting with Pine Script
Cons
✘ Lacking AI features
✘ Coding skills required for backtesting and custom indicators
✘ Average portfolio tools
thinkorswim is a powerful broker-connected trading workstation, especially for U.S. stock, ETF, futures, forex, and options traders using Schwab. In my lab testing, it scores 4.17, slightly below the overall median, but its strengths are clear: advanced charts, deep indicators, thinkScript customization, Stock Hacker scanning, fast alerts, live trading, and strong support.

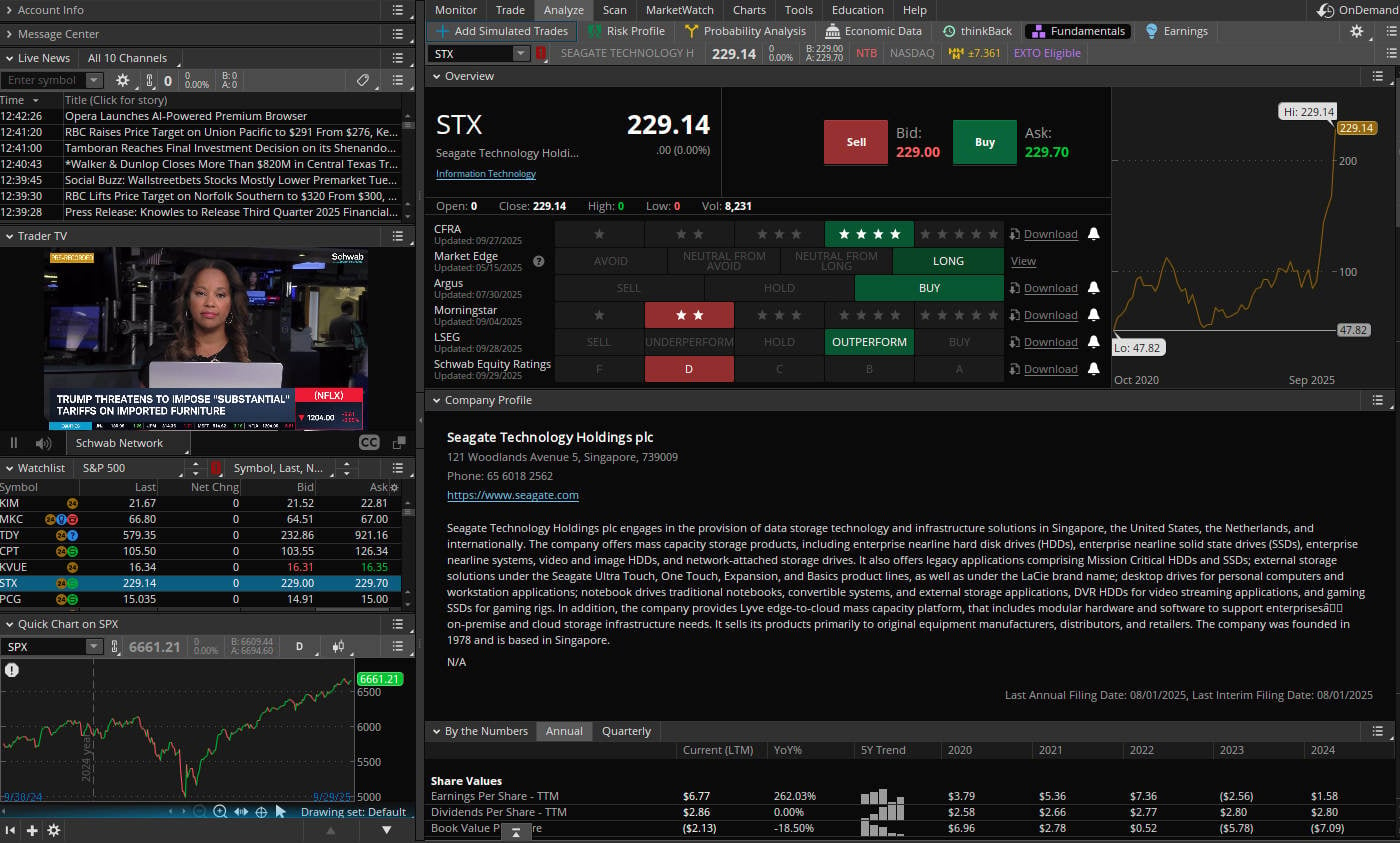

If you trade primarily through Schwab and care about options, paperMoney, Stock Hacker, and desktop workstation depth, thinkorswim is highly capable. But if you want the best all-round technical-analysis and market-research platform, TradingView wins.
Composite Lab Performance Score (CLPS)
TradingView wins the overall lab test with a Composite Lab Performance Score of 4.75, compared with thinkorswim’s 4.17. That gap reflects platform breadth: TradingView is stronger across charting, scanning, backtesting, alerts, broker connectivity, community, and portfolio monitoring. It is built as a global technical-analysis and trading ecosystem, not just a broker terminal. Its score is also the benchmark high in this test set, making it the stronger all-round choice for most traders.
| Features | TradingView |
| ⚡ Features | Charts, News, Watchlists, Screening |
| 🏆 Unique Features | Trading, Backtesting, Community |
| 🎯 Best for | Stock, FX & Crypto Traders |
| ♲ Subscription | Monthly, Yearly |
| 💰 Price | $0 | $15 | $35 | $70 |
| 🆓 Free Plan | ✔ |
| 💻 OS | Web & Desktop |
| 🎮 Trial | Free 30-Day Premium |
| 🌎 Region | Global Stocks, Crypto, FX, Futures |
| ✂ Discount | -17% on yearly plan + $15 Discount |
TradingView is a global, broker-agnostic research and strategy platform: elite charts, vast screeners, code-and-click strategy testing, and an active social layer that accelerates learning.
thinkorswim’s 4.17 is still respectable. It performs well in charting, pattern recognition, scanning, backtesting, alerting, live trading, community, and support. But it is more specialized: the platform is strongest for Schwab clients, U.S. options traders, and users who want advanced order entry, thinkScript, Stock Hacker, and broker-integrated workflows. TradingView is the better independent analysis platform; thinkorswim is the better Schwab-native trading workstation.
| Features | ThinkOrSwim |
| ⚡ Features | Screening, Heatmaps, Charts |
| 🏆 Unique Features | Options Trading, Trader TV |
| 🎯 Best for | Schwab Clients |
| ♲ Subscription | Monthly, Yearly |
| 💰 Price | Free for Schwab Clients |
| 🆓 Free Plan | ✔ |
| 💻 OS | Web & Desktop |
| 🎮 Trial | ✘ |
| 🌎 Region | US Stocks / FX |
| ✂ Discount | ✘ |
ThinkOrSwim is an execution and options powerhouse: multi-leg strategies, probability analysis, risk profiles, conditional orders, and desktop-first control within the Schwab ecosystem.
Value Score (VP)
TradingView wins Value Score decisively, scoring 4.37. TradingView’s value comes from breadth and accessibility: global charts, multi-asset coverage, Pine Script, community scripts, strategy testing, screeners, broker connections, alerts, web/mobile access, and one of the largest public trader communities. TradingView also publishes a large public script library for indicators, strategies, and libraries built with Pine Script.
thinkorswim’s 2.86 is slightly above the median benchmark of 2.82, so it is not weak. Its value is strongest for Schwab users who need an execution platform with advanced options tools, customizable charts, Stock Hacker scans, paperMoney, alerts, and thinkScript. But its limited device support, broker lock-in, and narrower ecosystem prevent it from matching TradingView’s all-round value. For most traders, TradingView delivers more utility per platform; ToS delivers better Schwab-specific trading value.
Speed & Ease of Use
TradingView wins Speed & Ease of Use with a perfect 5.00. In my testing, TradingView loaded charts in 1.55 seconds, scored 5.00 for time-to-chart, delivered 20 ms multi-chart latency, scored 5.00 for multimonitor chart speed, and completed key workflows in 2 clicks. The platform feels fast because the interface is clean, web-native, and optimized for chart-first navigation.
thinkorswim 3.67 is more powerful than simple, which explains its lower score. It still has strong sub-scores, including 4.00 for Time to Chart Performance and 4.00 for Multimonitor Chart Speed, but its overall interface is denser. Order tickets, option chains, studies, chart grids, scans, and account tools give ToS its workstation feel, but also increase the learning curve.
TradingView is easier and faster for most users; thinkorswim rewards traders willing to master a more complex desktop environment.
Chart Analysis Depth Index
TradingView wins Chart Analysis Depth with a perfect 5.00. TradingView offers 21 chart types, 400 indicators, 5.00 Chart Depth, 5.00 Indicator Depth, and 5.00 Custom Indicator Coding through Pine Script. It is the stronger pure charting platform because it combines native chart breadth, huge indicator depth, custom coding, and a massive ecosystem of community-published scripts.
Deeper Dive: What great charts actually mean
- Speed to insight: Lightning-fast zoom, pan, multi-layout, and object snapping keep you in flow.
- Precision: Magnet modes, anchored VWAPs, multi-timeframe drawings, and quick style presets reduce setup time.
- Repeatability: Save chart layouts and reuse across tickers without re-drawing.
- Collaboration: Publish annotated charts or share private links to get feedback from other traders.
Self-test: Load five core tickers, add your drawings (trendlines, zones, fibs), jump timeframes (1m → D → W), and see which platform lets you work faster.
thinkorswim is still one of the strongest broker-based charting platforms. Its 4.33 score is driven by 5.00 Indicator Depth and 5.00 Custom Indicator Coding. The key feature is thinkScript, which Schwab describes as a built-in programming language for creating studies, watchlist columns, alerts, scan queries, and conditional orders.
TradingView is better for broad technical analysis and public script discovery; thinkorswim is better for broker-integrated custom trading workflows.
Chart Pattern Depth & Accuracy
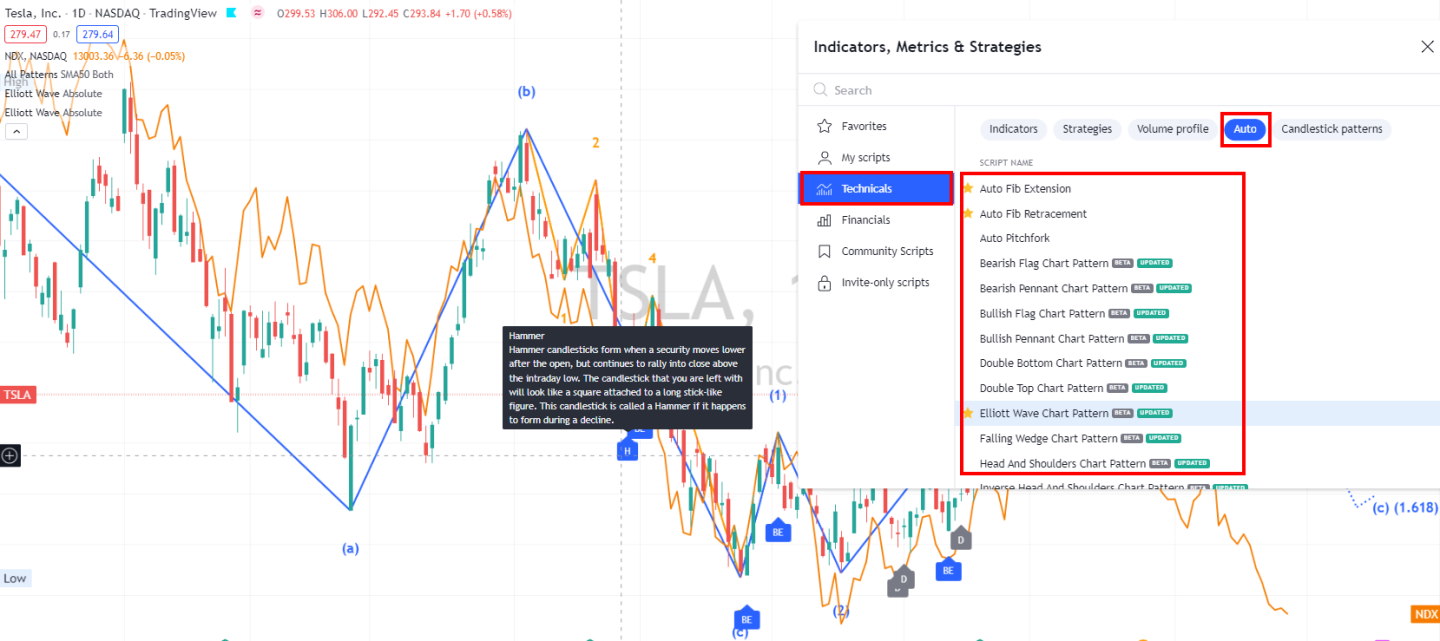
TradingView wins Chart Pattern Depth & Accuracy, scoring 3.98. TradingView recognized 97 total patterns, including 44 candlestick patterns and 53 chart price/trend patterns, with 95% tested accuracy and 4.75 Pattern Recognition Accuracy. Its advantage is breadth: it supports more automated pattern discovery and integrates those patterns into a flexible charting, scripting, alerting, and community workflow.
thinkorswim’s 3.63 is still strong, mainly because its Pattern Recognition Accuracy score is excellent at approximately 4.80. The weakness is Pattern Recognition Depth, which is only 2.50. In plain English, ToS can be reliable where it detects patterns, but it does not match TradingView’s broader pattern-recognition coverage. Pattern traders who want wide automated discovery should use TradingView; ToS users will often combine built-in tools with custom studies and manual confirmation.
Scanning Performance
TradingView wins Scanning Performance, scoring 4.83. TradingView’s scanner is exceptionally fast in my testing, with a 7 ms S&P 500 scan benchmark, 360 scanning criteria, 4.50 Scanning Criteria & Depth, and 5.00 Custom Code Scanning. TradingView also offers Pine Screener, which allows users to scan watchlists with Pine scripts.
thinkorswim remains a capable scanner, especially for Schwab traders. It scores 3.50, slightly above the median 3.38, and earns 5.00 Custom Code Scanning. Schwab’s Stock Hacker tool is designed to help investors find stocks and options based on user-defined criteria.
The distinction is clear: TradingView is faster and broader as a market-wide scanner; thinkorswim is more broker-workflow focused and particularly useful for U.S. stock and options scans.
Indicators & Scripting
The call: Both languages are capable. Pine Script is simpler to learn and integrates directly with TradingView’s strategy objects (not just indicators), so you can code signals and test them immediately. thinkScript is powerful, but common retail workflows require more effort to reach the same “idea-to-test” loop.
Deeper Dive: From idea to coded signal
- TradingView: Start with a public script, tweak parameters, convert to a strategy, and see entry/exit marks plus equity curve in minutes.
- ToS: Build thinkScript studies and strategy objects that simulate orders on charts; great for tinkerers, but less streamlined for full performance summaries out of the box.
Tip: New to scripting? Pine’s gentle curve and giant public library lower the barrier to custom signals.
Backtesting Performance
TradingView wins Backtesting Performance, scoring 4.19. TradingView’s strength is fast, scriptable strategy testing: 7 ms tested backtest speed, 5.00 Backtesting Speed Points, 5.00 Flexible Coding Backtesting, 85% report-quality coverage, and 4.25 Backtesting Report Quality. TradingView is best for traders comfortable with Pine Script or community strategies.
thinkorswim also performs well, scoring 3.50. Its strongest sub-scores are 5.00 Backtesting Speed and 5.00 Flexible Coding Backtesting, but its Backtesting Report Quality is weak at 0.50. ToS is useful for testing ideas and practicing execution, especially with paperMoney, Schwab’s simulated trading environment inside thinkorswim. TradingView is OK for strategy research.
Deeper Dive: What a useful backtest includes
- Iteration speed: Test variants (e.g., RSI(2) vs. RSI(3), different stops) quickly to gauge robustness.
- Execution realism: Incorporate slippage/commissions in scripts to avoid fantasy results.
- Transferability: Turn a profitable script into alerts or broker-connected orders when you’re ready.
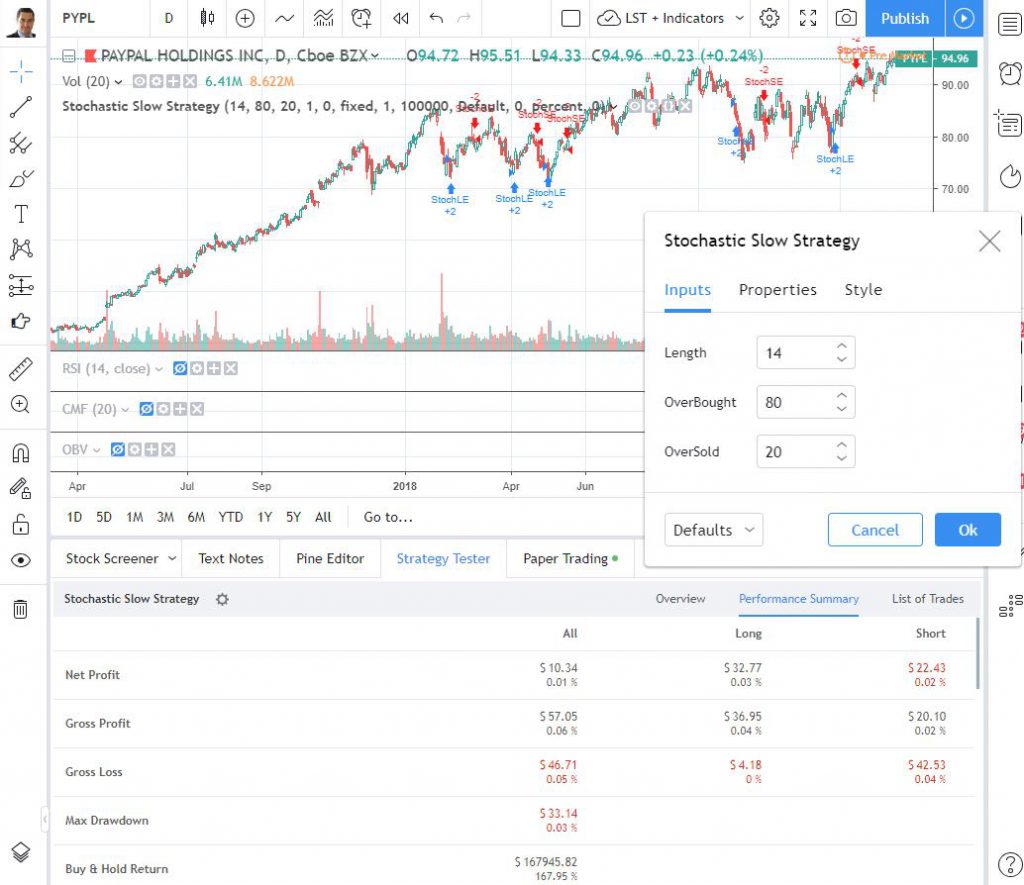
Reality check: Backtesting is not a profit guarantee; it’s a research accelerator. The platform that shortens your test cycle wins.
Scanning Performance
TradingView wins Scanning Performance, scoring 4.83. TradingView’s scanner is exceptionally fast in my testing, with a 7 ms S&P 500 scan benchmark, 360 scanning criteria, 4.50 Scanning Criteria & Depth, and 5.00 Custom Code Scanning. TradingView also offers Pine Screener, which allows users to scan watchlists with Pine scripts.

Deeper Dive: Scanner power moves
- Cross-market breadth (TradingView): Scan US, EU, and APAC stocks in one place, align with watchlists, and jump straight to annotated charts.
- Options-oriented scans (ToS): Filter by delta, open interest, and probability of OTM/ITM, and directly build candidates for multi-leg strategies.
- Workflow: Save scans, link them to alerts, and review signals at set times each day.
Personal rule: The best scanner is the one that reliably puts the right five charts on your screen every morning.
thinkorswim remains a capable scanner, especially for Schwab traders. It scores 3.50, slightly above the median 3.38, and earns 5.00 Custom Code Scanning. Schwab’s Stock Hacker tool is designed to help investors find stocks and options based on user-defined criteria. The distinction is clear: TradingView is faster and broader as a market-wide scanner; thinkorswim is more broker-workflow focused and particularly useful for U.S. stock and options scans.
Options Trading
The call: This is ToS territory. You get multi-leg strategy builders, Greeks, probability analysis, risk profiles, and paperMoney/OnDemand for practice. TradingView lacks a native US equity options modeling suite. If options are central to your trading, pick ThinkOrSwim without hesitation.

Deeper Dive: The Analyze tab advantage
- Risk curves & what-ifs: Plot P/L vs. price with volatility and time changes to understand exposure before sending the order.
- Probability tools: Estimate the chance of touching/expiring at a strike to intelligently size positions.
- Multi-leg construction: Iron condors, butterflies, calendars; stage, analyze, and send with linked orders.
Execution rule of thumb: If you manage risk primarily through structure (Greeks/time/volatility), ToS is built for you.
Trading Bot & Auto-Trading Reliability
TradingView wins Trading Bot & Auto-Trading Reliability with 3.50. TradingView’s advantage comes from stronger strategy sophistication and alert-based automation pathways. It supports Pine Script strategies and alerts, and TradingView notes that alerts can run on its servers even when users are not logged in. That makes TradingView better for semi-automated workflows, webhook-style handoffs, and rule-based monitoring.

thinkorswim’s 3.00 is still above the median of 2.50. Its automation strength comes from thinkScript, conditional orders, custom alerts, and broker-connected execution through Schwab. The limitation is that ToS is not a fully managed bot platform with a broad automation marketplace, formal public uptime guarantees, or native multi-broker automation. TradingView is stronger for flexible, cloud-based alert automation; thinkorswim is better for Schwab-native conditional trading workflows.
AI & Algo Index
TradingView wins AI & Algo, scoring 3.00. Neither platform is truly AI-native in the modern machine-learning/LLM sense, but TradingView has a stronger algorithmic ecosystem. Pine Script, strategy scripts, community indicators, alerts, and transparent user-generated code give TradingView a better algorithmic research layer. Its public script library is a major advantage for traders who want reusable indicators and strategies.
thinkorswim is algorithmically capable but not AI-forward. Its 1.50 reflects strong deterministic scripting through thinkScript, but no modern AI reasoning layer in the lab rubric. Schwab’s thinkScript materials focus on creating tools such as studies, alerts, scans, watchlist columns, and conditional orders—not machine-learning signal engines. TradingView is better for open algorithmic exploration; thinkorswim is better for rule-based workflows inside a broker platform.
Alert Speed
TradingView wins Alert Speed, scoring 4.67. TradingView’s alert system is one of its strongest practical tools: it supports chart alerts, indicator alerts, strategy alerts, Pine Script alerts, and server-side execution. TradingView’s Pine Script documentation says alerts run 24/7 on TradingView servers and do not require the user to stay logged in. That makes it excellent for monitoring many markets across devices.
thinkorswim is also strong, scoring 4.00. Its superpowers include 5.00 Concurrent Alerts and 4.00 Alert Speed Rating. ToS alerts are particularly useful when tied to charts, Stock Hacker, option conditions, and thinkScript logic. For Schwab traders, this is enough for a professional monitoring workflow. TradingView is stronger as a cloud-based multi-market alert system; thinkorswim is stronger when alerts are part of a Schwab trading workstation.
Trade Signal Quality
TradingView wins Trade Signal Quality with 2.50. TradingView earns partial credit because it offers built-in signal-style gauges, community-generated scripts, strategy outputs, and buy/sell style indicator frameworks. It is not an audited trade-signal vendor, but it does provide more visible signal context than thinkorswim through its public script and indicator ecosystem.
thinkorswim scores 0.00 because ToS does not publish audited platform-level trade calls under this rubric. That does not mean it cannot help traders find opportunities. It means the platform is a toolset, not a signal service. ToS users create or apply studies, scans, alerts, and option workflows, then make their own trading decisions. TradingView offers more signal-style overlays and community strategy tools; thinkorswim offers more broker-integrated decision support.
Broker Connectivity & Ecosystem Depth
TradingView wins Broker Connectivity & Ecosystem Depth with 5.00. TradingView scores full marks because it combines live trading support, broad broker integration, and wide asset/data coverage. It is better for traders who want broker choice, global markets, and the ability to trade from charts across a multi-asset platform.
thinkorswim scores 2.70, which is above the median 2.00, but its broker ecosystem is narrow. Live Trading 5.00 is one of its superpowers, but Broker Integration 0.10 is one of its weakest scores because ToS is built around Schwab rather than many broker connections. Schwab’s thinkorswim platform supports analysis and trading across stocks, options, futures, and forex. TradingView wins for broker breadth; thinkorswim wins only if Schwab is your chosen broker.
Portfolio Tool Performance
TradingView wins Portfolio Tool Performance, scoring 3.60. TradingView’s advantage is broader market tracking, watchlists, financial data, multi-asset analysis, portfolio-style monitoring, and research context across global markets. It is not a dedicated portfolio platform, but it provides a more flexible analytical layer for tracking many instruments across asset classes.
thinkorswim’s 2.60 reflects broker-account practicality rather than deep portfolio analytics. ToS can manage positions, track trades, show account performance, and support active trading workflows, but it is not designed for portfolio health scoring, dividend analytics, factor exposure, or allocation optimization. TradingView is better for portfolio awareness across markets; thinkorswim is better for managing Schwab trading positions.
Financial News Speed & Depth
This category is a tie: TradingView and thinkorswim both score 3.00. TradingView provides convenient integrated market news and symbol context, which is useful for research and general market awareness. But it is not designed as a real-time institutional news terminal. Its news workflow supports analysis more than catalyst trading.
thinkorswim also provides useful trading-context news, but its advantage is integration inside the broker workstation. For Schwab users, news appears alongside charts, watchlists, options tools, orders, and account positions. Neither platform is the best choice for high-speed news trading; Benzinga Pro, Scanz, eSignal, or Bloomberg-style tools are stronger for that. TradingView is better for broad market context; thinkorswim is better for news inside a trading-account workflow.
Community Utility Index (CUI)
TradingView wins Community Utility decisively with a perfect 5.00. TradingView’s community is a major product advantage: traders publish chart ideas, indicators, strategies, scripts, comments, and educational content at scale. TradingView describes itself as both a super-charting platform and social network for traders and investors.
Chart, Scan, Trade & Join Me On TradingView for Free
Join me and 20 million traders on TradingView for free. TradingView is a great platform for connecting with other investors, sharing ideas, creating charts, and engaging in live chat.
thinkorswim’s community score of 3.50 is respectable, but it is different in nature. The ToS ecosystem is more focused on practical platform knowledge: thinkScript examples, option workflows, Schwab education, Stock Hacker scans, and trading setup discussions. It is not a global social charting network. TradingView is better for community-driven discovery; thinkorswim is better for broker/platform-specific education and options-trading workflows.
Support Infrastructure & SLA Audit
thinkorswim wins Support Infrastructure, scoring 4.00. Schwab’s scale gives ToS a clearer support advantage: platform help, broker account support, educational videos, phone/support infrastructure, and a large formal learning ecosystem. This matters because thinkorswim is complex; users often need help with desktop setup, options chains, alerts, Stock Hacker, thinkScript, paperMoney, and account-specific trading questions.
TradingView’s 3.25 is adequate but not best-in-class. Its strength is community and documentation, not premium support infrastructure. For self-directed users, the community often solves workflow and script issues faster than formal support. But for broker-connected trading questions, Schwab’s support model is more substantial. TradingView wins the platform comparison overall; thinkorswim wins support because Schwab is both the platform provider and broker.
