Optuma has been in the technical analysis market for three decades. They cater to individual investors and fund managers and are a big hit with customers for their innovation, original charting, robust technical analysis, and customer support.
Optuma’s platform provides a comprehensive suite of tools, including advanced charting and drawing capabilities, backtesting, and market analysis.
Composite Lab Test Performance Score (CLPS)
Optuma’s AA 4.32 CLPS places it above the median benchmark (4.21) and signals a platform with real “workstation-grade” strengths rather than general-purpose convenience. The score is powered by repeatable, measurable advantages: multi-monitor responsiveness, top-tier chart depth, and elite backtesting throughput.
| Metric | Calculation | Optuma | High | Median | Low |
|---|---|---|---|---|---|
| Composite Lab Performance Score (CLPS) | Average for all ratings + 5X Superpower Boost for Top 5 killer features | 4.32 | 4.75 | 4.21 | 2.93 |
| Composite Lab Performance Score (CLPS) Overall Test Winners | TradingView 4.75 | TrendSpider 4.72 | Trade Ideas 4.52 |
This is not a beginner “chart app.” It’s a specialist platform designed to support advanced technical work, with a steeper learning curve and heavier desktop footprint.
Where it underperforms is in “modern platform convenience”: mobile/device coverage, community scale, and alert delivery streams are limited compared with web-native platforms.
Test Results & Ratings
My Optuma testing reveals a comprehensive market analysis platform developed for professional technical analysts and retail investors. Optuma specializes in exotic charts such as Gann, Seasonality, and Relative Rotation. Its main customers are financial institutions, and it has the pricing and support team to match.
| Test | Tier | Score | Median |
|---|---|---|---|
| Composite Lab Performance Score (CLPS) | AA | 4.32 | 4.21 |
| Pricing & Value Index | A | $4.03/day | $2.74/day |
| Value Score (VP) | C | 2.52 | 2.82 |
| Speed & Ease of Use | AAA | 4.83 | 4.50 |
| Chart Analysis Depth Index | AAA | 5.00 | 3.17 |
| Chart Pattern Depth & Accuracy | B | 3.65 | 2.73 |
| Scanning Performance | A | 4.05 | 3.38 |
| Backtesting Performance | AAA | 4.94 | 3.38 |
| Trading Bot & Auto-Trading Reliability | C | 2.50 | 2.50 |
| AI & Algo Index | C | 2.00 | 2.00 |
| Alert Speed | B | 3.00 | 3.67 |
| Trade Signal Quality | C | 0.00 | 0.00 |
| Broker Connectivity & Ecosystem Depth | C | 1.67 | 2.00 |
| Portfolio Tool Performance | C | 2.00 | 2.80 |
| Financial News Speed & Depth | C | 2.30 | 2.80 |
| Community Utility Index (CUI) | C | 1.75 | 3.25 |
| Support Infrastructure & SLA Audit | A | 4.00 | 3.75 |
Tested using rating system v3.
See the 2026 v3 58-point Optuma test and benchmarking.
Pros
✔ Great Technical Analysis Charts
✔ Gann Charts & Seasonality Charts
✔ Fast In-Depth Scanning
✔ Speed & Ease of Use
✔ High-Quality Quant Backtesting
✔ Point & Figure Charts
✔ Market Profile Charts
✔ Good Customer Satisfaction
✔ Professional Enterprise Services
Cons
✘ Additional Datafeed Required
✘ Broker Integration
✘ No Social
✘ No Integrated News Feeds

One key feature that sets Optuma apart from competitors is its proprietary scripting language, the Optuma Script Language (OSL). This powerful tool allows users to create customized indicators and trading strategies to fit their specific needs. This level of customization gives traders a competitive edge in the market.


Key Features
| ⚡ Features | Powerful Charts, Screening, Backtesting Fast |
| 🏆 Unique Features | Gann, Seasonality, Astrological Charts |
| 🎯 Best for | Technical Analysts |
| ♲ Subscription | Monthly, Yearly |
| 💰 Price/m | $67 | $122 | $225 |
| 💻 OS | Windows |
| 🎮 Trial | 14-Day |
| 🌎 Region | Global |
Pricing Index
From a purely economic perspective, Optuma is not positioned as a bargain. Its $4.03/day cost is above the median benchmark, and the per-feature metric also exceeds the median—so the “value” case depends on whether you actually use its advanced modules. This is important: Optuma’s pricing becomes rational when you need its deep charting, high-speed multimonitor workflows, and serious backtesting.
| Metric | Calculation | Optuma | High | Median | Low |
|---|---|---|---|---|---|
| Cost-per-day | $/day on an annual plan (min viable plan with real-time data) | $4.03/day | $9.99 | $2.74 | $0.74 |
| $ per feature | EMC / Total Features | $10.21 | $23.37 | $5.95 | $1.94 |
| Effective Monthly Cost (EMC) | (Plan + required real-time data + key add-ons) / month | $122.50 | $303.87 | $83.32 | $22.50 |
If you only need basic charts and a scanner, Optuma will seem expensive compared with web tools that bundle broad features into a single subscription.
Optuma is a super slick technical analysis platform designed for professional technical analysts in the Financial Industry. However, it is also priced to appeal to individual investors and traders. Starting at a very reasonable $ 67.50/mo for “Optuma Trader,” you will receive end-of-day data for 5 country groups.
My testing used Optuma Professional ($1350/y) with an additional $120 data feed, for an effective monthly cost of $122.50.
Stepping up to “Optuma Enterprise” at $225/m adds many unique features like Market Intelligence Charts, Full Relative Rotation Graphs (RRG), 3D Charts, Regression Charts, and, importantly, Quantitative Signal Testing.
Value Score (VP)
Optuma’s 2.52 Value Score sits below the median (2.82) because the rubric penalizes two things Optuma intentionally deprioritizes: broad device availability and “general consumer platform breadth.”
Feature Breadth is exactly at the median (12), and Feature Quality is slightly above the median, but Device Support Depth at 1.00 pulls the composite down. This is a classic pattern for specialist workstation tools: they can be excellent at what they do, but they don’t maximize value metrics designed to reward multi-device, broad-access platforms.
| Metric | Calculation | Optuma | High | Median | Low |
|---|---|---|---|---|---|
| Value Score | 60% Feature Quality + 30% Feature Depth + 10% Device Support | 2.52 | 4.37 | 2.82 | 1.70 |
| Value Rank | Percentile ranking | 1.75 | 5.00 | 2.50 | 1.00 |
| Feature Quality | Avg feature quality ratings | 3.03 | 4.16 | 2.97 | 2.00 |
| Feature Breadth | Count of meaningful core features | 12 | 17 | 12 | 9 |
| Feature Depth | Percentile ranking | 2.00 | 4.75 | 3.00 | 1.00 |
| Device Support Depth | Web=2; PC/iOS/Android=1 each | 1.00 | 5.00 | 2.00 | 1.00 |
| Value Score Test Winners | TradingView 4.37 | TrendSpider 4.20 | Trade Ideas 4.05 |
This value profile does not mean “weak tool.” It means Optuma’s strength is not convenience-driven feature bundling; it’s depth for specific types of technical analysis and systematic testing.
Speed & Ease of Use
Optuma’s 4.83 score is a major strength. The defining data point is an 8 ms multi-chart latency, combined with a perfect 5.00 multimonitor score and a perfect 5.00 on the 3-click ease metric. Time-to-chart is not “fastest in class” (7.39 seconds), but it still maps to 4.50, which is strong. In practice, this reads like a performant workstation: once the engine is running, chart interaction, syncing, and multi-window workflows are extremely responsive.
| Metric | Calculation | Optuma | High | Median | Low |
|---|---|---|---|---|---|
| Speed & Use Index | Avg(Time-to-Chart + Multimonitor + 3-Click) | 4.83 | 5.00 | 4.50 | 3.30 |
| Time to Chart Speed (sec) | Load 200 bars + 2 indicators | 7.39 | 17.03 | 4.70 | 1.60 |
| Time to Chart Performance | Speed→points rubric | 4.50 | 5.00 | 4.50 | 3.00 |
| Multi-Chart Latency (ms) | Sync delay across charts | 8.00 | 667 | 209 | 10 |
| Multimonitor Chart Speed | Multi-chart sync points | 5.00 | 5.00 | 3.50 | 0.00 |
| 3-Click Rule Test | Clicks to place a trade or launch a scan | 3 | 6 | 3 | 2 |
| 3 Click Rule: Ease | Clicks→points | 5.00 | 5.00 | 3.00 | 2.00 |
| Speed & Ease of Use Test Winners | TradingView 5.00 | Stock Rover 5.00 | Seeking Alpha 5.00 |
This is the advantage of desktop-first architecture: local compute can outperform browser-based rendering in multimonitor and synchronization-heavy workflows. Optuma is designed to handle complex layouts, heavy indicator stacks, and rapid analysis cycles without the latency taxes that web layers can introduce.
All my testing is performed on my powerful lab test rig, and since Optuma is a Windows desktop platform, it absolutely delivers incredible speed.
The interface, shortcuts, and overall thought process in Optuma mean it also passed our 3-click usability test, earning a strong score. They also have an extensive video training library that is valuable to new customers.
Chart Analysis Depth Index
This is Optuma’s clearest win: a perfect 5.00. The score is not “one lucky metric”—it’s full-spectrum dominance: maximum chart types (38), maximum chart depth score, maximum indicator depth score, and maximum custom coding score. That combination matters because many platforms can offer either lots of built-in indicators or deep customization, but not both at the top tier. Optuma’s chart stack supports professional-grade research workflows that require complex overlays, custom studies, and specialized analytical frameworks.
| Metric | Calculation | Optuma | High | Median | Low |
|---|---|---|---|---|---|
| Chart Analysis Depth Index | Avg(Chart Depth + Indicator Depth + Coding) | 5.00 | 5.00 | 3.17 | 0.50 |
| Chart Types | Total count | 38 | 38 | 10 | 1 |
| Chart Depth | 0.3 points per chart type | 5.00 | 5.00 | 3.00 | 0.30 |
| Indicators | Total count | 294 | 400 | 116 | 0 |
| Indicator Depth | 0.025 points per indicator | 5.00 | 5.00 | 2.90 | 0.00 |
| Custom Indicator Coding | Available = 5 points | 5.00 | 5.00 | 0.00 | 0.00 |
| Chart Analysis Depth Index Test Winners | TradingView 5.00 | MetaStock 5.00 | Optuma 5.00 |
Chart depth makes Optuma viable as a true research workstation: you can express non-standard chart forms, load large indicator sets, and build custom indicators without being boxed into the vendor’s defaults.
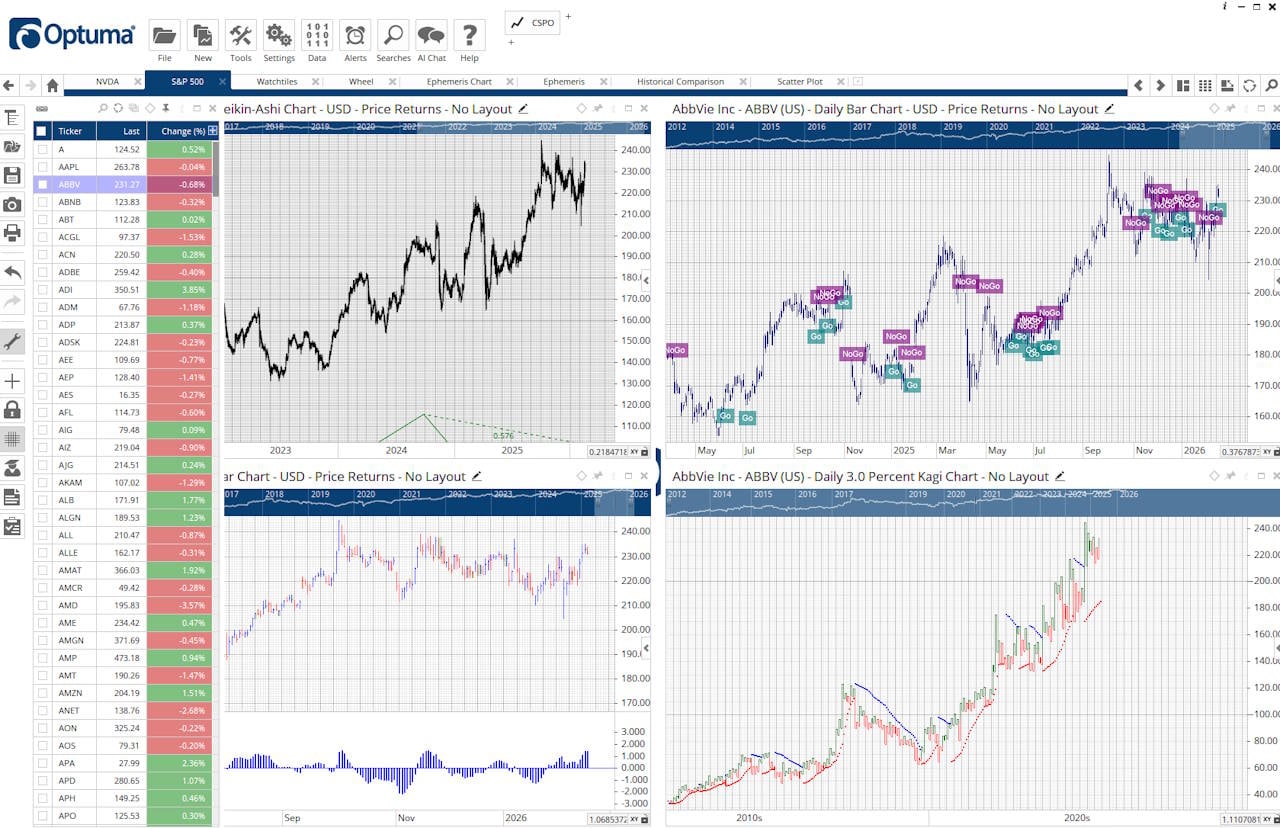
It offers 294 indicators and a benchmark leading 38 types of charts, an industry best. Optuma offers a wide range of chart types, including:
- Script-based chart types: Script Chart, Script Bar Chart
- Standard price charts: Line, Bar, Candlestick, Heikin-Ashi
- Point & Figure / swing-style charts: Point & Figure, Kagi, Renko, Range, Gann Swing, Point Swing, Percent Swing
- Comparison/relative charts: Relative Strength, Relative Comparison, Historical Comparison, Spread
- Rotation/sector analysis: Relative Rotation Graphs (RRG and Lite), Relative Rotation Graphs for Forex, Sector Maps
- Statistical/quant charts: Regression, Scatter Plot, Correlation Grid, Frequency Distribution, Bubble, Size, Curve
- Other/specialised: Market Intelligence Charts, Pairs Grid, Single Code Column, 3D Chart, Seasonality, Notes Chart/Notes Journal, Text Chart
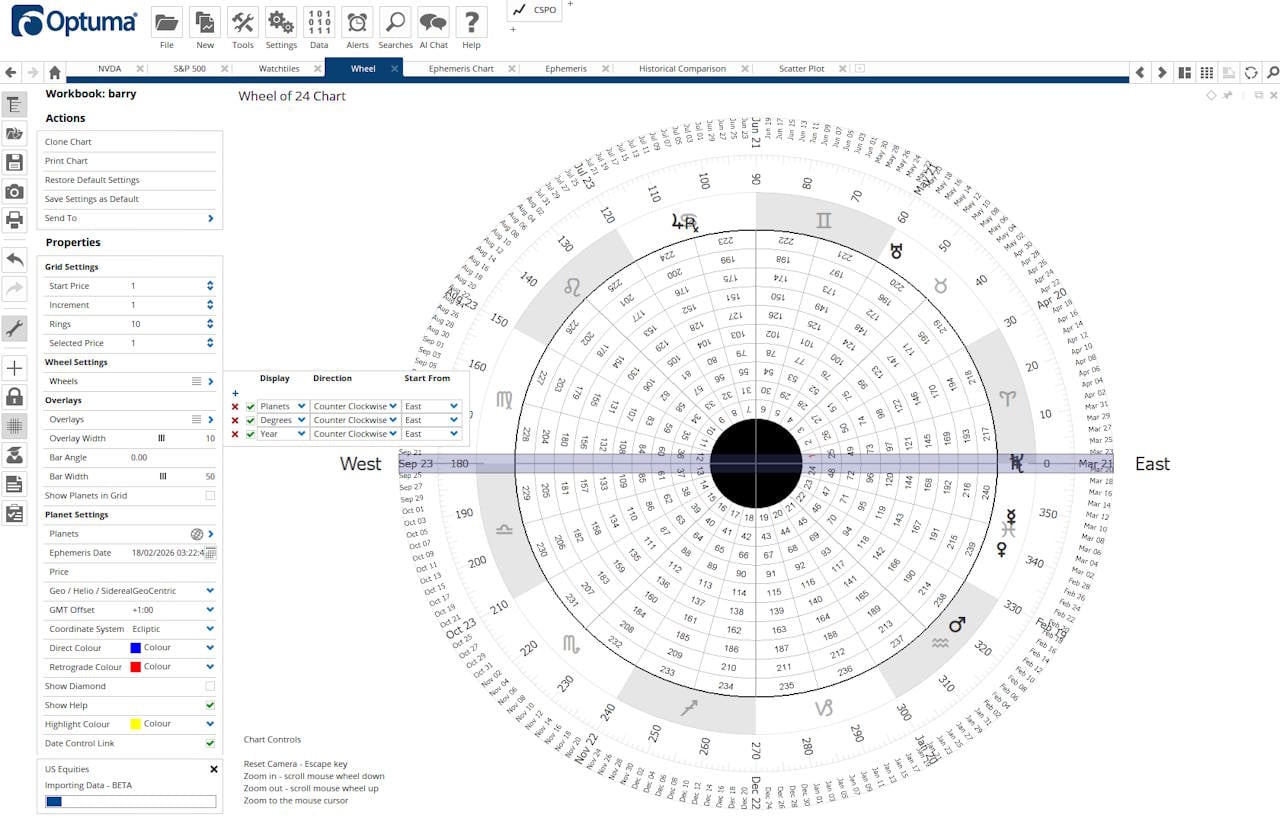
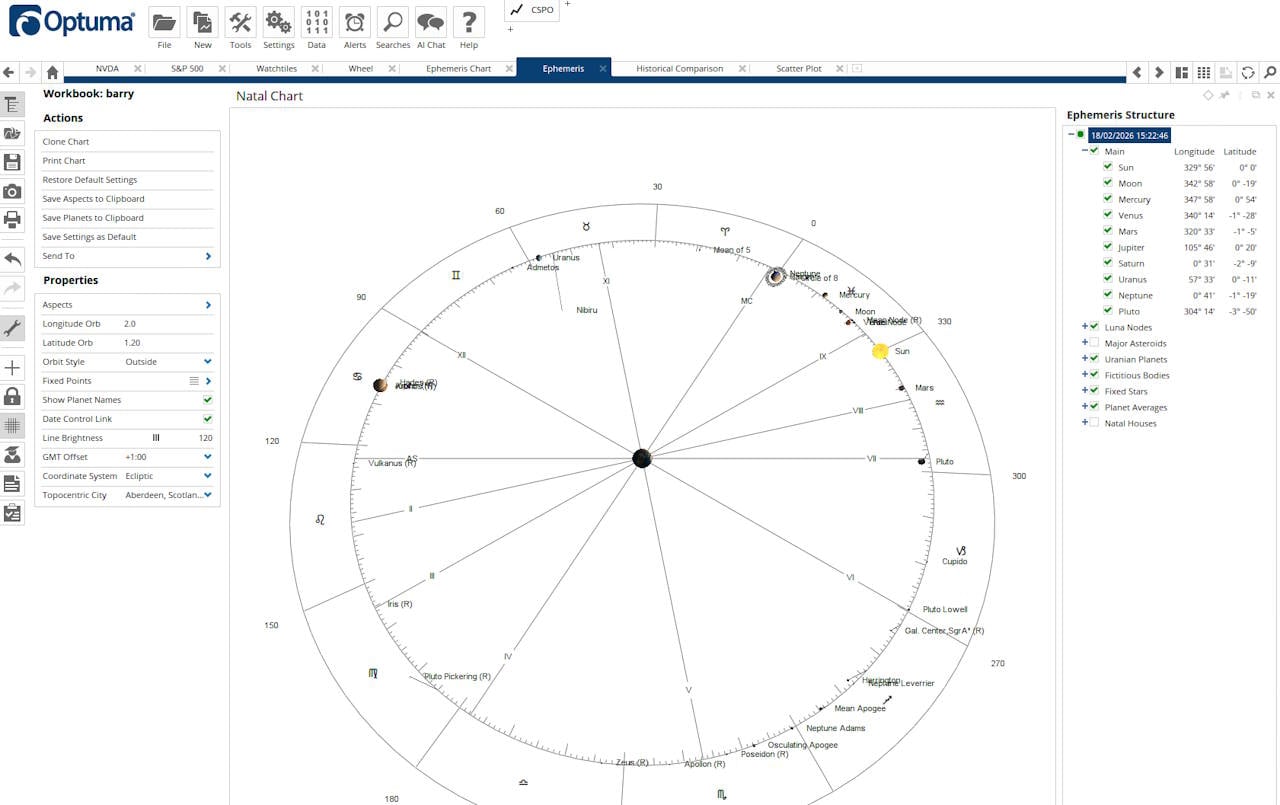
Optuma also specializes in Gann tools, offering a full suite: Gann Grid Lines, Gann Fans, Gann Swing, and a square of nine charts.
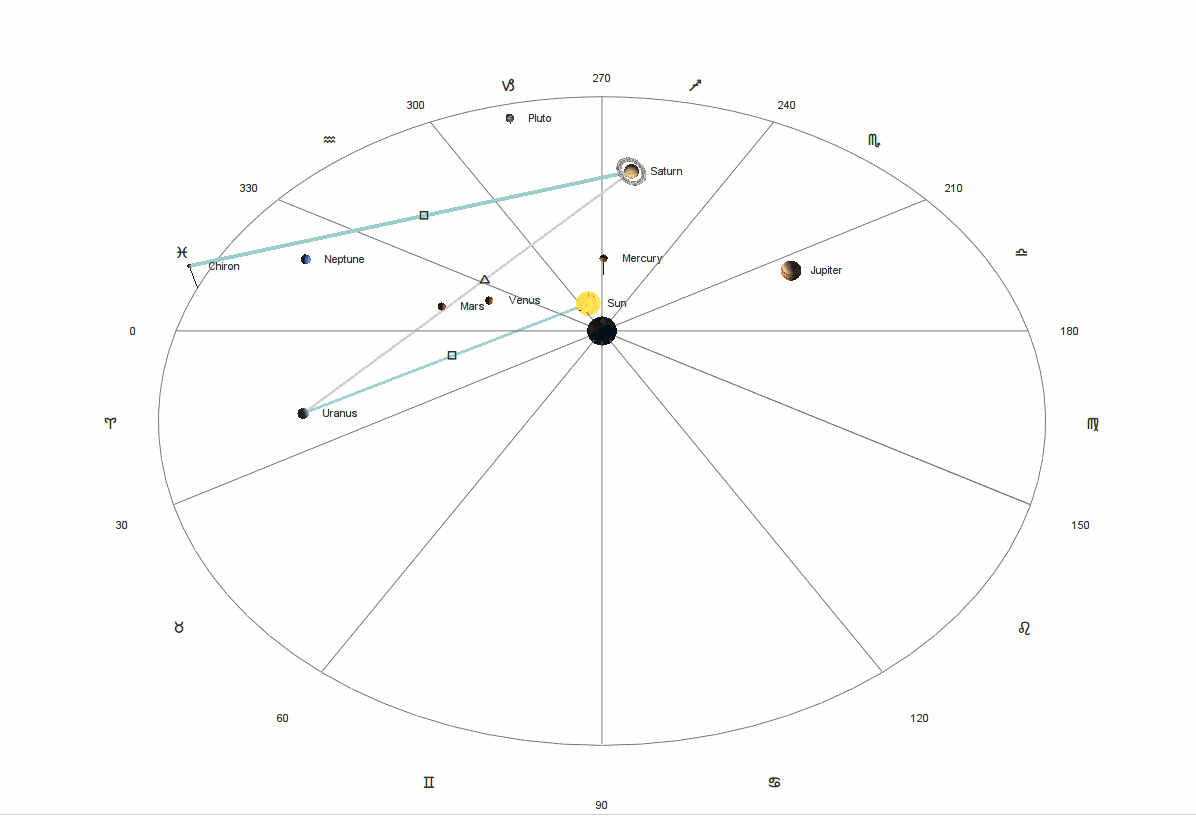
To top it off, they have also implemented an excellent astrological analysis suite as an upgrade for those of you who believe in that sort of thing; yes, commodity traders, I am talking about you :).
Also, one nice charting benefit is the unique market depth on the price scale.
Chart Pattern Depth & Accuracy
Optuma’s pattern score (3.30) is above median and is driven more by accuracy quality than raw pattern volume. Pattern count is moderate (71), but accuracy is strong (4.25), indicating the system is not just “spamming detections.”
Optuma’s pattern capability is best interpreted as “supportive tooling,” not a standalone prediction engine. Advanced users typically combine pattern recognition with custom indicators, cycle tools, overlays, and scripted logic to express a complete methodology. In that setting, accuracy matters more than raw count.
| Metric | Calculation | Optuma | High | Median | Low |
|---|---|---|---|---|---|
| Pattern Recognition Efficacy | Avg(Pattern Depth + Accuracy) | 3.65 | 4.88 | 2.73 | 0.00 |
| Total Patterns | Count of unique patterns | 71 | 226 | 57.50 | 0 |
| Pattern Recognition Depth | 0.33 points per pattern | 2.34 | 5.00 | 1.90 | 0.00 |
| Candle Patterns Recognized | Count | 55 | 172 | 22.50 | 0 |
| Price & Trend Patterns | Count | 16 | 54 | 24 | 0 |
| Accuracy | % accurate | 95% | 95% | 89.50% | 0% |
| Pattern Recognition Accuracy | 0.05 points per % | 4.25 | 4.75 | 4.48 | 0.00 |
| Chart Pattern Recognition & Accuracy Test Winners | TrendSpider 4.88 | Trade Ideas 4.62 | TradingView 3.98 |
Scanning Performance
Optuma’s scanning score (4.05) is above median and built on the right foundation: solid speed (248 ms), meaningful criteria depth (252), and perfect custom code scanning (5.00). This combination matters because scanning is only as valuable as its expressiveness.
Many tools are fast but shallow; Optuma is fast enough while also allowing advanced logic. The result is a platform that supports serious scan-driven workflows where you continuously refine logic, validate results, and build repeatable filters.
| Metric | Calculation | Optuma | High | Median | Low |
|---|---|---|---|---|---|
| Scanning Performance | Avg(Speed + Criteria + Custom Code) | 4.05 | 5.00 | 3.38 | 0.80 |
| Scanner Performance (ms) | S&P 500 scan across 5 criteria | 248 | 2500 | 300 | 7 |
| Scanning Speed Points | ms → points rubric | 4.00 | 5.00 | 4.00 | 1.00 |
| Auto-Refresh (sec) | Not scored | 10 | 60 | 1 | 0 |
| Total Criteria Count | Total scan criteria | 252 | 675 | 200 | 30 |
| Criteria Depth Points | 0.0125 points per criterion | 3.15 | 5.00 | 2.50 | 0.38 |
| Custom Code Scanning | Exists = 5 points | 5.00 | 5.00 | 5.00 | 0.00 |
| Scanning Performance Test Winners | Stock Rover 5.00 | TradingView 4.83 | TrendSpider 4.67 |
In Optuma, scanning is typically part of a pipeline: define criteria → scan → shortlist → validate on charts → test in backtester. The perfect score for custom code scanning confirms the platform supports this “research loop” rather than treating scanning as a simple menu filter. If you’re building specialized screeners (multi-condition logic, indicator states, pattern constraints), Optuma supports the complexity required to make scanning produce genuinely actionable lists—especially when paired with its backtesting and chart depth modules.
As you can see from the price, Optuma is squarely aimed at professional traders and wealth managers. Their clients are tier-one Wall Street investment houses. But you can still take advantage of their first-class solution. If you already have a Bloomberg feed, this also offers a new world of data and fundamental analytics. This seamless integration of fundamentals into charting and analysis is a significant improvement over the Bloomberg Terminal, making it a clear leader in this space.
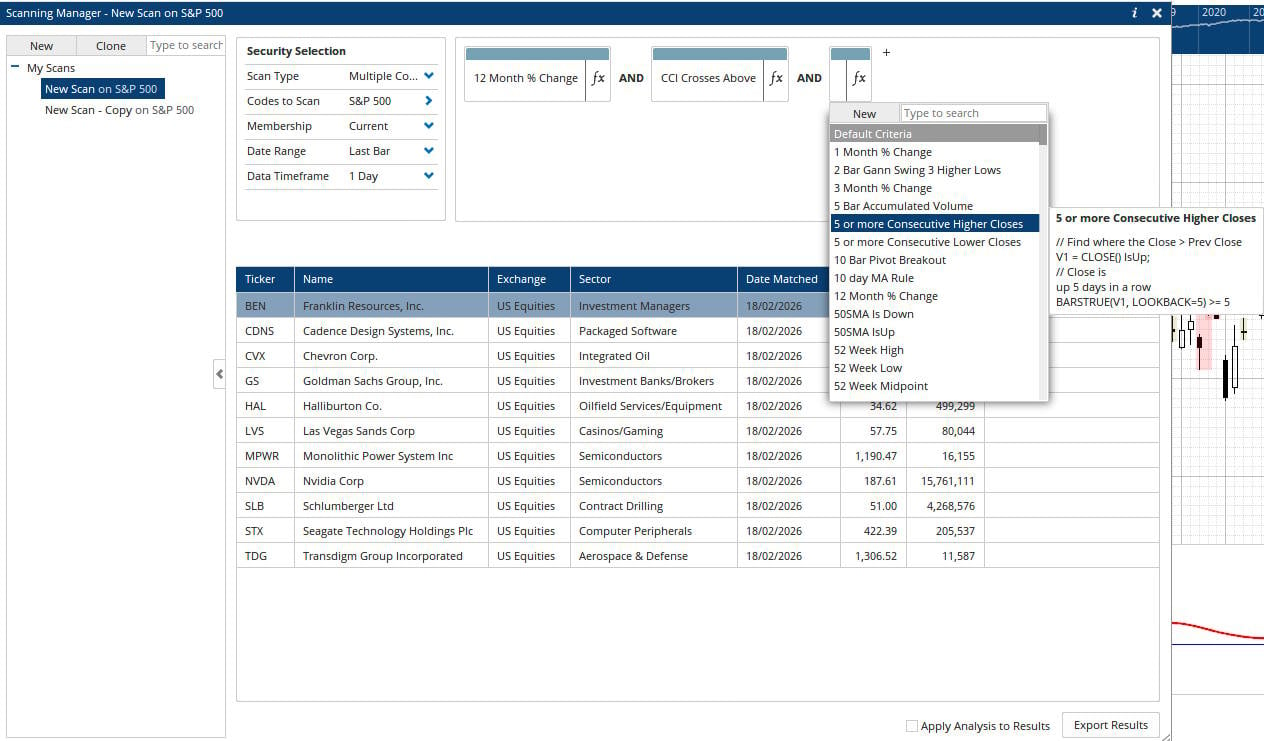
You can build watchlists using fundamental data, and everything operates in real time. Advanced scanning includes an excellent 3D sector map. A well-thought-out real-time scanning and filtering engine, and the fundamental watchlists are well implemented.
Backtesting Performance
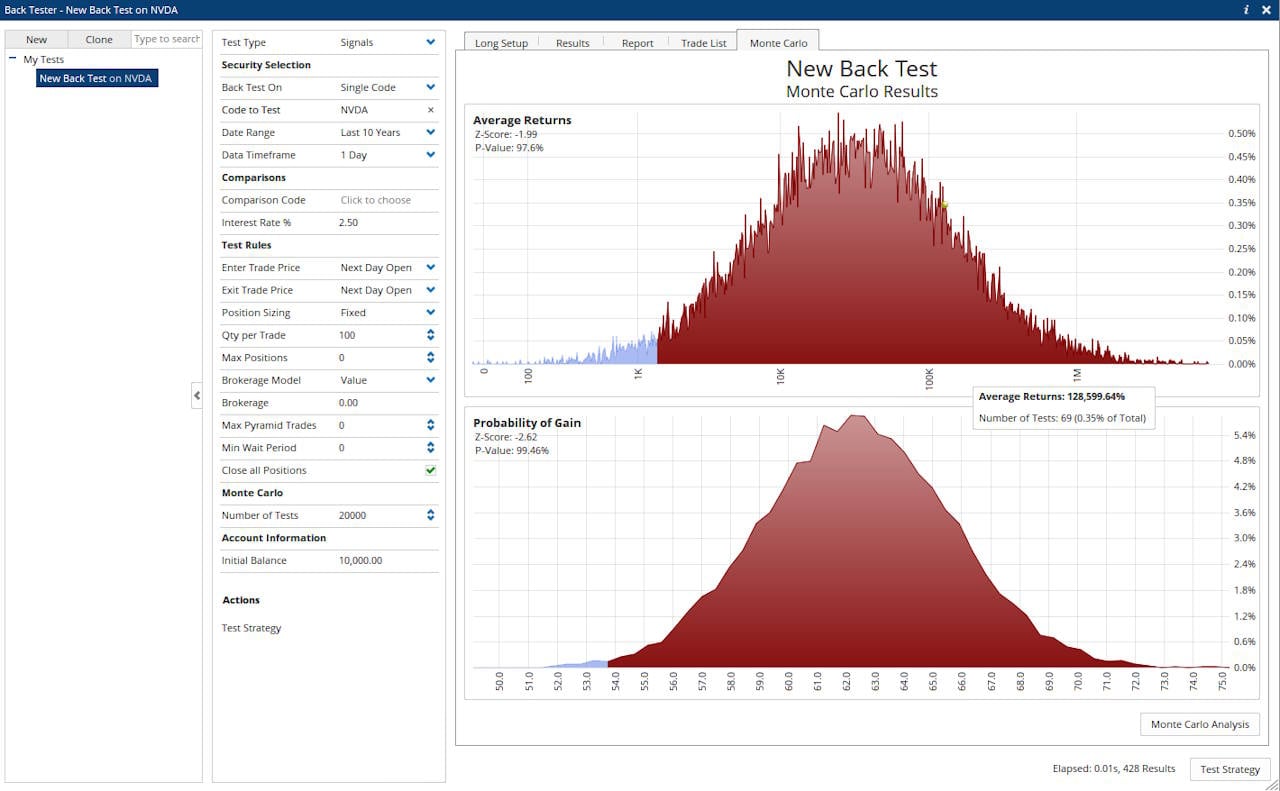
Backtesting is Optuma’s second headline win: 4.94, which exceeds even the “high benchmark” anchor (4.90). The score is supported across every component: maximum speed points, no-code support, flexible coding, near-top report quality, and full multi-stock basket testing. That pattern is rare. It indicates Optuma is engineered to iterate quickly and validate strategy logic with real reporting depth. If you care about turning ideas into tested systems, this is exactly the kind of backtesting profile you want.
| Metric | Calculation | Optuma | High | Median | Low |
|---|---|---|---|---|---|
| Backtesting Performance | Avg(Speed + No-code + Coding + Reports + Multi-stock) | 4.94 | 4.90 | 3.38 | 0.00 |
| Backtesting Speed (ms) | Time to run strategy sim | 1 | 6000 | 302 | 7 |
| Backtesting Speed Points | ms → points rubric | 5.00 | 5.00 | 4.25 | 0.00 |
| No Coding Required | Zero-code backtesting | 5.00 | 5.00 | 5.00 | 0.00 |
| Flexible Coding | Coded strategies exist | 5.00 | 5.00 | 5.00 | 0.00 |
| Report Quality (%) | % reporting coverage | 95% | 100% | 70% | 0% |
| Report Quality Points | 0.05 points per 1% | 4.75 | 5.00 | 2.25 | 0.00 |
| Multi-Stock Basket Backtesting | Exists = 5 points | 5.00 | 5.00 | 5.00 | 0.00 |
| Backtesting Performance Test Winners | Optuma 4.94 | TrendSpider 4.88 | MetaStock 4.81 |
Backtesting quality matters because it determines whether your strategy development process is scientific or anecdotal. Optuma’s profile implies you can move fast (run tests frequently), build strategies both visually and via code, and evaluate results with substantial reporting coverage. The multi-stock basket capability is especially important for realistic systematic workflows (diversification, robustness checks, regime testing).

Optuma also excels in backtesting, offering a well-implemented backtesting and system analysis toolset that rivals industry leaders. Still, unlike the others, you do not need a Ph.D. in mathematics to set up and test your system. The advanced programming language that connects all of Optuma is simple to use, and numerous detailed, helpful videos are available, allowing you to teach yourself as well. The code runs lightning-fast, and you can scan entire markets quickly and effectively.

The quality of the backtesting and advanced statistical analysis is due to the CEO, Mathew Verdouw, and many development team members being certified Chartered Market Technicians (CMT) and Certified Financial Technicians (CFTe), like myself. So, the quality of the testing tools is first-class.
Finally, the backtesting suite also includes Monte Carlo testing, which is surprisingly rare in technical analysis tools.
Trading Bot & Auto-Trading Reliability
Optuma lands exactly at the median (2.50) because it’s not positioned as an execution-first automation platform. You have real strategy sophistication (1.50) thanks to scripting and backtesting strength, but the automation pathway is limited (1.00) and operational assurance is absent (0.00). The implication is simple: Optuma is excellent for building and validating systems, but it’s not designed to be the “always-on broker automation layer” with formal reliability guarantees.
| Metric | Calculation | Optuma | High | Median | Low |
|---|---|---|---|---|---|
| Automated Execution & Bot Reliability | Automation Path + Sophistication + Assurance | 2.50 | 4.50 | 2.50 | 1.50 |
| Automation Path | 0.5 none → 2.0 native execution | 1.00 | 2.00 | 1.00 | 1.00 |
| Strategy/Bot Sophistication | 0.5 simple → 2.0 bot platform | 1.50 | 2.00 | 1.50 | 1.00 |
| Operational Assurance | Status/SLA evidence | 0.00 | 1.00 | 0.00 | 0.00 |
| Bot & Auto-Trading Reliability Test Winners | TrendSpider 4.50 | Trade Ideas 4.00 | Tickeron 4.00 |
If your goal is rigorous strategy creation and validation, Optuma’s backtesting and scripting strengths matter far more than direct execution wiring.
AI & Algo Index
Optuma sits at the median benchmark (2.00) but reaches it via deterministic tooling rather than “AI-native prediction.” The platform supports algorithmic depth through scripting and systematic testing, but it doesn’t present a formal transparency layer or validation artifacts under this rubric, which keeps transparency at 0.00. The practical takeaway is that Optuma is an “algo workbench” where the intelligence comes from the rules and models you build, rather than the platform generating trade calls for you.
| Metric | Calculation | Optuma | High | Median | Low |
|---|---|---|---|---|---|
| AI & Algo Index | Algo Depth + AI Layer + Transparency | 2.00 | 5.00 | 2.00 | 1.00 |
| Algo Depth | 0.5 alerts → 2.0 quant platform | 1.00 | 2.00 | 1.50 | 1.00 |
| AI Layer | 0.0 none → 2.0 AI-native | 1.00 | 2.00 | 0.00 | 0.00 |
| Transparency | 0.0 black-box → 1.0 clear validation | 0.00 | 1.00 | 1.00 | 0.00 |
| AI & Algo Index Test Winners | TrendSpider 5.00 | Trade Ideas 4.50 | Tickeron 4.50 |
Alert Speed
Optuma’s alerting is “strong internally, weak externally.” The score (3.00) is the direct result of unlimited alert capacity (excellent) combined with minimal stream richness (poor). This matters because many traders rely on alerts as a routing system—push to phone, email summaries, webhook automation, and multi-channel redundancy.
Optuma doesn’t compete on that delivery infrastructure in your dataset. If your workflow is workstation-based and you monitor alerts inside the application, the limitation is less painful.
| Metric | Calculation | Optuma | High | Median | Low |
|---|---|---|---|---|---|
| Alert Speed | Avg(Concurrent + Streams + Speed Rating) | 3.00 | 4.67 | 3.67 | 2.33 |
| Concurrent Alerts | 1 point per 50 alerts (max 5) | 5.00 | 5.00 | 5.00 | 5.00 |
| Concurrent Alert Count | Count | Unlimited | 2000 | 875 | 400 |
| Alert Streams Richness | Streams (email/webhook/SMS/app/etc.) | 1.00 | 5.00 | 2.00 | 1.00 |
| Alert Speed Rating | Lab speed rating | 3.00 | 5.00 | 3.00 | 1.00 |
| Alert Speed Test Winners | TradingView 4.67 | TrendSpider 4.33 | Benzinga Pro 4.33 |
Broker Connectivity & Ecosystem Depth
Optuma’s 1.67 reflects a clear split: data coverage is excellent (5.00), but the depth of the broker ecosystem is minimal. That means Optuma is strong as an analysis layer across markets, but it’s not designed to be a universal execution platform with dozens (or thousands) of broker connections.
Readers should interpret this as “bring your own execution workflow.” If the platform must be your broker hub, Optuma will disappoint. If the platform is your research engine, this limitation is manageable.
| Metric | Calculation | Optuma | High | Median | Low |
|---|---|---|---|---|---|
| Asset & Data Coverage Index | Avg(Live Trading + Broker + Coverage) | 1.67 | 5.00 | 2.00 | 0.67 |
| Live Trading | Exists = 5 | 0.00 | 5.00 | 5.00 | 0.00 |
| Brokers Integrated | Count | 0 | 1200 | 2 | 0 |
| Broker Integration | 0.1 per broker (max 5) | 0.00 | 5.00 | 0.20 | 0.00 |
| Asset & Data Coverage | Stocks/options/FX/international/etc. | 5.00 | 5.00 | 2.00 | 2.00 |
| Broker Connectivity & Ecosystem Test Winners | TradingView 5.00 | MetaTrader 5.00 | TrendSpider 4.43 |
Optuma scores a perfect 5.00 for asset and data coverage. Optuma can chart and analyse any market/instrument type (Stocks, ETFs, Mutual Funds, Options, Futures, FX, Bonds, Crypto) as long as you have a data source.
Financial News Speed & Depth
Optuma’s news score (2.30) is below the median benchmark, which is typical for a technical workstation where news is contextual rather than central. The 60–120-second delay estimate is fine for analysis and charting context, but not for latency-sensitive news trading.
Readers should interpret this to mean that Optuma is not a news terminal. If news is your edge, you’ll want a platform that prioritizes wire-speed delivery and integrated news workflows.
| Metric | Calculation | Optuma | High | Median | Low |
|---|---|---|---|---|---|
| Financial News Speed & Quality Rating | Weighted news rubric | 2.30 | 5.00 | 2.80 | 0.00 |
| Wire Delay (approx.) | Seconds behind primary wires | 60s–120s | <1s | 60–300s | Hours/Days |
| Financial News Speed & Depth Test Winners | MetaStock 5.00 | Benzinga Pro 5.00 | Scanz 5.00 |
Optuma’s news capability fits best as an overlay: annotate charts, provide context for price moves, and support post-move analysis. In that role, it can be useful—especially if you align it with a professional data feed plan.
If you can afford or have a Bloomberg feed, you will get the top-end real-time market data you need. You can also publish and share ideas with your team or workgroup to improve collaboration through chat.
Community Utility Index (CUI)
Optuma is a “niche expert tool” signature: community size is extremely small (0.50), but contribution quality is decent (3.00). So you don’t get scale effects—lots of shared scripts, instant replies, huge idea feeds. Optuma won’t hand you a massive library of community strategies. You will rely more on your own research and the vendor’s training materials.
| Metric | Calculation | Optuma | High | Median | Low |
|---|---|---|---|---|---|
| Community Utility Index | Avg(Community Size + Contribution Quality) | 1.75 | 5.00 | 3.25 | 1.75 |
| Active Community Size | “Crowd density” score | 0.50 | 5.00 | 3.25 | 1.80 |
| Quality of Contribution | Quality/IP score | 3.00 | 5.00 | 3.50 | 1.50 |
| Community Utility Index Test Winners | TradingView 5.00 | MetaTrader 5.00 | Trade Ideas 4.75 |
If you are the kind of user who expects crowdsourced templates and constant shared indicators, Optuma will feel isolated. If you’re already a disciplined analyst who builds and tests independently, a smaller community is not necessarily a problem.
Support Infrastructure & SLA Audit
Support is a meaningful strength: 4.00 is above the median benchmark (3.75) and matters more here than it would for a beginner tool. With complex modules and scripting, high-quality support reduces operational friction and learning time. The 1–2 hour benchmark suggests responsive handling of advanced questions. For readers evaluating Optuma, this is a risk-mitigation factor: even if the learning curve is steep, strong support makes adoption far more realistic.
| Metric | Calculation | Optuma | High | Median | Low |
|---|---|---|---|---|---|
| Support SLA Audit | Avg(Channels + Response Time) | 4.00 | 5.00 | 3.75 | 1.00 |
| Support Communication Channels | Access scale | 4.00 | 5.00 | 3.50 | 1.00 |
| Support Response Times | SLA scale | 4.00 | 5.00 | 4.00 | 1.00 |
| Stated SLA & Tested Outcomes | Observed benchmark | 1–2 Hours | < 5 Minutes | < 30 Minutes | N/A |
| Support Infrastructure & SLA Audit Winners | TrendSpider 5.00 | TC2000 5.00 | ThinkorSwim 4.75 |
Optuma is not a “self-explanatory” consumer UI—its value comes from advanced workflows. That means users will inevitably hit deep configuration questions, data feed nuances, scripting challenges, and interpretation issues. A support team capable of resolving complex cases is a competitive advantage.
Alternatives to Optuma
When comparing Optuma, TrendSpider, TradingView, MetaStock, and Trade Ideas, our analysis reveals that TrendSpider stands out as the best overall stock analysis software, excelling in 10 out of 12 tests. With its powerful features for automated chart analysis, backtesting, and bot trading, TrendSpider emerges as our top recommendation for traders seeking advanced, reliable tools.
TradingView is better for a global trading community. Stock Rover is better than Optuma for long-term growth, dividends, and value investors. For AI-driven robotic day trading, Trade Ideas is the better option. For trading real-time news, Benzinga Pro is a better alternative.
| Features? ✔★=Superpower | Optuma | TrendSpider | TradingView | Trade Ideas | MetaStock |
| Rating | 4.32 | 4.72 | 4.75 | 4.52 | 4.19 |
| Pricing | $67 | $122 | $225 | $54 | $214 | $0 | $15 | $35 | $70 | $89 | $178 | $100 | $265 |
| Global Market Data | ✔ | USA | ✔ | USA | ✔ |
| Powerful Charts | ✔★ | ✔★ | ✔ | ✘ | ✔★ |
| Stocks | ✔ | ✔ | ✔ | ✔ | ✔ |
| Futures | ✔ | ✔ | ✔ | ✘ | ✔ |
| Forex | ✔ | ✔ | ✔ | ✘ | ✔ |
| Cryptocurrency | ✔ | ✔ | ✔ | ✘ | ✘ |
| Social Community | ✘ | ✘ | ✔★ | ✔ | ✘ |
| Real-time News | ✘ | ✘ | ✘ | ✘ | ✔★ |
| Screeners | ✔★ | ✔★ | ✔ | ✔ | ✔★ |
| News Scanning | ✘ | ✔ | ✘ | ✘ | ✔★ |
| Backtesting | ✔★ | ✔★ | ✔ | ✔ | ✔ |
| Code-Free Backtesting | ✔★ | ✔★ | ✘ | ✘ | ✘ |
| Automated Analysis | ✔ | ✔★ | ✔ | ✔★ | ✔ |
Hi Mathew, thank for taking the time to provide such detailed feedback, I appreciate it.
Barry
Hi Barry,
I wanted to jump in on this one. It turns out that Chad’s workbook was one of the most complex which we have ever seen at Optuma. The real issue came down the flexibility of the Watchlists which allowed for multiple columns of complex calculations across the whole S&P with real-time data. A calculation which takes 100ms is not an issue when it is a tool on a chart – but when it is repeated around 6,000 times in a watchlist (multiple columns for 500 securities) it becomes a real issue. We are really grateful for Chad because working with him on this allowed us to repeat the issue and make Optuma handle even these extreme cases.
From the start I have always designed Optuma to be as flexible as possible. The issue with that is that we can not possibly test everything that a user will do with the software. That’s why we really do appreciate clients like Chad who are willing to work with us so we can make sure that Optuma meets their specific requirements. In Chad’s case, the delay was my fault as I needed to be involved but I was not able to spend the time looking into the issue. Our understanding is that the stability issues for Chad have been resolved in Optuma 1.5 and hopefully he will add an update here to confirm.
Our goal is always to build a premium Technical and Quantitative analysis program. One of our largest sources of inspiration comes from listening to client requests. While we would love to implement everything requested, we do have to review each request in light of the following criteria:
– How hard is it to implement (what will it cost us)
– Does it fit with the direction we are taking Optuma
– How many clients are asking for this feature
– Is there an alternative solution
Trading interfaces is a prime example. While we have built them in for some of our retail feeds (like Interactive Brokers) we hove not bothered for the Institutional Feeds (as mentioned by Chad). It would take an enormous effort to interface with the various platforms and there are not enough clients using any one platform to make it worthwhile. News is another case. There are so many good news services that we do not see the value in integrating news into the charting platform (although we do have a horrible News chart for IQFeed as a test). Portfolio Interfaces is another matter and that is something we are working on as our resources allow.
We’ve also been starting to ask clients to leave feedback on Optuma at https://au.trustpilot.com/review/optuma.com
All the best
Mathew Verdouw, CMT, CFTe
CEO / Founder
Optuma
Hi Chad, this is great feedback, and I am sure it will help other technical analysts and professionals make a better decision.
thank you
Bary
Hello, and thanks for the review. I found this review as I googled “Optuma keeps crashing on me”.
I believe you are largely spot on and I am trying to make it a point that I will not need Bloomberg whatsoever as long as I have Optuma, and I think Optuma is very close to being able to do that for me if it wasn’t for a few interesting things I have encountered as a power user. I have such aspirations for this software, but it just can’t seem to get the little (but necessary) things right. It has tons of great bells and whistles and everything you could ever want or need (and more) when it comes to TA tools.
I have been an Optuma user for 2 years now, and am largely very happy with it. It has allowed me to do things I could never have done with other software. However, I find my frustrations are as much as my happiness as I have run into countless issues with the program bogging down, being slow, etc. You definitely need a high power pc to run it, as I indeed upgraded mine to a $3,000 laptop with a solid state drive and top of the line Nvidia graphics card after it would continuously crash my system after just a few weeks use/building out workbooks (before I even really learned how to write scripts in it). I still find to today the software crashes on me daily and there are at least 10 times in a day where it bogs down “importing some ticker” for 10-20 seconds to sometimes up to a minute in time. I have talked with the CEO about adding a feature that could help this (an x button to stop a background process, but it’s still not implemented yet).
I have recently been told I am simply, “asking too much of the program” and have deleted about 10 out of 75 sheets in the primary workbook I use to try to help. Of note, I have zero of the GANN functionality. One thing I notice, though, is my workbook is only 4Mb in size, so the reality of the issue is I am probably asking too much of the servers and/or my cache that is communicating with the servers, not too much of my own computer (but I am by no means a software/hardware guru). From what I understand, the software continuously pulls all data and historical data and does not save sany of it locally, even historical data, (as far as I know), so each and every day it goes and downloads the same data over and over and over again, which I believe could be a major reason why I have so many more system issues with Optuma than I ever did with Tradestation. All I know is I continue to run into at least some issue each and every day.
In the aggregate the issues are an absolute killer in productivity and heightened frustration offset by the positive productivity all of the other great features it provides me (many of which you discuss).
I believe a part of the reason is also the 3rd party real time data feeds (I use DTN) as I haven’t had it crash on me after hours (albeit I don’t use it that much after hours). I come from the world of Tradestation where I would have 10s to 100s of tabs open in the program at once and never have an issue with them bogging down my computer (a much slower computer at that). I also paid Tradestation for the data, not a 3rd party, so it ran directly from them to my computer. It seems this difference may be significant with Optuma because of the way they source their data (all a hunch of mine admittedly).
On the plus side I have gotten quick and tons of great back and forths with support who are always quickly turning around requests. It helps that half of them are in Australia with the other half on this side of the world. They really do try to help you when you are having issues.
This program could be the end all be all for technical analysts and quants if they could just figure out a few of these known issues.
Also, if I had to say something else that is lacking (and you point out with Bloomberg a lot of this is solved), but without bloomie the portfolio management piece leaves a lot to be desired. There’s not an easy way to see each day how the portfolio did (with weights, etc). You can only get close using averages and medians across watch lists. It would be nice if it also integrated with other APIs, such as Koyfin or Yahoo Finance or even our custodians to update account values, watch lists, etc seamlessly. Finally a ticker bar is something that would be amazing (which TStation had), but supposedly can’t be done in Optuma. There’s also no trading integration (except maybe Bloomberg), so not sure how I could give it 4 out of 5 stars for that.
The headline to my post would be: “Optuma could be so frickin awesome it kills me, if it could just get out of its own way!” I’d probably give it 4/5 with some 2s and 3s on news, ease of use and 5/5 on the backtesting as you get plenty of good quick results that you can also export to excel to add analysis around.