Lab Test Composite Score
Stock Rover’s CLPS is AA 4.37, above the median 4.19 and within striking distance of the leaders. This is what you want to see from a portfolio-first platform: strong “daily workflow” utility (screening, research depth, reporting) rather than a narrow specialty score inflated by one feature.
| Metric | Calculation | Stock Rover | High | Median | Low |
|---|---|---|---|---|---|
| Composite Lab Performance Score (CLPS) | Average for all ratings + 5X Superpower boost for Top 5 killer features | 4.37 | 4.75 | 4.19 | 2.90 |
| Composite Lab Performance Score (CLPS) Overall Test Winners | TradingView 4.75 | TrendSpider 4.72 | Trade Ideas 4.52 |
A CLPS above median typically means fewer “tool gaps” you’ll need to patch with paid add-ons. Stock Rover’s profile is consistent: it wins by being a complete research + portfolio system, not by pretending to be a broker terminal.
My Ratings & Verdict
My testing shows Stock Rover is best for long-term dividend, value, and growth investors. Its exceptional features are in-depth screening of a 10-year financial database, research reports, and broker-integrated portfolio management.
| Test | Tier | Score | Average |
|---|---|---|---|
| Lab Test Composite Score | AA | 4.37 | 4.19 |
| Pricing Index | AAA | $0.77 | $2.74 |
| Value Score (VP) | B | 3.63 | 2.82 |
| Speed & Ease of Use | AAA | 5.00 | 4.50 |
| Chart Analysis Depth Index | AA | 4.50 | 3.50 |
| Chart Pattern Depth & Accuracy | N/A | N/A | 2.73 |
| Scanning Performance | AAA | 5.00 | 4.50 |
| Backtesting Performance | A | 4.00 | 4.00 |
| Trading Bot & Auto-Trading Reliability | C | 2.50 | 1.50 |
| AI & Algo Index | C | 2.50 | 2.00 |
| Alert Speed | C | 2.67 | 1.50 |
| Trade Signal Quality | C | 2.50 | 0.00 |
| Broker Connectivity & Ecosystem Depth | C | 2.25 | 4.50 |
| Portfolio Tool Performance | AAA | 4.80 | 2.80 |
| Financial News Speed & Depth | C | 2.00 | 2.30 |
| Community Utility Index (CUI) | C | 2.75 | 4.00 |
| Support Infrastructure & SLA Audit | B | 3.50 | 3.50 |
Tested using benchmarking system v3.
See the 2026 v3 58-point Stock Rover test and benchmarks.
Pros
✔ 800+ Financial Screening Metrics
✔ Potent Stock Scoring Systems
✔ Unique 20-Year Historical Financial Data
✔ Warren Buffett Value Screeners & Portfolios
✔ All Important Financial Ratios
✔ Real-time Research Reports
✔ Portfolio Management & Rebalancing
✔ Broker Integration
✔ Winner: Best Value Investing Screener
Cons
✘ No Social Community
✘ Not for Traders
✘ No Cryptocurrency or Forex Data
✘ US Markets Only

Stock Rover is an industry-leading platform that enables the development of intricate dividend, value, and growth investing strategies.
With Stock Rover, I have developed highly valuable strategies using its unique fair value, discounted cash flow, and margin-of-safety data. Its extensive growth investing data, such as performance versus the S&P 500 and industry growth and earnings rankings, make Stock Rover the best choice for serious investors.
Stock Rover’s key benefits include portfolio correlation and balancing, along with tools to screen for dividends, value, and growth stocks. With 10 years of historical data, you can backtest your criteria to see whether your scans would have been profitable in the past.
Key Features
| ⚡ Stock Rover Features? | Charts, News, Watchlists, Broker Integration |
| 🏆 Exceptional Features? | Financial Screening, Portfolio Mgt & Rebalancing, 10-Year Database |
| 🎯 Best for | Growth, Dividend & Value Investors |
| ♲ Subscription | Monthly, Yearly |
| 🆓 Free | ✔ |
| 💰 Price | $0 | $29 | $49 |
| 💻 OS | Web Browser |
| 🎮 Trial | 14-Day |
| ✂ Discount Code | -25% During Premium Trial Period |
| 🌎 Region | USA |
Stock Rover is for long-term investors who want to grow and manage a stock portfolio. While products like TrendSpider and TradingView have investing features, they are more focused on trading features, like AI pattern recognition and technical scanning. Portfolio 123 is a direct competitor, but Stock Rover is better for price, research reports, news, and financial screening.
Why I Rate Stock Rover Highly
What is Stock Rover?
Founded in 2008 by Howard Reisman and Andrew Martin, Stock Rover is a US-based company providing stock screening, research, and portfolio management software. Targeted at individual investors, Stock Rover enables value, income, and growth investors to target their investments and manage their portfolios of stocks. Stock Rover customers manage over $10 billion in assets through its brokerage connection service.
Pricing Index
Stock Rover’s AAA $0.77/day is far below the median $2.74/day, which is exactly what value-focused investors want: low carrying cost for a tool you’ll use all year, not just during “active trading months.”
| Metric | Calculation | Stock Rover | High | Median | Low |
|---|---|---|---|---|---|
| Cost-per-day | $/day on an annual plan. Minimum viable plan with real-time exchange data | $0.77 | $9.99 | $2.74 | $0.74 |
| $ per feature | Effective Monthly Cost /Total Features | $1.94 | $28.92 | $4.29 | $0.00 |
| Effective Monthly Cost (EMC) | EMC = (Plan price + required real-time data fees + any required add-ons) / month | $23.33 | $376.00 | $60.00 | $0.00 |
Stock Rover is “cheap enough to keep” even if you’re not trading daily—which matters because fundamentals/portfolio work is ongoing. In my audit notes, the plan basis used here is Premium Plus Service, so you’re not comparing a stripped free-tier plan.
You can have Stock Rover for free; however, the real power is unleashed with the Premium services.
Stock Rover’s Free plan includes ad-free screening for 8,500 stocks and 7,000 ETFs, portfolio analysis, and stock market news. The Free plan is OK for investors who use simple screening strategies and want to manage multiple stock portfolios in one place.
Stock Rover Premium & Premium Plus cost $29 and $49/mo, paid annually. I recommend Premium Plus for all experienced growth, income, and value investors because it unlocks unlimited fair value and margin-of-safety ratings, stock ratings, investor warnings, 700 metrics, and 20 years of historical data screening.
Ultimate and Ultimate Pro cost $79 and $149/mo, paid annually. These plans extend the services to include Options analysis, Insider metrics, and multiple client portfolio management tools for advisors. A 2-year subscription reduces all plans by 40%, representing a significant saving.
Stock Rover 25% Discount
Stock Rover does not offer coupon codes; however, new customers who start a free premium or premium plus trial receive a 1-year 25% discount. You can save 28% if you sign up for a two-year subscription.
Sign up for a free 14-day premium trial for a 25% discount on Stock Rover. Toward the end of the trial period, you will receive an email from Stock Rover offering a 25% discount on any paid plan.
Value Score (VP)
Stock Rover’s Value Score is 3.63, comfortably above the median 2.82. This score blends feature quality and feature breadth/depth—and Stock Rover does well because its fundamental database and portfolio analytics are genuinely usable, not checkbox features.
| Metric | Calculation | Stock Rover | High | Median | Low |
|---|---|---|---|---|---|
| Value Score | Sum of Value Rank, Feature Quality, Breadth, Depth & Device Support | 3.63 | 4.37 | 2.82 | 1.70 |
| Value Rank | Relative value rank, based on score to price | 4.00 | 5.00 | 3.00 | 1.00 |
| Feature Quality | Subjective evaluation of feature quality. Scale 0 to 5, 0 is no features. | 4.00 | 5.00 | 3.50 | 2.00 |
| Feature Breadth | Total features. 1 Point Per Feature | 12 | 17 | 12 | 9 |
| Feature Depth | Subjective evaluation of feature depth. Scale 0 to 5 | 4.25 | 5.00 | 3.00 | 2.00 |
| Device Support Depth | 1 point per PC, Mac, Web, Android, iOS. | 2.00 | 4.00 | 4.00 | 1.00 |
| Value Score Test Winners | TradingView 4.37 | TrendSpider 4.20 | Trade Ideas 4.05 |
The “value” story here is straightforward: strong research depth at a low cost, with the main tradeoff being the depth of device support. If you need full cross-device parity (especially mobile-first), this is the one weak link in an otherwise high-value package.
Stock Rover’s value is rooted in fundamentals and portfolio discipline: faster screening, cleaner validation of thesis (quality, valuation, growth, risk), and better ongoing monitoring. If your strategy is long-term compounding and risk control, that’s real ROI. If you’re day trading off patterns and executions, you’ll pay for features you won’t use.
Speed & Ease of Use
Stock Rover scores a best-in-class AAA AAA vs the median 4.50. That means low friction: you can get from “idea” to “decision” quickly without wrestling with menus or loading delays.
| Metric | Calculation | Stock Rover | High | Median | Low |
|---|---|---|---|---|---|
| Speed & Use Index Rating | Average of Time to Chart Performance, Multimonitor Chart Speed & 3 Click | 5.00 | 5.00 | 4.50 | 3.25 |
| Time to Chart Speed (Seconds) | Seconds from clicking the icon to a fully loaded chart with 200 price bars & 2 indicators. | 4.04 | 17.03 | 4.70 | 1.55 |
| Time to Chart Performance | 17.03 – 1.55 / seconds from clicking tool icon to chart | 4.50 | 5.00 | 4.50 | 1.00 |
| Multi-Chart Latency (ms) | Delay in milliseconds when syncing 4 monitors/charts. | 295 | 2000 | 375 | 20 |
| 3-Click Rule Test | Number of Clicks to view a chart or a scan | 2 | 10 | 2 | 2 |
| Speed & Ease of Use Test Winners | TradingView 5.00 | Stock Rover 5.00 | Seeking Alpha 5.00 |
In my audit notes, I flagged that a deep, fundamental database can take time to initialize; that’s normal for data-heavy tools, but Stock Rover is lightning-fast.
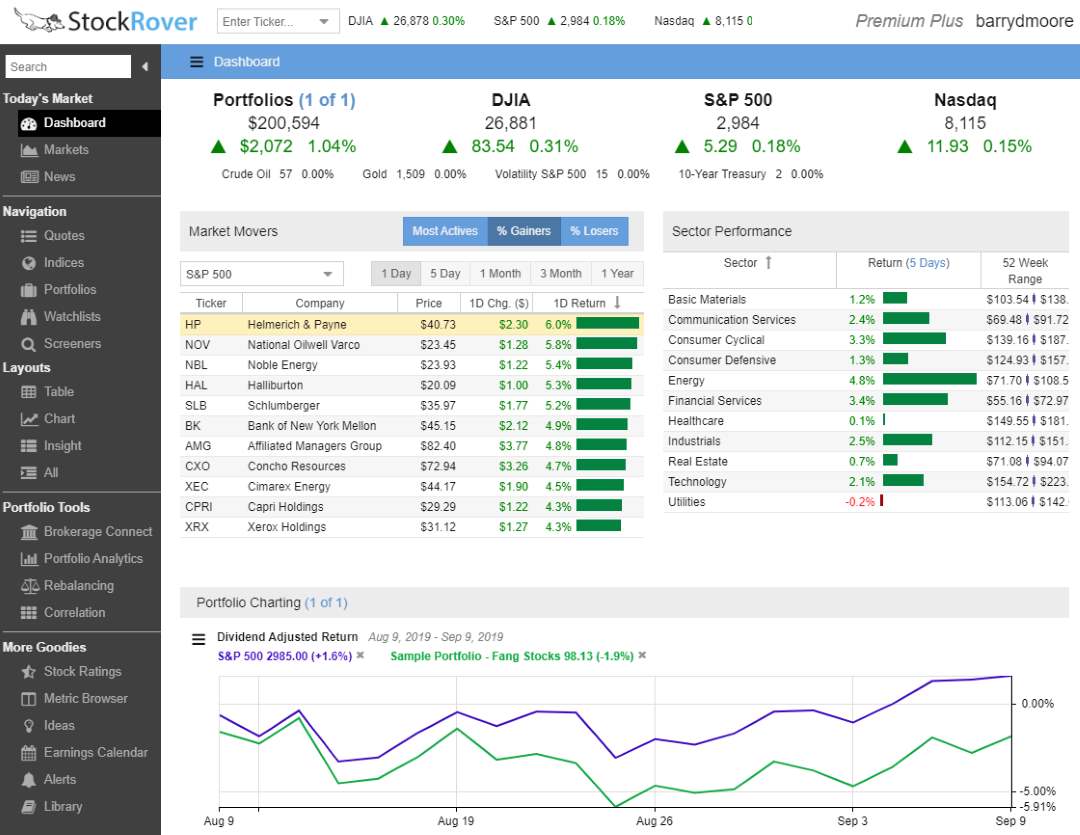
Stock Rover runs on PCs, Macs, Tablets, and Smartphones and requires zero installation; it simply works. The market data, scoring, ranking, and analysis are for the USA & Canadian markets only. When you register with Stock Rover and log in, you are greeted with the dashboard, which gives you an instant market performance breakdown and shows you your portfolio and dividend performance.
Stock Rover Download
Stock Rover is a modern cloud-based architecture with no client software to download and install. All the stock exchange data resides on the vendor’s servers in the cloud. The charting and visualization are also stored and computed in the cloud; any chart you want to visualize is streamed to your client’s device.
Mobile App
Currently, a mobile-friendly Stock Rover app is accessible via a special link: https://www.stockrover.com/mobile. However, to have full power on Stock Rover, you should use a PC, Mac, or tablet.
Stock Rover has the best implementation of stock screening on a cloud-based architecture on the market.
Chart Analysis Depth Index
Stock Rover scores rating [v=”4.50″ show=”tier”] 4.50, well above the median 3.50. This is not a day-trader charting terminal, but it’s more than sufficient for investors who want price context alongside fundamentals.
| Metric | Calculation | Stock Rover | High | Median | Low |
|---|---|---|---|---|---|
| Chart Analysis Depth Index | Avg of Chart Types, Indicator Depth, Custom Coding | 4.50 | 5.00 | 3.50 | 2.00 |
| Chart Types Total Count | Total number of chart types. 0.2 per chart type | 10 | 22 | 12 | 0 |
| Chart Types Depth | 22 chart types = 5 points. 0.2 point per chart type | 2.00 | 5.00 | 3.00 | 0.00 |
| Indicators Total Count | Total number of indicators. 0.001 points per indicator | 300 | 700 | 228 | 0 |
| Indicator Depth | 700 indicators = 5 points. 0.2 point per chart type | 2.00 | 5.00 | 2.00 | 0.00 |
| Custom Indicator Coding | Exists 5 Points | 0.00 | 5.00 | 5.00 | 0.00 |
| Chart Analysis Depth Index Test Winners | TradingView 5.00 | MetaStock 5.00 | Optuma 5.00 |
In my audit notes, I highlight what Stock Rover excels at: fundamental ratios and comparisons (with a large set of fundamental indicators). The tradeoff is that you cannot code custom indicators.
The real advantage is how charts connect to fundamentals: you can validate whether price action matches underlying quality and valuation changes. If you need advanced custom studies and pattern tooling, pair it with a charting-native platform.
When it comes to stock charts, Stock Rover differs from all the other software vendors on the market. Whereas MetaStock and TradingView focus on hundreds of technical analysis (price/volume) indicators, Stock Rover focuses on charting the fundamental financial strength indicators.
Stock Rover excels at fundamental charting with over 240 financial and 16 technical analysis indicators. It is not the best technical analysis or frequent trading service, but it is the complete package for fundamental income, growth, and value investors. Currently, Stock Rover does not allow you to draw trendlines or annotate charts, but this functionality is coming soon.
Stock Rover alerts are configurable to provide instant SMS or email notifications when a stock meets your custom criteria. For example, “Alert me if Netflix crosses over $200.” You can place alerts on fundamental indicators or prices; it is quite flexible.
Scanning Performance
Stock Rover posts an elite AAA 5.00 vs a 4.50 median. This is a core strength: fast, deep filtering and a large set of criteria—ideal for systematic investors.
| Metric | Calculation | Stock Rover | High | Median | Low |
|---|---|---|---|---|---|
| Market Scanning Latency & Depth | Avg of Scanner Speed Points, Criteria Depth, and Custom Coding | 5.00 | 5.00 | 4.50 | 3.00 |
| Scanner Performance (ms) | Milliseconds to search the entire S&P 500 across 5 different criteria. | 131 | 2000 | 194 | 36 |
| Scanning Speed (ms) | <100ms 5 points, <200ms 4.5 points, <500ms 4 points, <1000ms 3 points, <2000ms 2 points | 4.50 | 5.00 | 4.50 | 2.00 |
| Scanning Criteria & Depth | Total Criteria Count | 675 | 675 | 257 | 30 |
| Scanning Criteria | Scanning Criteria 0.0125 points per criteria | 0.00 | 5.00 | 3.21 | 0.38 |
| Custom Code Scanning | Exists 5 Points | 5.00 | 5.00 | 5.00 | 0.00 |
| Scanning Performance Test Winners | Stock Rover 5.00 | TradingView 4.83 | TrendSpider 4.67 |
The big caveat is the Auto-Refresh Rate row: it’s not scored, and “0” should be read as “not part of the test” rather than “instant refresh.” Practically: Stock Rover is outstanding for research screening, not necessarily for intraday scanning.
If you require intraday auto-refresh scanning for momentum entries, use a trader scanner; for fundamentals-based universes, Stock Rover is exactly the right tool.
The Stock Rover screener allows for rapid filtering of 10,000 stocks and 44,000 ETFs to help you find investments that match your exact criteria. Stock Rover also has ranked screening, which enables you to rank the stocks that best match your criteria and filter a list of hundreds of stocks to a handful.
The list of fundamentals you can scan and filter on is genuinely huge. Any idea you have based on fundamentals will be covered with over 650 data points, scoring systems for stocks, and 96 criteria for ETFs.
Pre-Built Screeners
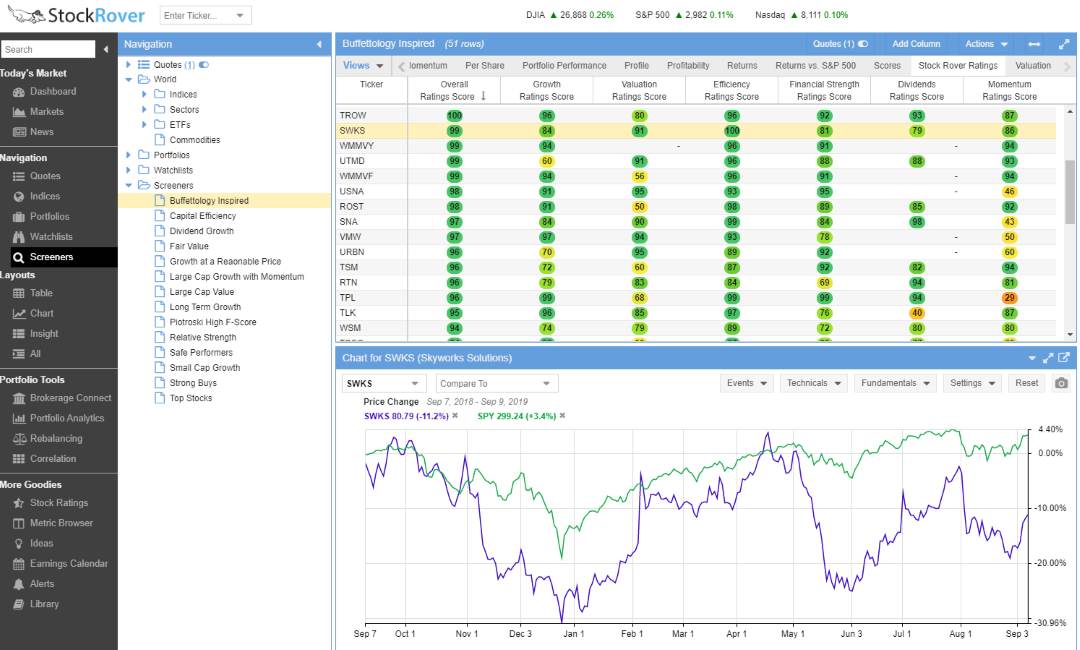
Stock Rover has over 150 pre-built screeners that you can import and use. You need to have the Premium Plus service to take advantage of this. I have personally reviewed many of them, and they are very thoughtfully built. One of my favorites is the Buffettology screener.
Buffettology Screener
Unique to Stock Rover is the ability to screen stocks on their performance relative to the S&P 500. You could develop a strategy to select stocks based on their historical performance versus the benchmark.
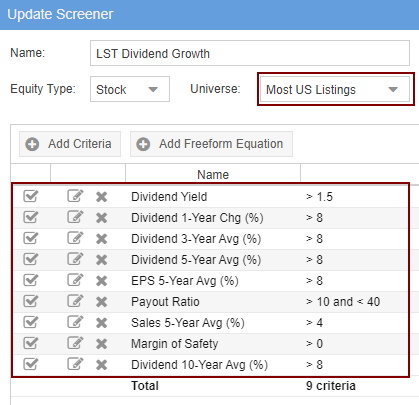
Building your Stock Rover screener is easy: select Create Screener, give it a name, select the equity type, choose your universe of large, medium, or small-cap stocks, and then add your criteria. No programming skills are required.
Watchlists have fundamentals broken into Analyst Estimates, Valuation, Dividends, Margin, Profitability, Overall Score, and Stock Rover Ratings. You can even set the watchlist and filters to refresh every single minute if you wish.
With a screening and research tool, the critical magic ingredient is the database, and boy, is this an enormous database. There are over 650 selectable metrics, and 228 contain ten years of historical data. That historical data can be selected as Trailing Twelve Months (TTM) or historic calendar year data.
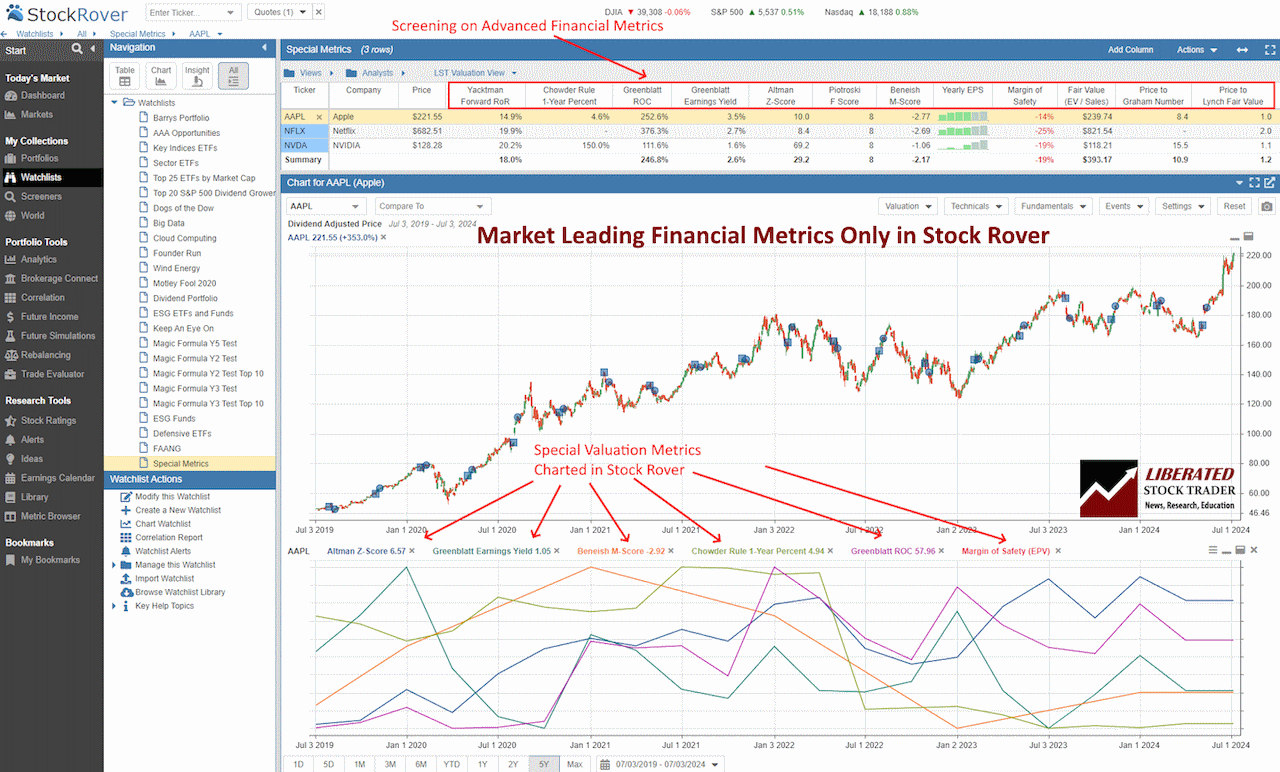
Some of my very favorite ratios and calculations are:
- Margin of Safety / Fair Value
- Greenblatt Earnings Yield and ROC
- Return vs. S&P500
- Piotroski and Altman-Z scores
- The Stock Rover Growth and Value Scores.
Backtesting Performance
Stock Rover lands at 4.00, matching the 4.00 median. It shows strong speed and flexibility, but weaker reporting depth in this benchmark—so it’s better for “quick validation” than for institutional-grade analytics.
| Metric | Calculation | Stock Rover | High | Median | Low |
|---|---|---|---|---|---|
| Quantitative Backtesting Fidelity | Avg. speed, flexible coding, report quality, multi-asset, no-code req. | 4.00 | 5.00 | 4.00 | 1.50 |
| Backtesting Speed (ms) | Time required to run a strategy simulation over 10 years | 103 | 2422 | 204 | 103 |
| Backtesting Speed (ms) Points | <200ms 5 points, <400ms 4.5 points, <600ms 4 points, <1000ms 3 points, <2000ms 2 points | 5.00 | 5.00 | 4.50 | 2.00 |
| No Coding Required | Exists | 5.00 | 5.00 | 1.00 | 0.00 |
| Flexible Coding | 5 for full custom coding, 3 for rules-based logic only, 1 for fixed template testing | 5.00 | 5.00 | 5.00 | 1.00 |
| Backtesting Report Quality | Advanced metrics and reports. 1-100%. | 15 | 100 | 50 | 0 |
| Backtesting Report Quality Points | 20% = 1 point, 40% = 2 points, 60% = 3 points, 80% = 4 points, 100% = 5 points | 0.00 | 5.00 | 2.50 | 0.00 |
| Multi-Stock Basket Backtesting | 5 for basket backtesting, 0 for single stock only | 5.00 | 5.00 | 5.00 | 0.00 |
| Backtesting Performance Test Winners | Optuma 4.94 | TrendSpider 4.88 | MetaStock 4.81 |
The headline: fast backtests and strong flexibility, but thin reporting in this rubric. If you need deep stats (distribution, regime splits, robustness), you’ll likely pair Stock Rover with a dedicated backtesting engine.
The limitation is reporting depth: if you’re doing serious strategy research, you want more diagnostics than a simple equity curve. For most investors, fast + flexible is enough to avoid bad ideas before real money is at risk.
The ability to backtest using a fundamental screener is advantageous. It can help you prove that your stock selection methodology has worked in the past, as you hope it will work in the future.
Stock Rover provides ten years of backdated financial information and scanning possibilities, better than nearly every other stock screening package. What is unique is that you can backtest screening results. Using Stock Rover, I developed my Beat the Market Screener, which focuses on growth and financial stability, and I could backtest the strategy for the previous seven years.
The Liberated Stock Trader Beat the Market Screener seeks to select stocks with a significant chance of beating the S&P500 returns. The screener uses growth in free cash flow and explosive EPS growth. Combining this with Joel Greenblatt’s ROC and Earnings Yield formulas, “the Magic Formula,” we have a selection of stocks that have significantly beaten the market 5 out of the last 7 years.
Trading Bot & Auto-Trading Reliability
Stock Rover scores 2.50, above the median 1.50, but this is still not an automation platform. It supports alerting and monitoring, not broker-connected, resilient execution.
| Metric | Calculation | Stock Rover | High | Median | Low |
|---|---|---|---|---|---|
| Automated Execution & Bot Reliability | Avg of Execution Path, Strategy Sophistication and Operational Assurance | 2.50 | 5.00 | 1.50 | 0.00 |
| Automation Path | 1 = alerts only, 3 = webhook/API to broker, 5 = native bot/trading execution | 1.00 | 5.00 | 1.00 | 0.00 |
| Strategy/Bot Sophistication | Avg sophistication rating | 1.50 | 5.00 | 2.00 | 0.00 |
| Operational Assurance | (SLA + monitoring + failover documentation). 5 = strong, 0 = none | 0.00 | 5.00 | 0.00 | 0.00 |
| Bot & Auto-Trading Reliability Test Winners | TrendSpider 4.50 | Trade Ideas 4.00 | Tickeron 4.00 |
In my audit notes: Stock Rover provides email/SMS alerts but no broker execution, webhooks, or SLA documentation. That’s fine for investors; it’s a hard “no” for hands-off automated trading.
If you want fully automated execution, you need broker connectivity, clear failure modes, and operational controls. Stock Rover instead excels at ongoing monitoring—flagging thesis breaks (fundamentals, risk, valuation) so you can decide. Pair it with a broker or bot tool if automation is the goal.
AI & Algo Index
Stock Rover hits 2.50, slightly above the median 2.00. The story is: real algorithmic structure (factor models and rules), strong transparency, but no AI layer.
| Metric | Calculation | Stock Rover | High | Median | Low |
|---|---|---|---|---|---|
| Algorithmic Intelligence & AI Tier Index | Sum of Algo Depth, AI Layer & Transparency Points | 2.50 | 5.00 | 2.00 | 1.00 |
| Algo Depth | 0.5 = Screeners/alerts only; 1.0 = Rules-based logic; 1.5 = Backtesting+factor models; 2.0 = advanced quant platform | 1.50 | 2.00 | 1.50 | 1.00 |
| AI Layer | 0 = none; 1 = assistive AI; 1.5 = ML signals core feature; 2 = AI-native decisioning | 0.00 | 2.00 | 0.00 | 0.00 |
| Transparency | 0 = black box; 0.5 = partial; 1 = clear methodology + validation artifacts | 1.00 | 1.00 | 1.00 | 0.00 |
| AI & Algo Index Test Winners | TrendSpider 5.00 | Trade Ideas 4.50 | Tickeron 4.50 |
If you want explainable, repeatable screening logic, this is a positive profile. If you want ML forecasts or agentic “AI picks,” Stock Rover isn’t trying to be that—and the score reflects it.
In Context: “AI” is often marketing. What investors need is clear rules, consistent rankings, and transparency into why a stock qualifies. Stock Rover’s algorithmic value is a factor-based structure—screening and rating logic that you can understand and iterate on. That reduces decision noise and helps you avoid style drift.
Research Reports
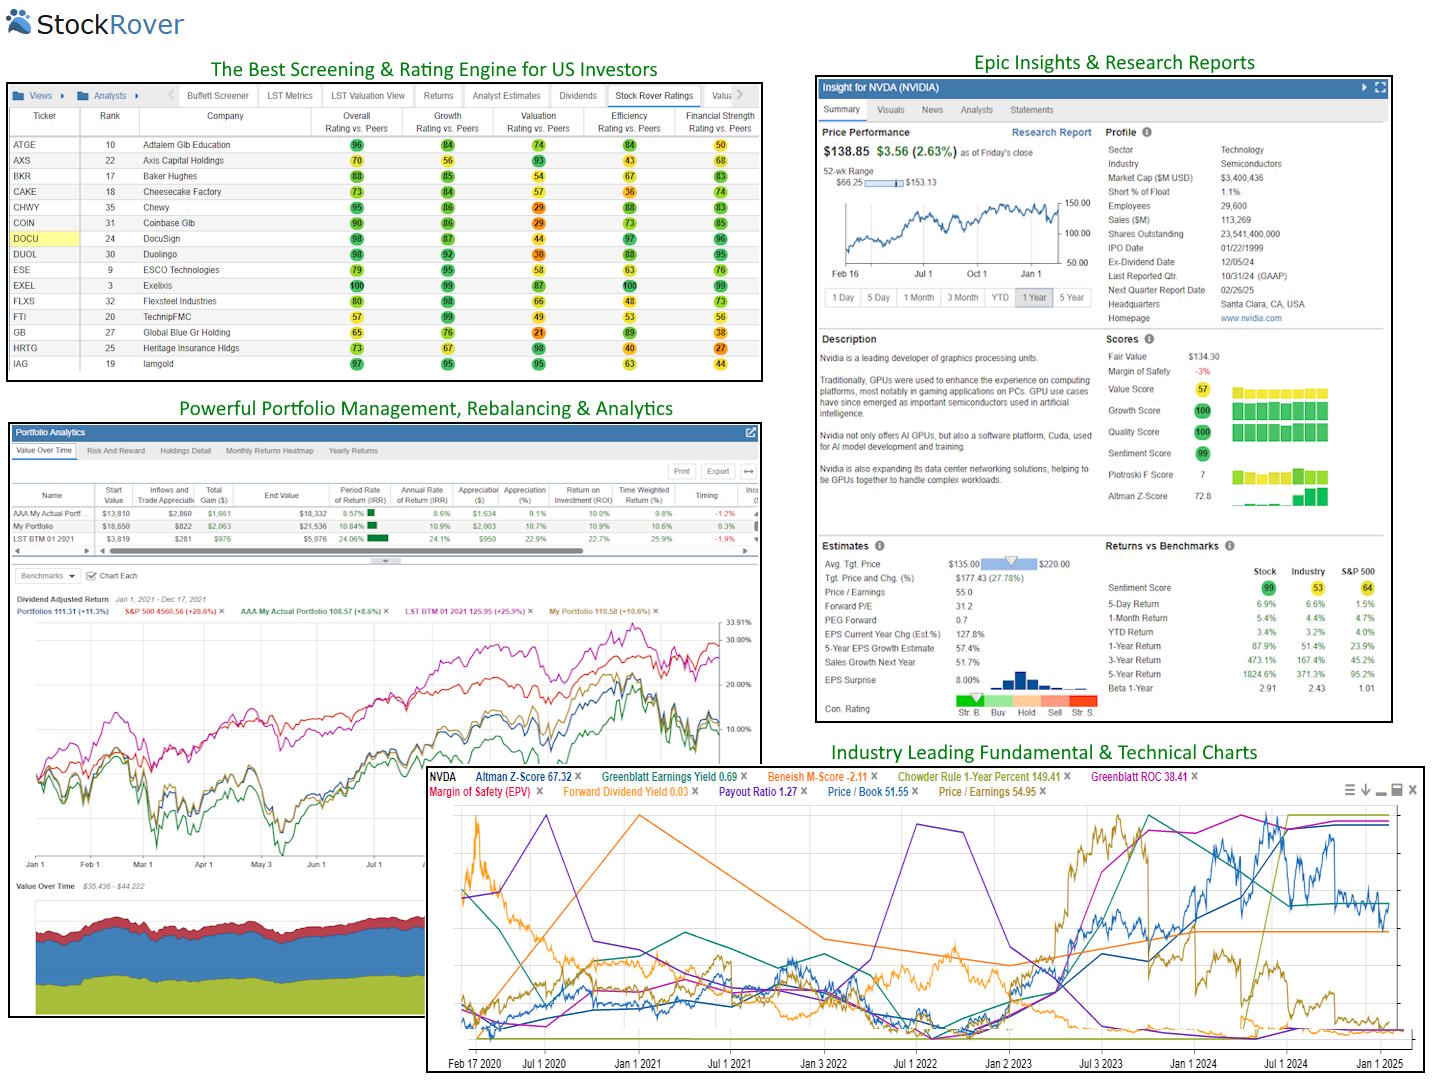
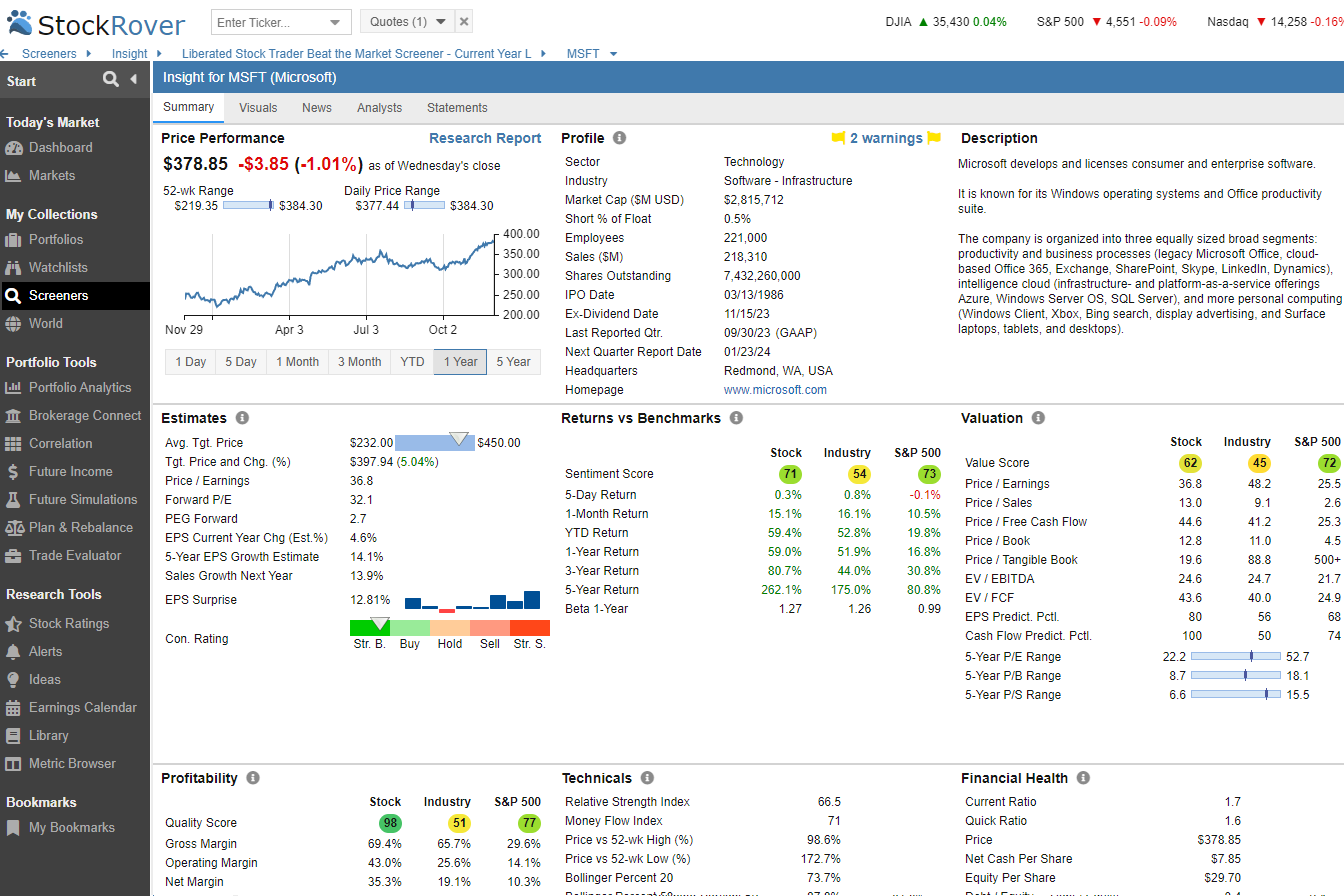
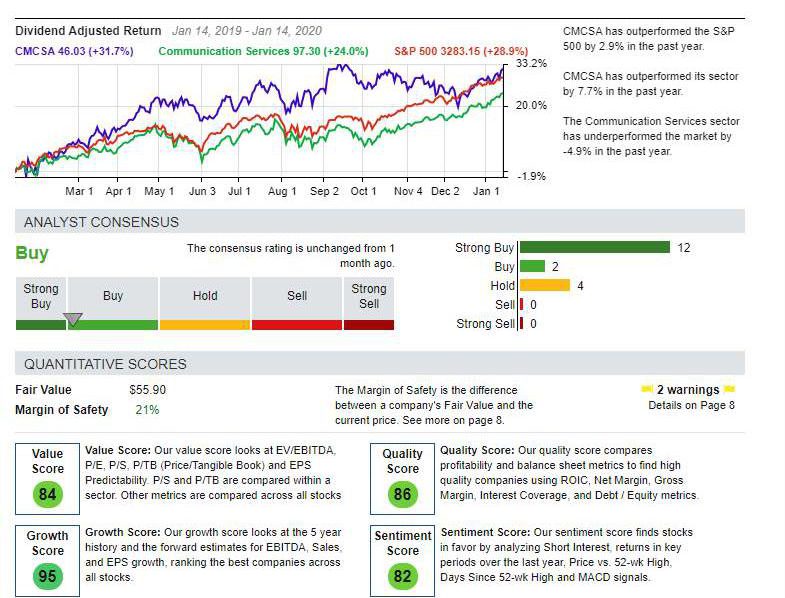
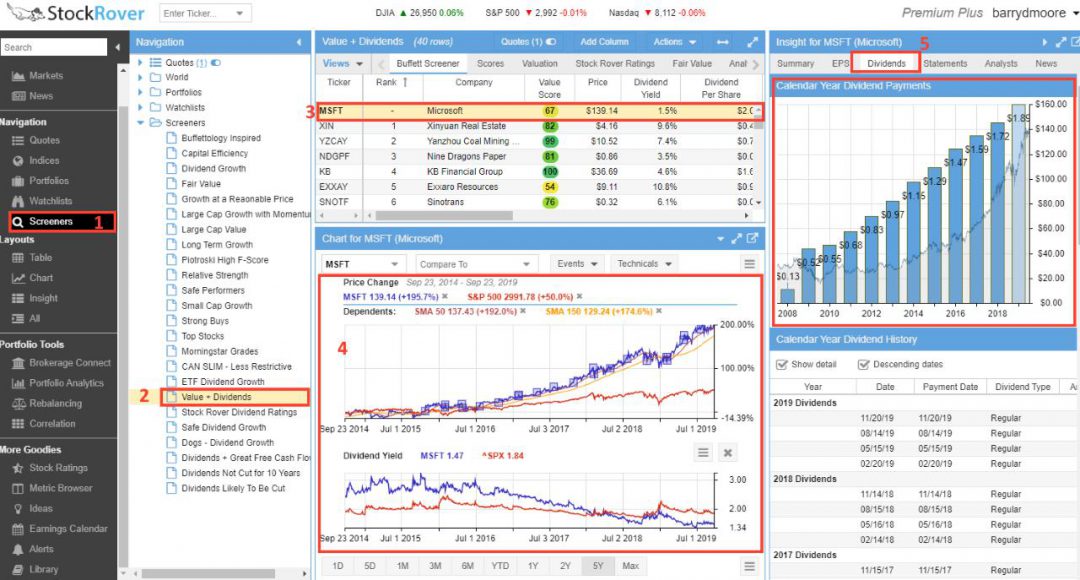
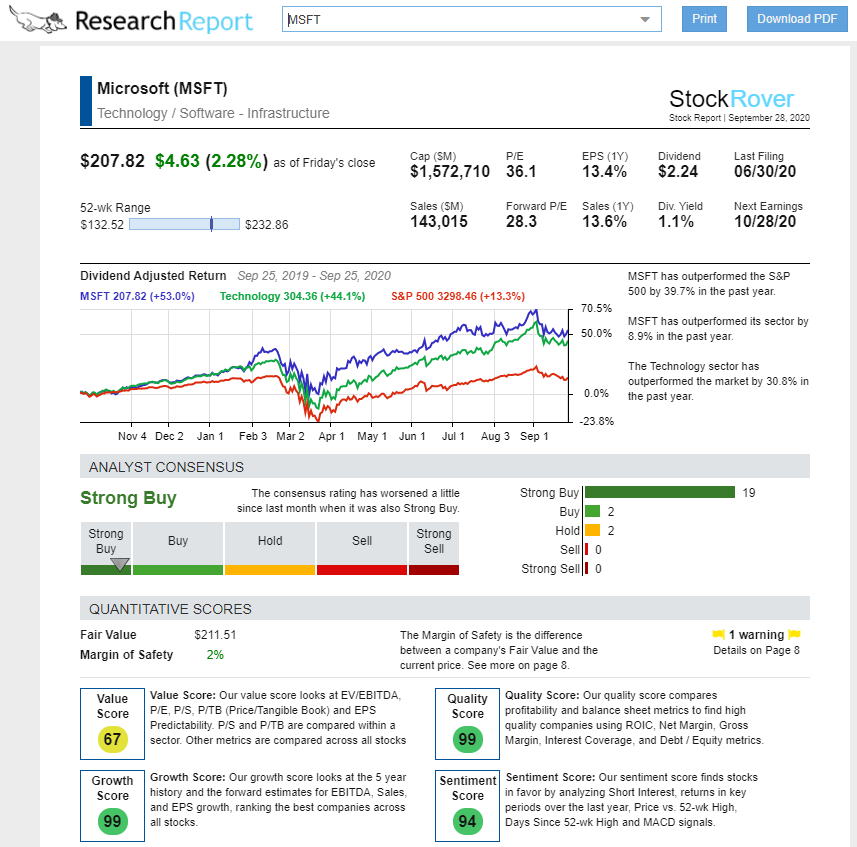
The Stock Rover Research Reports enable you to generate a professional, readable PDF report on any particular stock’s current and historical performance. The reports are unique as they are real-time research reports. They are generated with the latest data, highlighting a company’s competitive position, market position, and historical and potential dividend and value returns. The image below shows the dividend-adjusted commentary on Microsoft.
Get Free Stock Rover Research Reports
The best thing about Stock Rover’s Research Reports is they are Real-time, so the information is always up-to-date.
The Research Reports provide a genuinely comprehensive summary of any of the 10,000+ stocks in Stock Rover on the US and Canadian exchanges. Research reports can be viewed in the browser and produced in PDF format for portability and sharing.
I am very visual, and I like that a large amount of the data is thoughtfully represented in charts and graphically appealing tables. The integrated Research Reports functionality takes the visualization to the next level. With the visual representations of data, you can absorb and understand a lot of data exceptionally quickly, saving you time and effort. When you have Stock Rover, scanning a company’s quarterly financial reports is a thing of the past.
Alert Speed
Stock Rover posts 2.67, above the median 1.50, but this category is nuanced: it supports many alerts, but it’s not designed for low-latency trading triggers.
| Metric | Calculation | Stock Rover | High | Median | Low |
|---|---|---|---|---|---|
| Alert Trigger Latency & Delivery Speed | Avg of concurrent alerts, alert streams richness & alert speed rating | 2.67 | 5.00 | 1.50 | 0.00 |
| Concurrent Alerts | How many concurrent alerts (1 point per 50, to a max of 5 points) | 5.00 | 5.00 | 1.00 | 0.00 |
| Concurrent Alert Count | Total number of concurrent alerts | Unlimited | Unlimited | 75 | 0 |
| Alert Streams Richness | Multi-channel streams (email, webhook, sms, app alert). 1 point per stream, max 5 points. | 2.00 | 5.00 | 2.00 | 0.00 |
| Alert Speed Rating | User tested alert latency timing (0-5) | 1.00 | 5.00 | 0.00 | 0.00 |
| Alert Speed Test Winners | TradingView 4.67 | TrendSpider 4.33 | Benzinga Pro 4.33 |
In my audit notes: alerts exist (email/text), but there’s no clear latency disclosure. Practically, treat Stock Rover alerts as investor notifications—not scalper-grade execution signals.
Stock Rover’s alert profile fits monitoring: watchlists, thesis-break triggers, and scheduled review. If your strategy relies on intraday timing, choose a trading-native alert engine; if your strategy requires discipline over months, Stock Rover alerts are usually sufficient.
Trade Signal Quality
Stock Rover scores 2.50 vs a median of 0.00. The key interpretation: Stock Rover can guide decisions through rankings and factor signals, but it’s not a “buy/sell call” machine.
| Metric | Calculation | Stock Rover | High | Median | Low |
|---|---|---|---|---|---|
| Signal Alpha & Predictive Efficacy | Avg of Signal Quality and Recommendations | 2.50 | 5.00 | 0.00 | 0.00 |
| Trade Signal Quality Test Winners | Trade Ideas 5.00 | Seeking Alpha 5.00 | Tickeron 5.00 | Motley Fool 5.00 |
If you want trade signals with predictive claims, look elsewhere. If you want structured decision support (quality/valuation filters that reduce mistakes), this is a meaningful “signal” category score.
In Context: “Signals” can mean two very different things: (1) short-term trading calls, or (2) systematic evidence that improves long-term decision quality. Stock Rover is the second type. Its value comes from reducing errors, buying low-quality companies, overpaying, ignoring concentration risk, or missing dividend sustainability issues. Those are the mistakes that quietly destroy compounding. If you’re looking for “enter now, exit now” signals, you’ll be disappointed. If you want signals that keep your process honest, Stock Rover is a good fit.
Stock Ratings
Stock Rover provides a rating engine that meticulously ranks stocks based on important metrics like growth, valuation, financial strength, dividends, and momentum. These ratings enable you to develop strategies to find stocks with strong financials, cash flow, and efficiency, greatly simplifying strategy development.
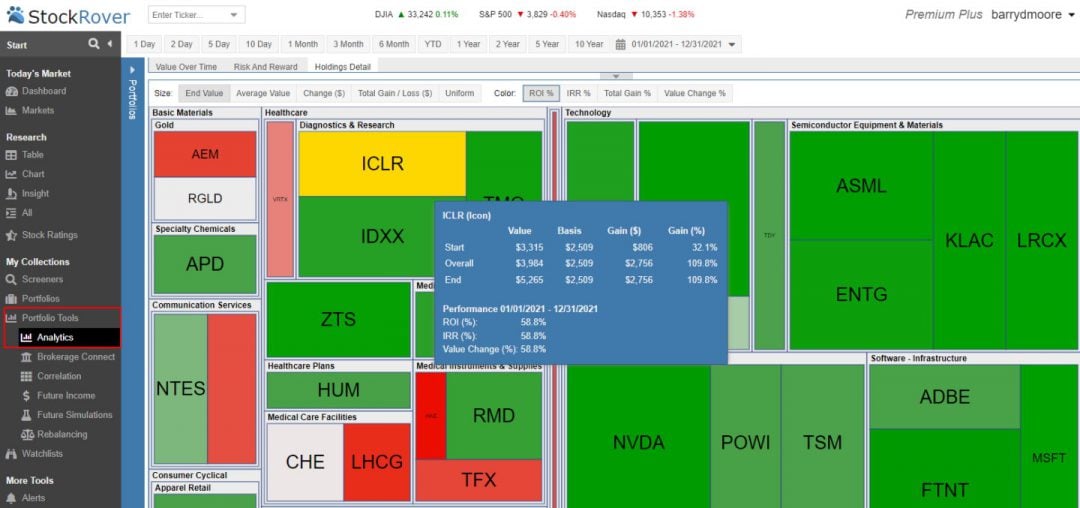
I particularly like the roll-up view for all the scores and ratings. In the screenshot below, I have imported the Warren Buffett portfolio, which includes his top 25 holdings. I have also selected the “Stock Rover Ratings” tab, which rolls up all analyses into a simple-to-view ranking system, saving tremendous time and effort while providing a wealth of insight.
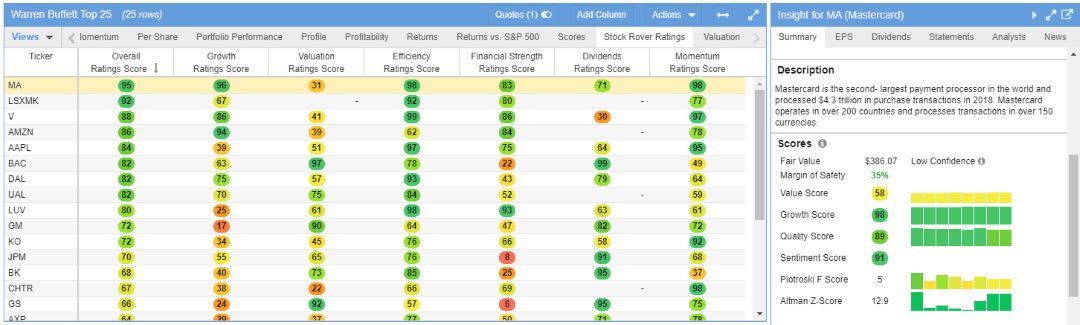
In the screenshot above, Stock Rover scores stocks on growth, valuation, efficiency, financial strength, dividends, and momentum. It also has overall ratings that place stocks in the top 20% of all rankings, making finding good investments easy.
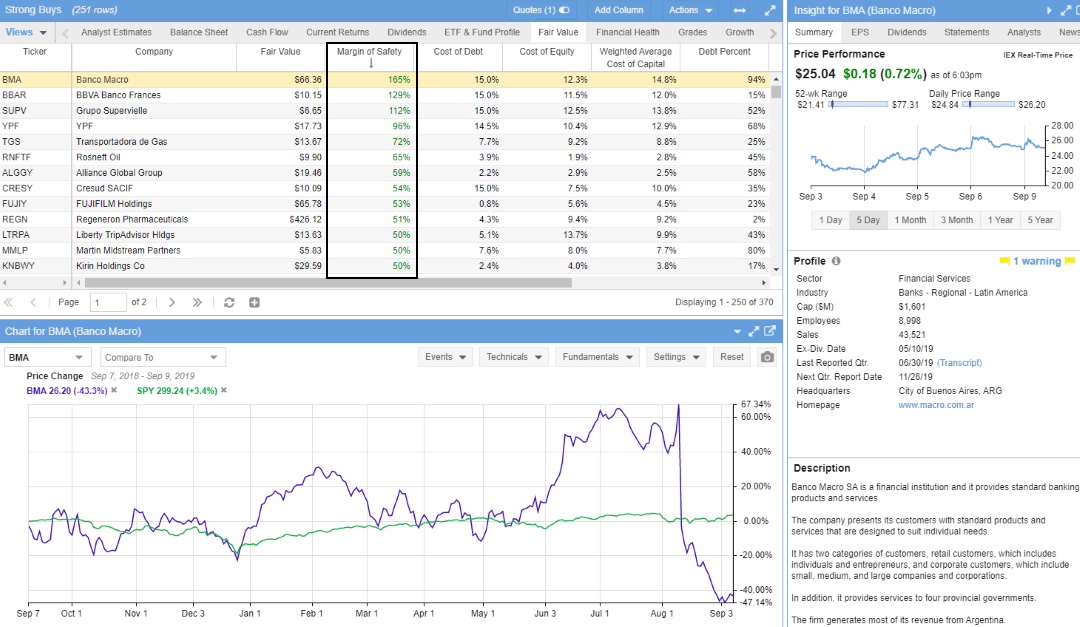
Fair Value & Margin of Safety Rankings
One of Stock Rover’s killer features is the ability to view any watchlist, portfolio, or screener results using the Fair Value view. Fair Value enables value investors to assess whether the stocks in a portfolio are undervalued or overpriced compared to their forward discounted cash flow; this is a dream feature for value investors.
The Fair Value and Margin of Safety analysis and rankings are a nightmare to calculate, but they more than justify the price of the Stock Rover Premium plan.
[Related Tutorial: Setup Your Own Warren Buffett Stock Screener With Stock Rover]
Broker Connectivity & Ecosystem Depth
This is a weak category for Stock Rover: 2.25 vs the median 4.50. The reason is simple: Stock Rover is not a live execution platform.
| Metric | Calculation | Stock Rover | High | Median | Low |
|---|---|---|---|---|---|
| Asset & Data Coverage Index | Avg of broker integration, asset & data coverage, and live trading | 2.25 | 5.00 | 4.50 | 0.00 |
| Live Trading | Total number of brokers supported for direct, live trade execution. | N/A | 5.00 | 5.00 | 0.00 |
| Total number of brokers integrated | Total number of brokers supported for direct, live trade execution. | 100 | 100 | 50 | 0 |
| Broker Integration Points | 0.5 points for each broker. 100 = 5 points | 2.50 | 5.00 | 2.50 | 0.00 |
| Asset & Data Coverage Points | Stocks, Options, FX, USA Exchanges, International Exchanges. 1 point each | 1.00 | 4.00 | 4.00 | 0.00 |
| Broker Connectivity & Ecosystem Test Winners | TradingView 5.00 | MetaTrader 5.00 | TrendSpider 4.43 |
Interpretation: great for account connectivity/tracking, not for execution and multi-asset coverage. If you trade options/FX/crypto directly inside your platform, this won’t be your hub.
In Context: Ecosystem depth matters when you want one place to research, execute, and manage orders. Stock Rover’s ecosystem strength is “portfolio visibility,” not trading infrastructure. Many investors don’t need in-platform execution—they use their broker directly and want a better research layer on top. That’s a valid setup: Stock Rover becomes the decision engine, the broker becomes the execution engine.
Portfolio Tool Performance
This is Stock Rover’s signature win: AAA 4.80 vs the median 2.80, tying for best-in-class with Portfolio123 in this dataset.
| Metric | Calculation | Stock Rover | High | Median | Low |
|---|---|---|---|---|---|
| Portfolio Health & Risk Analytics | Health Check & Reporting Depth % of “Critical Financial Metrics” covered | 4.80 | 4.80 | 2.80 | 2.00 |
| Portfolio Tool Performance Test Winners | Stock Rover 4.80 | Portfolio 123 4.80 | Seeking Alpha 4.30 |
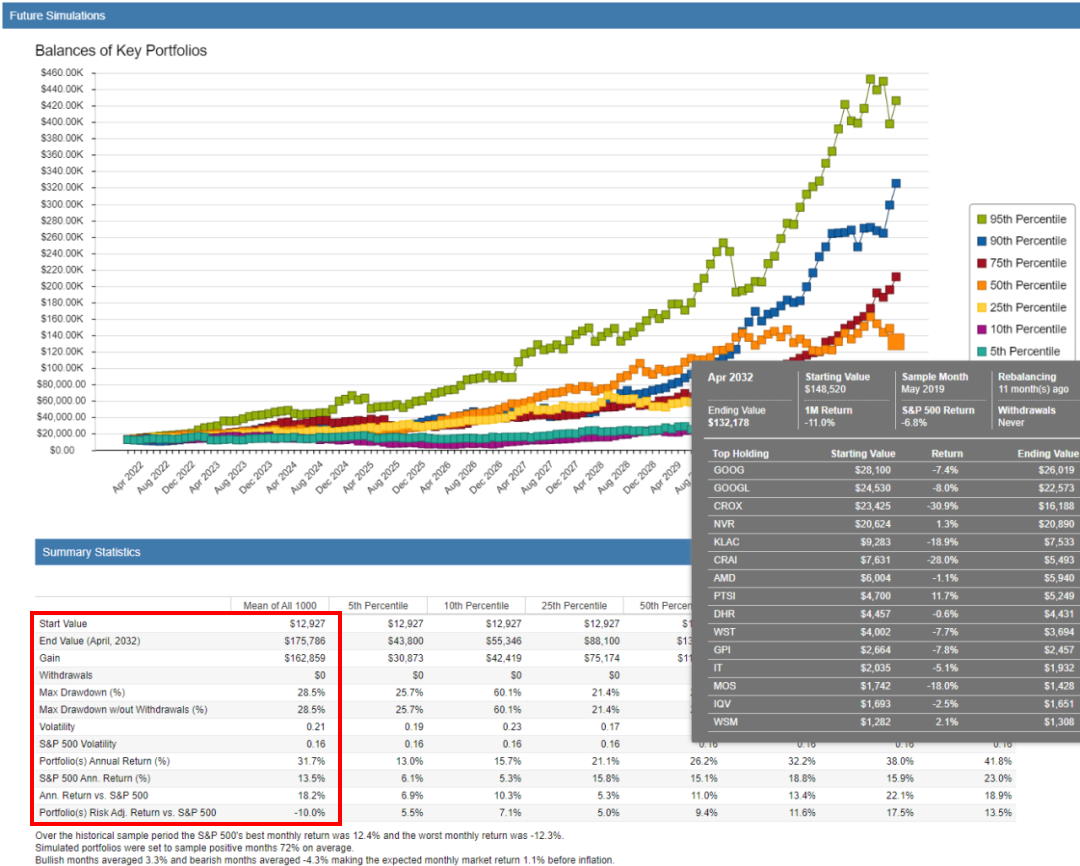
In my audit notes, I highlighted the real-world “portfolio operator” features: emailed performance reports, correlation tools, dividend projections, rebalancing, and Monte Carlo simulation. That’s the difference between owning stocks and running a portfolio.
In Context: Portfolio analytics is where investors quietly win: better diversification, fewer hidden concentration risks, and a clearer understanding of what actually drives returns (factors, sectors, macro exposure). Stock Rover’s strength is making these insights usable without requiring a quant background.
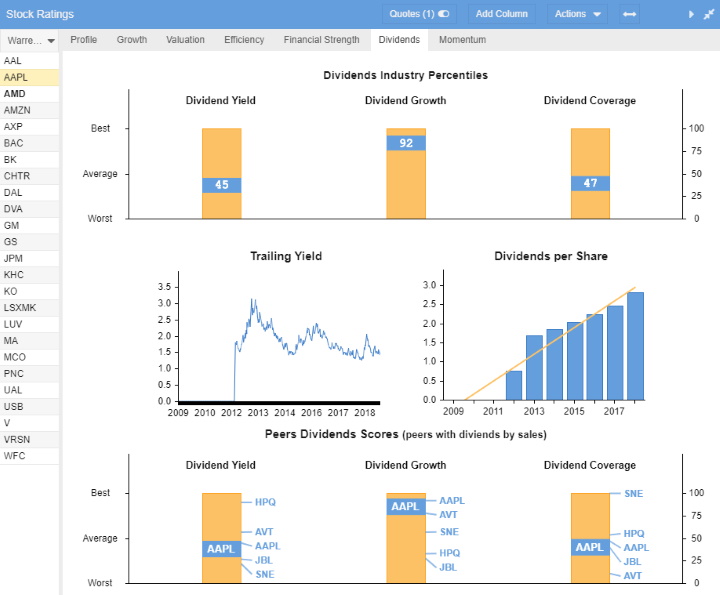
Dividend Income Analysis
Stock Rover provides dividend analysis to visualize a stock’s dividend yield, growth, and coverage versus its competitors. It analyzes any portfolio or watchlist to predict future dividend income based on current and future estimated dividends, making it ideal for income investors.
As all smart investors know, you need to accrue your dividends to have a chance at excellent market-beating returns. Stock Rover provides intelligent analysis to enable you to do just that.
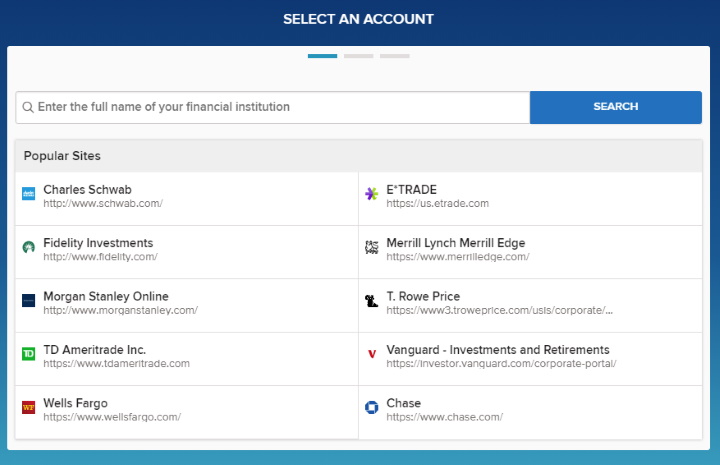
With Stock Rover, you get broker integration with practically every major broker, including Firstrade, Schwab, and Interactive Brokers. You cannot place trades from charts, but it will cover your portfolio’s profit and loss reporting and provide portfolio rebalancing recommendations.
Stock Rover is a unique package that includes dividend reporting and scoring. It is not for day traders but for longer-term investors who want to maximize their portfolio income and take advantage of compounding and a margin of safety to manage a safe and secure portfolio.
Finally, I really like portfolio analytics, which enables you to compare your portfolio returns for a given period. You can also see the portfolio correlation to the S&P500, the risk-adjusted return, and the Sharpe ratio.
| Stock Rover Portfolio Features | Stock Rover |
| Watchlist Tracking | ✔ |
| Research & News | ✔ |
| Profit & Loss Reporting | ✔ |
| Performance Reporting | ✔ |
| Portfolio Rebalancing | ✔ |
| Portfolio Asset Allocation | ✔ |
| Broker Integration | ✔ |
| Future Dividend Reporting | ✔ |
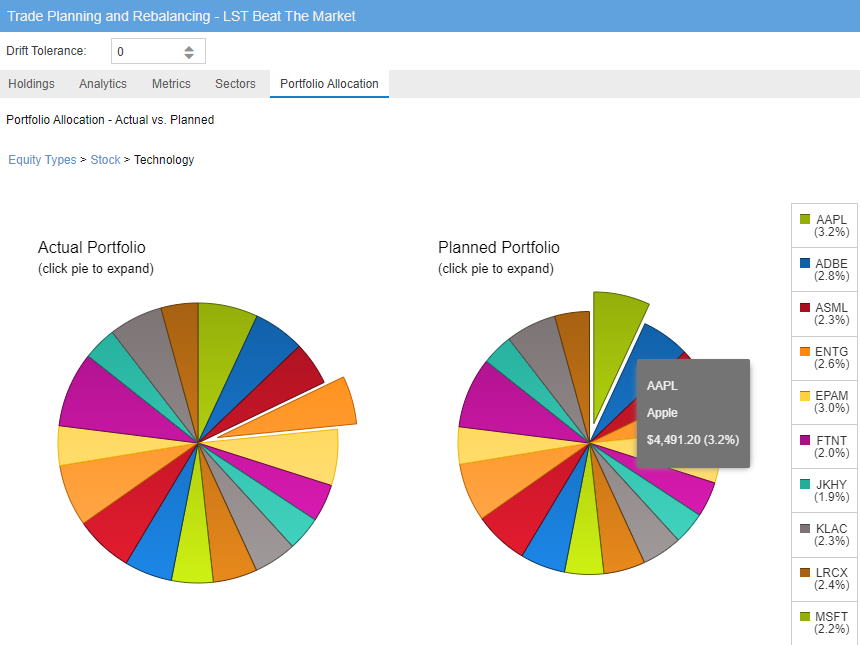
One of Stock Rover’s standout features is the ability to view your existing and future asset allocation based on your weighting and distribution parameters.
Financial News Speed & Depth
Stock Rover scores 2.00, slightly below the median 2.30. It’s not a news terminal, and it shouldn’t be judged like one.
| Metric | Calculation | Stock Rover | High | Median | Low |
|---|---|---|---|---|---|
| Financial News Speed & Quality Rating | Avg of News Speed Rating and Depth of News & Summaries | 2.00 | 5.00 | 2.30 | 0.75 |
| Financial News Speed & Depth Test Winners | MetaStock 5.00 | Benzinga Pro 5.00 | Scanz 5.00 |
In my audit notes: “Not designed for news trading… best effort… for fundamentalists.” That’s the correct framing—use Stock Rover for research, not for racing headlines.
Stock Rover’s role is to help you understand what you own, why you own it, and what risks you’re taking. If you do need real-time news, pair Stock Rover with a dedicated news service. You’ll get better results than expecting a single platform to be both a research lab and a newswire terminal.
Stock Rover consolidates news from over 20 news sources, including Forbes, MarketWatch, and The Wall Street Journal, providing a time-saving way to view events that may impact your stocks or the market. The news feeds are not real-time, but they are useful.
As a long-term investor, real-time news is not a priority. If real-time is your priority, you can subscribe to Benzinga Pro News separately. Finally, there is no social chat or community within Stock Rover.
Community Utility Index (CUI)
Stock Rover scores 2.75, below the median 4.00. This isn’t a “social charting” platform, so the lower community score is expected.
| Metric | Calculation | Stock Rover | High | Median | Low |
|---|---|---|---|---|---|
| Community Utility Index | Avg of Active Community Size, Quality, and Community Features | 2.75 | 5.00 | 4.00 | 2.00 |
| Active Community Size | Millions of active users 5. 1000 active users = 0 | 2.50 | 5.00 | 4.00 | 0.00 |
| Community Content Quality | Assessed 0 to 5 | 3.00 | 5.00 | 4.00 | 1.00 |
| Community Features | Social trade idea sharing, private chat, and sharing indicators/scripts. 0-5 | 2.75 | 5.00 | 4.00 | 1.00 |
| Community Utility Index Test Winners | TradingView 5.00 | MetaTrader 5.00 | Trade Ideas 4.75 |
For many investors, this isn’t a negative. In fact, fewer “hot takes” can be a feature, not a bug—especially if your edge is process discipline.
Stock Rover is positioned as a research workstation: you bring your thesis, and it gives you tools to validate it. If you want idea flow and social confirmation, you’ll get more from TradingView-style ecosystems.
If you want less distraction and more evidence, a smaller community footprint may actually improve decision hygiene. Choose based on how you personally make decisions—social reinforcement vs independent research.
Support Infrastructure & SLA Audit
Stock Rover is exactly median here at 3.50. That’s “solid support” rather than elite, and for most investors, that’s acceptable—especially if documentation is strong.
| Metric | Calculation | Stock Rover | High | Median | Low |
|---|---|---|---|---|---|
| Support SLA Audit: Time-to-Human Benchmarks | Average of Support Communication Channels & Support Response Time Scores | 3.50 | 5.00 | 3.50 | 1.00 |
| Support Communication Channels | Communication Channels (The “Access” Scale) | 3.00 | 5.00 | 3.00 | 1.00 |
| Support Response Times | Response Times (The “SLA” Scale) | 4.00 | 5.00 | 3.50 | 1.00 |
| Stated SLA & Tested Outcomes | ~2-4 Hours | – | – | – |
| Support Infrastructure & SLA Audit Winners | TrendSpider 5.00 | TC2000 5.00 | ThinkorSwim 4.75 |
In my audit notes: “Methodical email-first support supported by elite-level documentation…” This is usually what you want for a serious research tool—reliable answers, not hype.
Compare to Similar Products
| Features? | Stock Rover | TrendSpider | TradingView | Portfolio123 | MetaStock |
| Best for: | Investors | Traders | Traders | Investors | Traders |
| Free Plan | ✔ | ✘ | ✔ | ✔ | ✘ |
| Pricing? | $0 | $29 | $49 | $54 | $214 | $0 | $15 | $35 | $70 | $0 | $83 | $100 | $265 |
| Financial Screening? | ✔ | ✔ | ✔ | ✔ | ✔ |
| 10-Year Financials | ✔ | ✘ | ✘ | ✔ | ✘ |
| Portfolio Management? | ✔ | ✘ | ✘ | ✔ | ✘ |
| Research Reports | ✔ | ✘ | ✘ | ✘ | ✘ |
| Chart Pattern Scanning? | ✘ | ✔ | ✔ | ✘ | ✘ |
| AI Stock Screening? | ✘ | ✔ | ✘ | ✘ | ✔ |
| Financial News? | ✔ | ✔ | ✔ | ✘ | ✔ |
| Stocks & ETFs | ✔ | ✔ | ✔ | ✔ | ✔ |
| FX/Commodity | ✘ | ✔ | ✔ | ✘ | ✔ |
| USA & Canada | ✔ | ✔ | ✔ | ✔ | ✔ |
| Global Market Data | ✘ | ✘ | ✔ | ✘ | ✔ |
FAQ
Is Stock Rover real-time?
Yes, when stock screening, Stock Rover provides up-to-the-minute data in the scan results. However, the stock charts in Stock Rover are not real-time. Stock Rover is not designed as a tool for real-time trading but for medium and long-term investing.
Is Stock Rover good for value investing?
Yes, my testing shows that Stock Rover is the best screener and research tool for all value investing strategies. Stock Rover provides important criteria that all value investors need, with 7 Fair Value metrics, 6 Forward Cash Flow (FCF) calculations, and 4 Margin of Safety calculations.
Is Stock Rover free?
Yes, Stock Rover is free, and we rate it number one for free and paid stock screeners. For free, Stock Rover provides broker integration, portfolio reporting, screening, and analyst ratings.
Is Stock Rover good for growth investing?
Yes, Stock Rover is an excellent tool for long-term growth investing. In my testing, I developed the Liberated Stock Trader Beat the Market Growth Strategy, which beat the S&P 500 8 out of the last 10 years. Stock Rover’s 10-year historical financial information, combined with Greenblatt ratios, is the only screener that can enable this growth strategy.
Who are Stock Rover’s competitors?
Stock Rover’s competitors are TradingView, Finviz, Trade Ideas, and Portfolio 123. For US value, growth, and dividend stock screening, Stock Rover is the clear leader. But for AI day trading, Trade-Ideas is the best, and for international screening, charting, and community, TradingView is the better choice.
Does Stock Rover have an app?
Stock Rover does not have an app on the Apple or Google Play Store. The HTML 5 design of Stock Rover will detect your platform and automatically adjust to tablets of mobile. Additionally, I spoke with the head of business development at Stock Rover, and he said a dedicated mobile app is in development.
Is Stock Rover good for dividend investing?
My testing shows that Stock Rover is an industry leader in dividend investing strategies. Stock Rover has 22 unique dividend-related financial metrics that cover everything an income investor needs. Additionally, Stock Rover can predict your portfolio’s future dividend income, enabling you to adjust your investments to maximize dividends and minimize risk.
Is Stock Rover trustworthy?
Stock Rover is a legitimate and trustworthy company. As a partner, we have an exemplary business relationship. I have worked with the head of product development and the Stock Rover team to actively develop the product based on customer requests. I have also verified that their data comes from reputable sources like Zacks, Intrinio, and Quandl.
Is Stock Rover good for day traders?
No, Stock Rover is not good for day traders or swing traders. Stock Rover is for medium- to long-term investors who want to manage a stock portfolio and implement first-class investing strategies. My recommendation for day traders is Trade-Ideas for AI Auto Trading or TradingView for the world’s best stock charts and trading community.
Hi Allan, the trick is to select data from the historical database in a screener. Then plot the results on the chart and set the chart timeframes back to see the performance. For example use performance versus the S&P 500 for 2 calendar years ago. And set the chart timeframe for 1 year ago. Then you can see how the portfolio performed. More details here.
https://www.liberatedstocktrader.com/lst-beat-the-market-screener/
Hi there,
Love Stock Rover,but I don’t see how one can run backtests.Are you manually running them??
Thanks,
Allan