
TradingView is the better all-round platform for active traders because it offers stronger charting, global market coverage, backtesting, alerts, broker integration, Pine Script, and community tools. Finviz is better for traders and investors who mainly want fast, low-cost U.S. stock screening, heatmaps, fundamental filters, and simple market visualization.
In my independent 58-point lab test, TradingView scored 4.75 versus Finviz at 3.84. The key difference is breadth: TradingView is a complete analysis and trading platform, while Finviz is primarily a fast stock-screening and research tool.
Choose TradingView if you want advanced technical analysis, strategy development, automation, global markets, or broker-connected trading. Choose Finviz if your priority is rapidly finding U.S. stocks, reviewing heatmaps, and filtering companies using technical and fundamental criteria.
Finviz vs TradingView: Quick Comparison
TradingView and Finviz are both popular stock market tools. Still, TradingView wins our head-to-head testing due to its superior charting, pattern recognition, community, and global exchange data and asset coverage. Finviz is better for simplicity in its screening and heatmaps, and for its free plan.
| Feature | TradingView | Finviz |
|---|---|---|
| Overall lab score | 4.75 | 3.84 |
| Best for | Charting, global markets, strategy development & trading | U.S. stock screening, heatmaps & market research |
| Charting | Excellent | Basic |
| Stock screening | Excellent, broad market coverage | Excellent for U.S. stocks |
| Backtesting | Flexible via Pine Script | Point & Click but more limited |
| Alerts | Advanced and highly customizable | Basic stock and screener alerts |
| Broker integration | Extensive | None |
| Global markets | Stocks, ETFs, forex, crypto, and futures | Primarily U.S. equities |
| Community | Large active global community | None |
| Free plan | Yes | Yes |
| Paid pricing | $0 | $15 | $35 | $70 | $0 | $25 |
Who Should Choose Finviz vs TradingView?
TradingView and Finviz serve very different types of traders. TradingView offers the broadest selection of high-quality features for traders ranging from beginners to advanced traders. Finviz is a low-cost solution for novice and intermediate traders who value simplicity.
| Choose TradingView if you need | Choose Finviz if you need |
|---|---|
| Advanced charting | Fast U.S. stock screening |
| Global market coverage | Heatmaps and market visualization |
| Backtesting and Pine Script | Fundamental and technical filters |
| Advanced alerts | Simple stock discovery |
| Broker integration | Lower-cost research |
| Multi-asset analysis | Primarily U.S. equities |
| Trading community | A simpler workflow |
| Best for novice to advanced traders | Best for novice traders on a budget |
TradingView is the stronger all-round platform, with better charting, scanning, backtesting, alerts, broker connectivity, community tools, and strategy development. Finviz is fast, affordable, and good for quick stock screening, heatmaps, and visual market snapshots.
TradingView vs. Finviz Lab Test Results
TradingView scored 4.75 in my 58-point benchmark, compared with 3.84 for Finviz. TradingView leads in charting, market coverage, backtesting, alerts, broker connectivity, community, and strategy development. Finviz remains highly useful for fast stock screening, heatmaps, pattern scanning, and visual market analysis.
TradingView features a news stream and a 20-million-strong active social community sharing charts and ideas. Finviz has no social component.
Let’s compare the outstanding features side by side.
TradingView Lab Ratings
TradingView is the world’s premier trading platform, trusted by over 20 million active traders. It offers a seamless blend of powerful charting tools, advanced screening features, and in-depth analysis, covering a wide range of assets, including stocks, indices, ETFs, and cryptocurrencies.
| Test | Tier | Score | Average |
|---|---|---|---|
| Composite Lab Performance Score | AAA | 4.75 | 4.21 |
| Pricing Index: $ per Day | AA | $1.97 | $2.74 |
| Value Score (VP) | AA | 4.37 | 2.82 |
| Speed & Ease of Use | AAA | 5.00 | 4.50 |
| Chart Analysis Depth Index | AAA | 5.00 | 3.17 |
| Chart Pattern Depth & Accuracy | B | 3.98 | 2.73 |
| Scanning Performance | AAA | 4.83 | 3.38 |
| Backtesting Performance | A | 4.19 | 3.38 |
| Trading Bot & Auto-Trading Reliability | B | 3.50 | 2.50 |
| AI & Algo Index | A | 4.00 | 2.00 |
| Alert Speed | AA | 4.67 | 3.67 |
| Trade Signal Quality | C | 2.50 | 0.00 |
| Broker Connectivity & Ecosystem Depth | AAA | 5.00 | 1.55 |
| Portfolio Tool Performance | B | 3.60 | 2.80 |
| Financial News Speed & Depth | B | 3.00 | 2.30 |
| Community Utility Index (CUI) | AAA | 5.00 | 3.25 |
| Support Infrastructure & SLA Audit | B | 3.25 | 3.75 |
Tested using benchmarking system v3.
See the 2026 v3 58-point TradingView test and benchmarks.
Pros
✔ 20 million users sharing ideas
✔ AAA Speed & ease of use
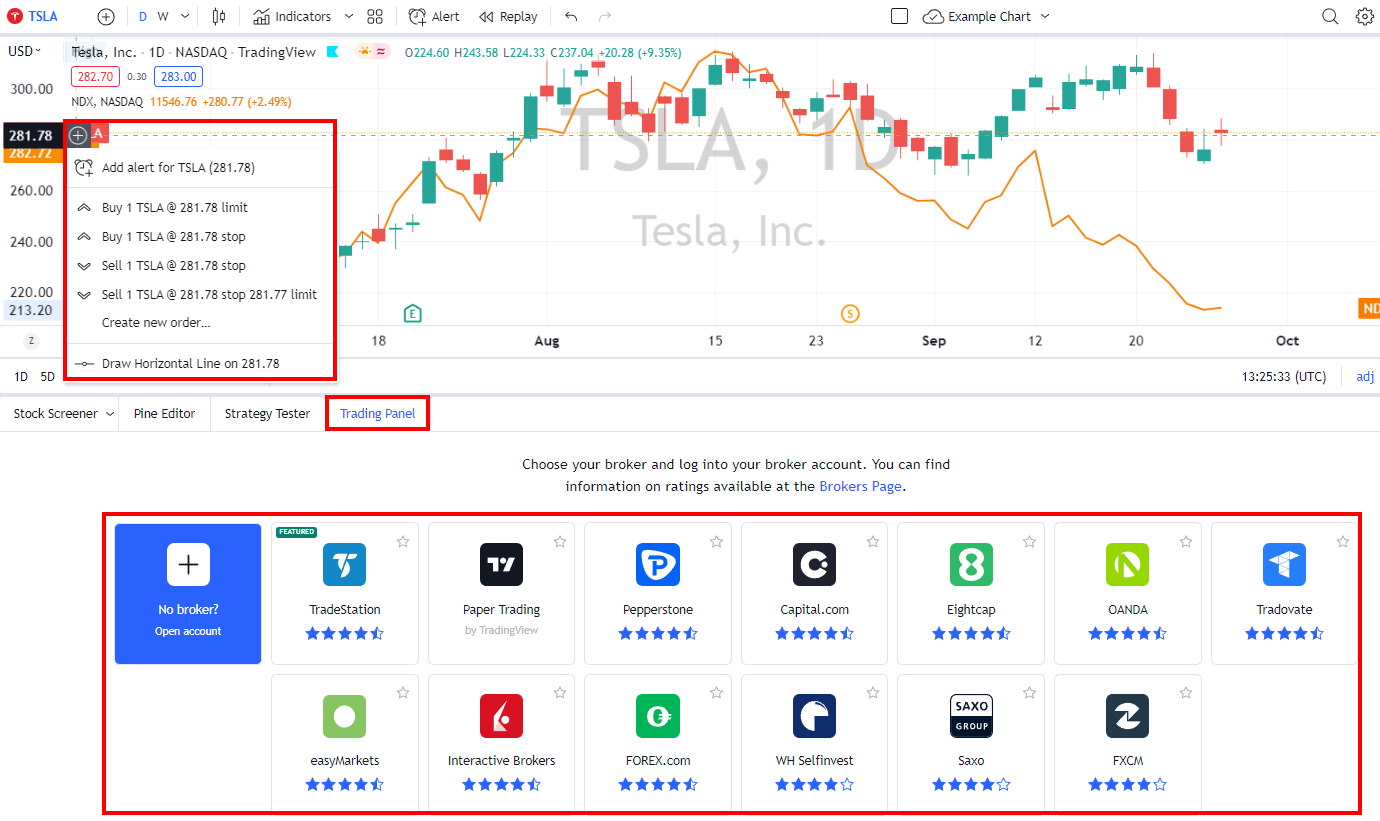
✔ Trading from charts
✔ Powerful screening and technical analysis
✔ All stock exchanges globally
✔ AAA Broker connectivity and asset coverage
✔ 100,000+ user-generated strategies
✔ Free and low-cost plans
✔ Flexible backtesting with Pine Script
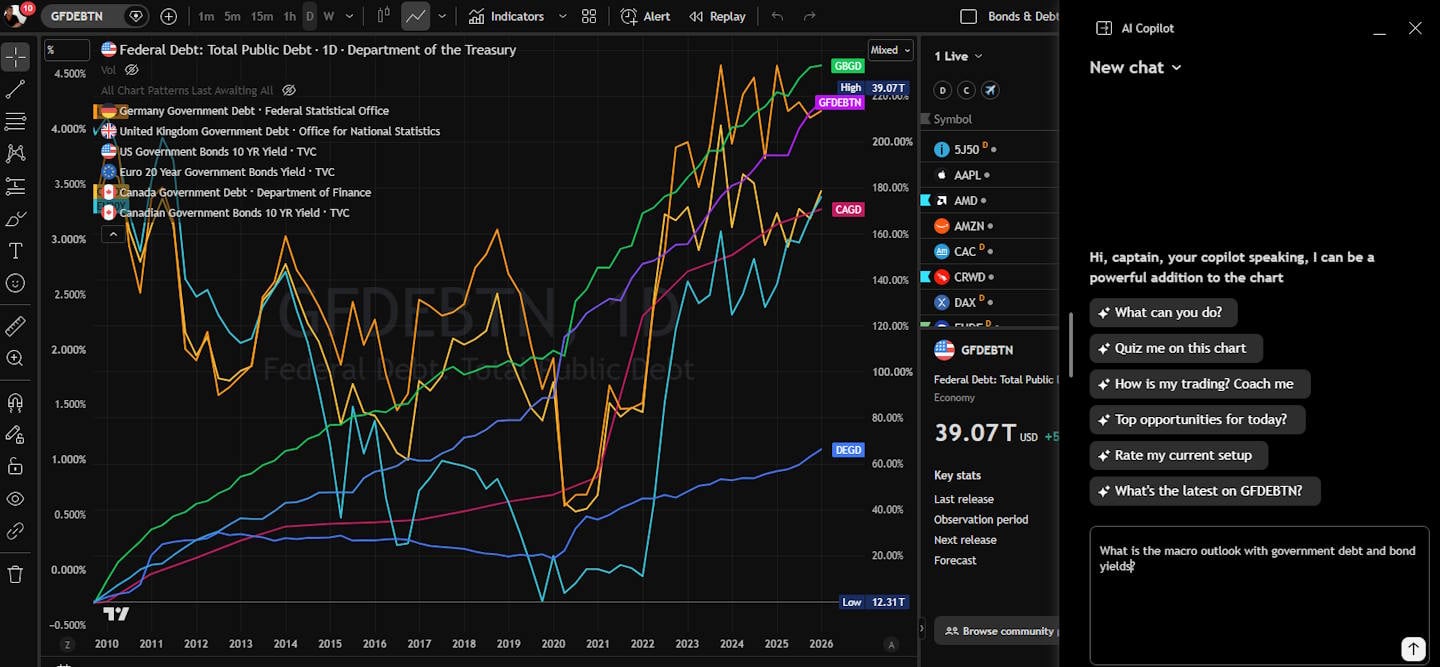
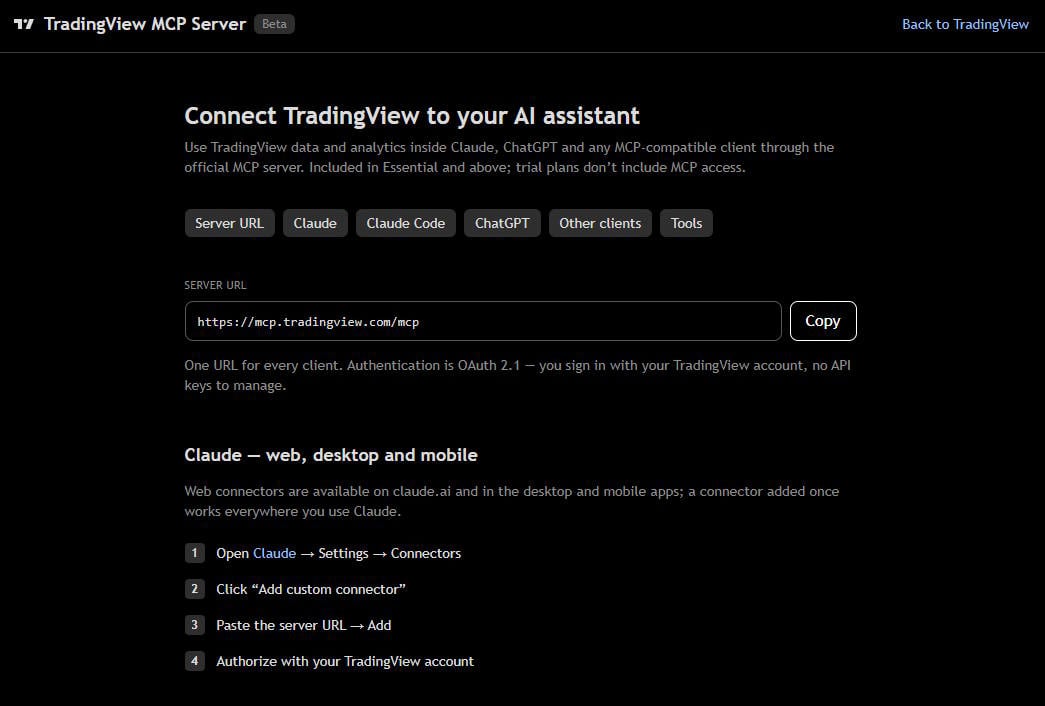
✔ New ChatBot & AI MCP Servers
Cons
✘ Not ideal for value or dividend investors
✘ Coding skills required for backtesting and custom indicators
✘ Average portfolio tools

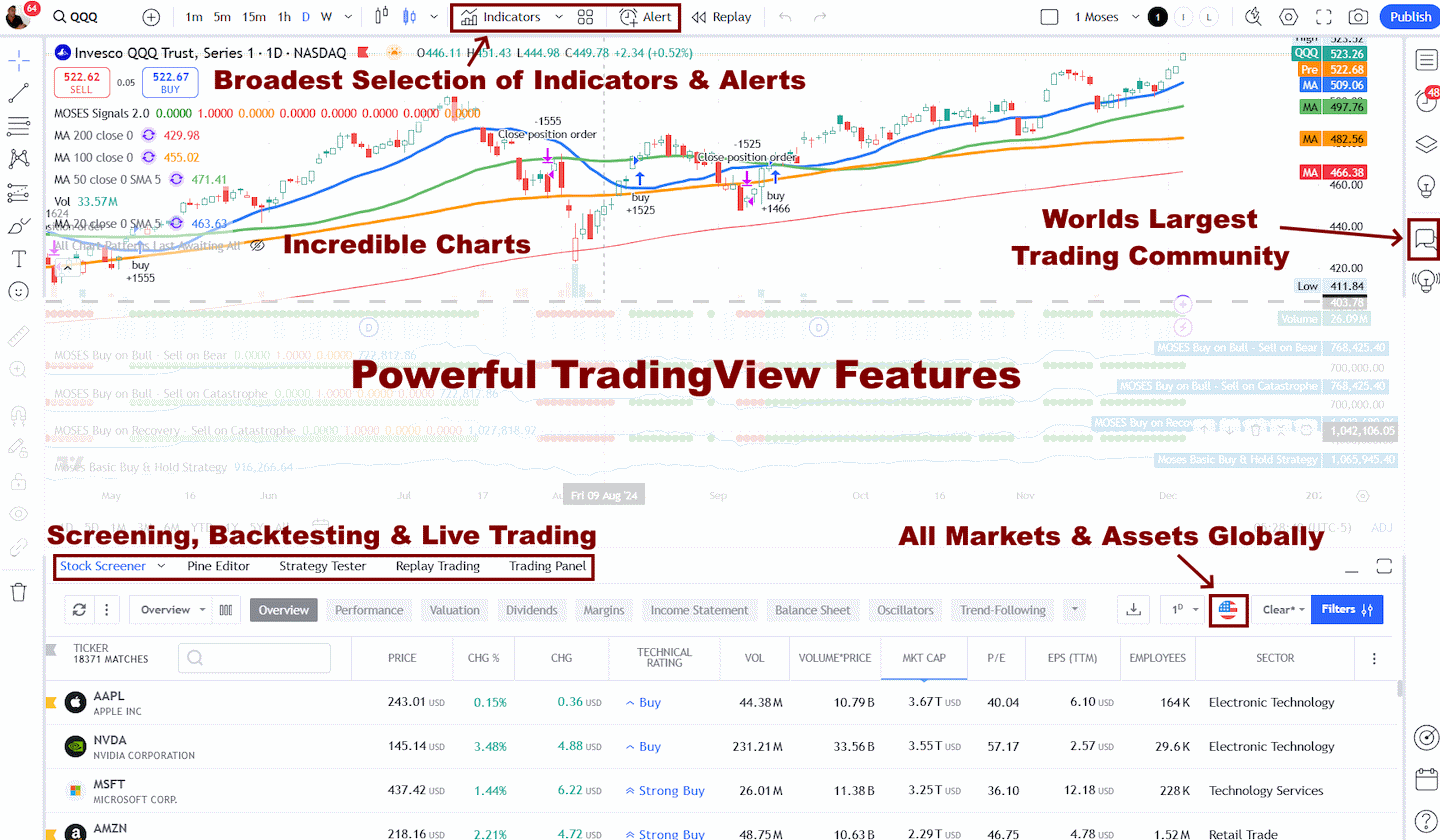
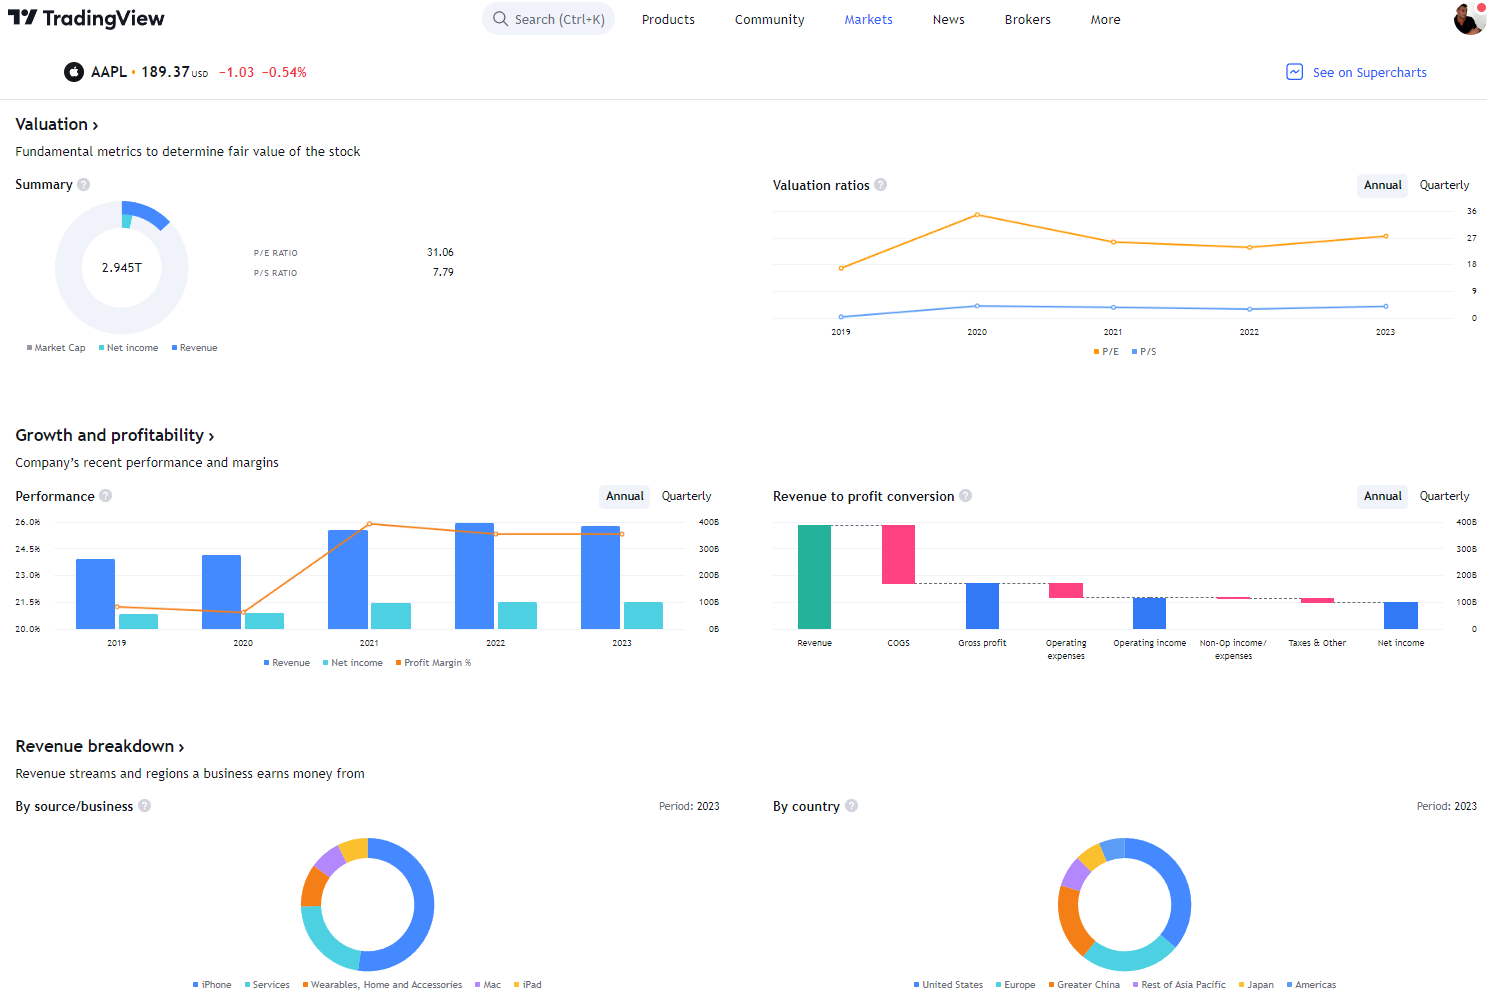
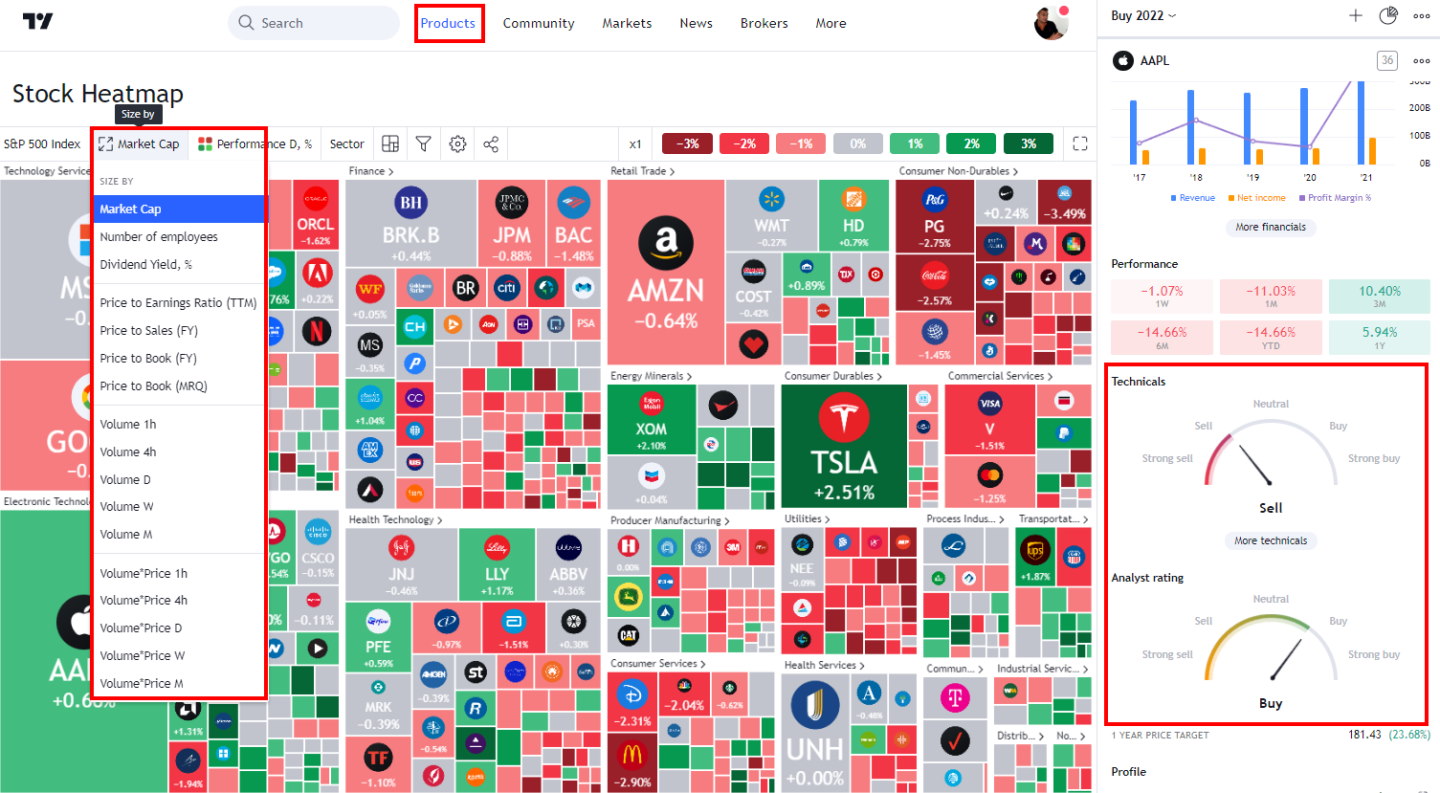
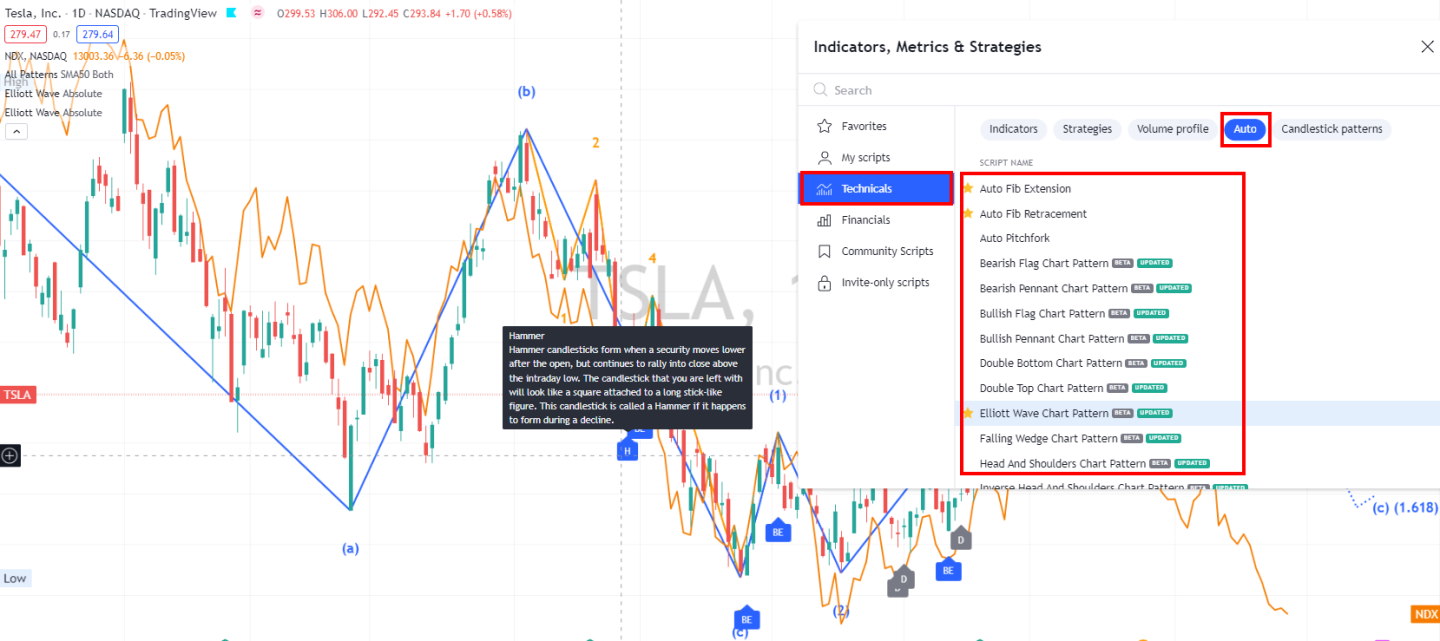
TradingView provides best-in-class technical analysis tools to analyze financial markets. It offers heatmaps, super charts, indicators, strategy development tools, and backtesting capabilities.
Its vibrant community of traders shares ideas, strategies, and custom indicators, making it an invaluable resource for learning and collaboration.

Finviz Lab Ratings
After hands-on testing, I found Finviz to be a powerful free stock screener, with swift market heatmaps and impressive stock chart pattern recognition.
Thanks to ongoing enhancements to its charting capabilities, Finviz remains a relevant and powerful tool in stock analysis. Through my testing, I found Finviz to be an exceptional free resource, offering intuitive heatmaps, speedy stock screening, and seamless chart pattern recognition.
| Test | Tier | Score | Average |
|---|---|---|---|
| Lab Test Composite Score | B | 3.84 | 4.21 |
| Value Score (VP) | C | 1.74 | 2.82 |
| Speed & Ease of Use | AAA | 4.83 | 3.75 |
| Chart Analysis Depth Index | C | 1.54 | 3.17 |
| Chart Pattern Depth & Accuracy | C | 2.73 | 2.73 |
| Scanning Performance | C | 2.26 | 3.38 |
| Backtesting Performance | C | 2.75 | 3.38 |
| Trading Bot & Auto-Trading Reliability | C | 2.00 | 2.50 |
| AI & Algo Index | C | 2.00 | 2.00 |
| Alert Speed | B | 3.67 | 3.67 |
| Trade Signal Quality | C | 0.00 | 0.00 |
| Broker Connectivity & Ecosystem Depth | C | 0.67 | 2.00 |
| Portfolio Tool Performance | C | 2.50 | 2.80 |
| Financial News Speed & Depth | C | 1.50 | 2.30 |
| Community Utility Index (CUI) | C | 1.75 | 3.25 |
| Support Infrastructure & SLA Audit | C | 1.25 | 3.75 |
Tested using rating system v3.
See the 2026 v3 58-point Finviz test and benchmarks.
Pros
✔ 67 stock screening metrics
✔ 44 Chart Patterns Recognized
✔ Intraday (1-minute) data with Finviz Elite
✔ One of the best free stock screeners
✔ Good insider trading/news service
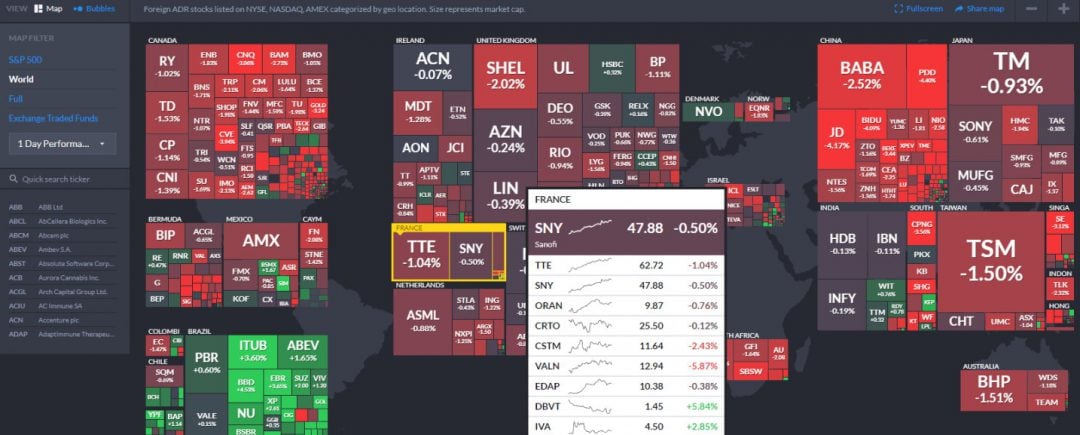
✔ Fast heatmaps for sector & industry visualizations
✔ Integrated news aggregation
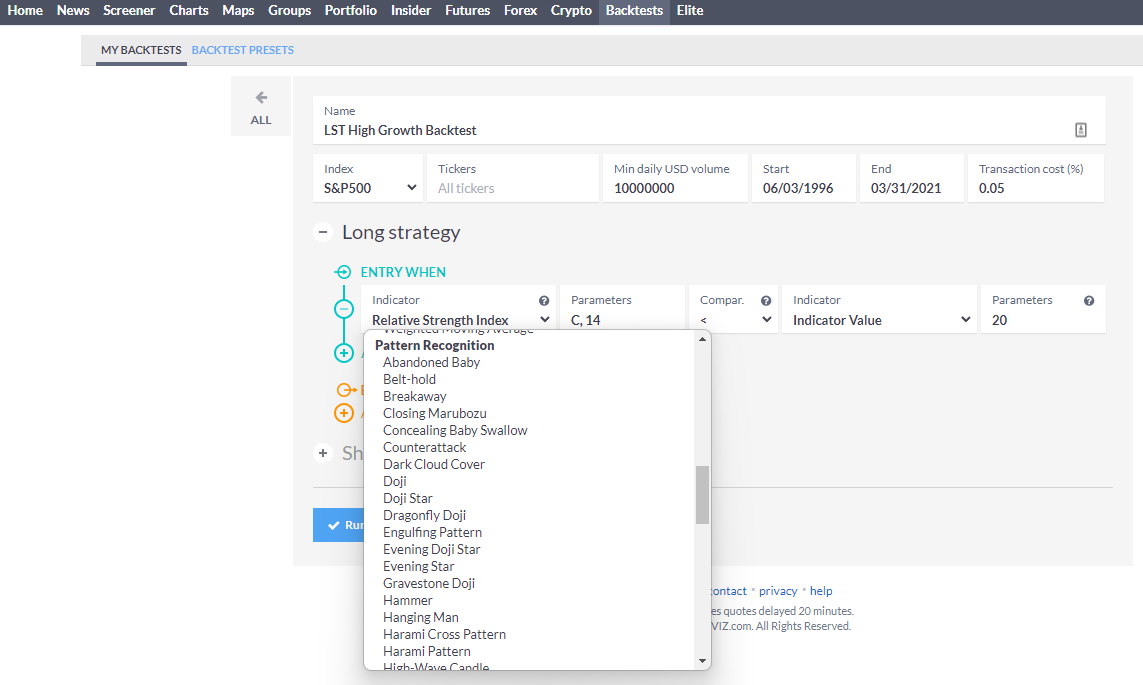
✔ Backtesting recognizes 102 chart patterns
Cons
✘ Elite Backtesting Could Be More Flexible
✘ 21 chart indicators
✘ No app for Android or iPhone
✘ No Community
✘ Support & SLA

For those seeking more advanced features, Finviz Elite delivers value at $299 per year, providing real-time data and robust backtesting tools.
Finviz’s elite service provides real-time market data and enables up to 24 years of backtesting across multiple combinations of 102 technical indicators. Finviz is designed for individual investors, enabling them to screen for stocks, see which are on the move, and track their performance in real time.
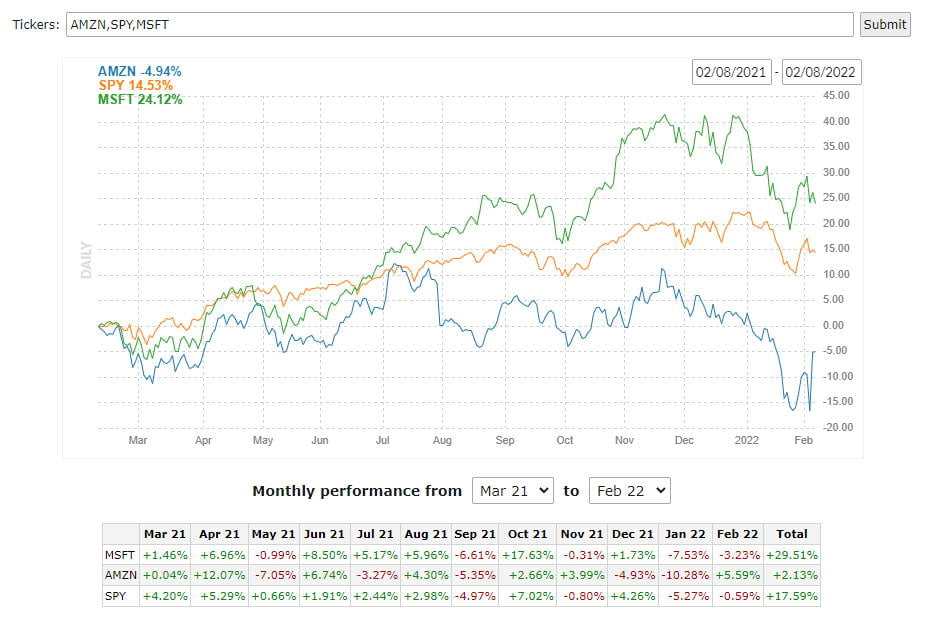
TradingView and Finviz offer charts, pattern recognition, scanning, and heat maps. TradingView has a global community and data, but Finviz is US-only. TradingView is a powerful stock, FX, and Crypto trading platform, and Finviz is extremely quick and easy to use.
Overall Comparison
Composite Lab Performance Score: TradingView 4.75 vs. Finviz 3.84. TradingView leads the overall comparison because of its broader charting, screening, backtesting, broker integration, alerts, community, and multi-asset capabilities.
TradingView: TradingView wins the overall comparison with a Composite Lab Performance Score of 4.75, placing it at the top of my benchmark range. Its strength is its breadth: TradingView combines elite charting, powerful scanning, Pine Script backtesting, broker connectivity, global data, alerts, community scripts, and multi-asset coverage on a single platform. In my testing, it is the better all-round choice for traders who want a complete research, charting, strategy development, and trading ecosystem.
Finviz: Finviz scores 3.84. Its strength is fast visual stock screening, heatmaps, simple charts, pattern scanning, and market overview tools. Still, it loses ground in chart depth, broker connectivity, community, portfolio tools, alerts, and strategy flexibility. Finviz is useful as a fast idea-generation tool; TradingView is the stronger full-platform solution.
Pricing & Value
Finviz is cheaper, while TradingView offers significantly broader and higher-quality functionality. Finviz Elite costs $24.96/month on an annual plan, and the equivalent plan on TradingView is the Plus plan at$29.95. Both have good free plans.
For traders who only need stock screening, heatmaps, alerts, and U.S. equity research, Finviz offers strong value. TradingView costs more as you move up the plan range, but it adds advanced charting, Pine Script, backtesting, global market coverage, broker integration, and a large trading community.
TradingView costs $1.97/day in my benchmark. That is higher than Finviz, but it delivers far more functionality for the price: global market coverage, advanced charts, Pine Script, strategy testing, alerts, broker connections, screeners, community indicators, and multi-asset workflows. TradingView is not the cheapest option in this head-to-head, but it offers a much broader platform for active traders and technical analysts.
TradingView pricing starts at $0 for the Basic, ad-supported plan, which includes ad-supported screening, charting, trading, scripting, backtesting, and three indicators per chart. The Free plan is a great way to test the service.
TradingView Essential costs $12.95/mo on an annual plan and is ad-free. It includes two charts per layout, five indicators per chart, and 20 alerts. It is ideal for beginners and also enables access to the full social network.
The annual Plus Plan at $29.95/mo adds four charts per tab, 100 alerts, and advanced Renko, Kagi, Point & Figure, and Line Break charts.
I personally use TradingView Premium at $59.95/mo annually; it offers the optimal balance of price and key functionality: 25 indicators per chart, 400 alerts, and, most importantly, automated chart pattern recognition.
It is designed for intermediate and advanced-level traders who seek the optimal balance between functionality and price.
See our TradingView Pricing Guide for further details and discounts.
TradingView Discounts
Finviz wins on raw pricing at $0.54/day, making it one of the most cost-effective tools in this comparison. The tradeoff is narrower functionality. Finviz is excellent for quickly screening U.S. stocks, viewing heatmaps, checking charts, and scanning for basic technical or fundamental conditions, but it does not provide TradingView’s deeper charting, scripting, strategy testing, community, or broker-connected trading ecosystem.
Finviz’s Free Plan is ad-supported but provides great value for beginner investors. You can scan and screen over 10,000 stocks and utilize delayed charts, heatmaps, and a news stream. The free plan is ideal for beginner investors who want to explore the markets without any fuss.
The real power of Finviz is unleashed with the Elite Plan. It adds real-time data, flexible charts, alerts, excellent backtesting, and correlation charts. You can also export your screener results and access eight years of company financial statements. Elite is extremely cost-effective at $39.99/m or $24.96/m on an annual plan, saving you 37%.
Finviz Discount
Finviz does not have coupon codes, but it offers a 37% discount for all customers who start an annual Elite subscription.
Overall Value
Value Score: TradingView 4.37 vs. Finviz 1.74. TradingView’s higher score reflects its broader feature set, including advanced charting, scripting, screening, alerts, backtesting, community features, and broker integration.
TradingView wins Value Score with 4.37. This reflects TradingView’s superior breadth of features, device support, charting depth, scripting, scanning, alerts, backtesting, community, and broker integration. TradingView costs more per day than Finviz, but the added functionality makes the platform significantly more valuable for traders who use technical analysis seriously.
Finviz scores 1.74 for Value, which reflects its narrower feature set rather than poor usefulness. Finviz is very good at fast visual market screening, but it lacks many of the deeper tools that increase TradingView’s value score. It is best for traders and investors who want quick market snapshots, simple filters, pattern screens, heatmaps, and basic research without needing a full trading platform.
Speed & Ease of Use
Speed & Ease of Use: TradingView 5.00 vs. Finviz 4.83. Both platforms are fast and easy to use, although TradingView combines greater functionality with a more integrated workflow.
TradingView scores a perfect 5.00 for Speed & Ease of Use. In my testing, it combines fast chart loading, smooth navigation, intuitive workflows, and low-friction access to charts, indicators, screeners, alerts, watchlists, and strategy tools. The impressive part is that TradingView remains easy to use despite being far more powerful than Finviz.
TradingView significantly outperforms Finviz in usability, simplicity, and workflow. While Finviz and TradingView are easy to use, the various Finviz components, such as screening, portfolio, charting, and backtesting, do not integrate seamlessly. The Finviz interface is ancient, whereas the TradingView user experience is seamless and a dream to use.
Finviz scores an excellent 4.83. Its advantage is simplicity: the interface is fast, visual, and easy to understand. Finviz works well for screening stocks, reviewing heatmaps, checking charts, or scanning for basic market signals. It is less flexible than TradingView, but its speed and simplicity make it very efficient for quick stock discovery.
Both TradingView and Finviz require zero installation or configuration. Finviz makes visualizing large amounts of big-picture financial data very easy, and the screener is simple to use; however, the core components of Finviz do not work together effectively.
Charting & Technical Analysis
Chart Analysis Depth: TradingView 5.00 vs. Finviz 1.54. TradingView provides substantially deeper technical analysis through advanced charts, indicators, drawing tools, Pine Script, layouts, and interactive analysis.
TradingView dominates Chart Analysis Depth with a perfect 5.00. Its strength comes from advanced chart types, deep indicator coverage, Pine Script, drawing tools, layouts, alerts, multi-asset charts, and community-built indicators. In my testing, TradingView is clearly the better technical analysis platform because it supports both manual charting and highly programmable analysis.
TradingView outperforms Finviz significantly in stock charting. Finviz charts are adequate for quick stock analysis, but they are much less interactive and flexible than TradingView’s charting environment.
TradingView Charting Is Excellent
TradingView offers 160 indicators and unique specialty charts, including LineBreak, Kagi, Heikin Ashi, Point & Figure, and Renko.
TradingView offers an exceptional selection of chart drawing tools, including features unavailable on other platforms, such as extensive Gann and Fibonacci tools, 65 drawing tools, and hundreds of icons for your charts, notes, and ideas. Finviz offers only 15 different chart annotation tools.
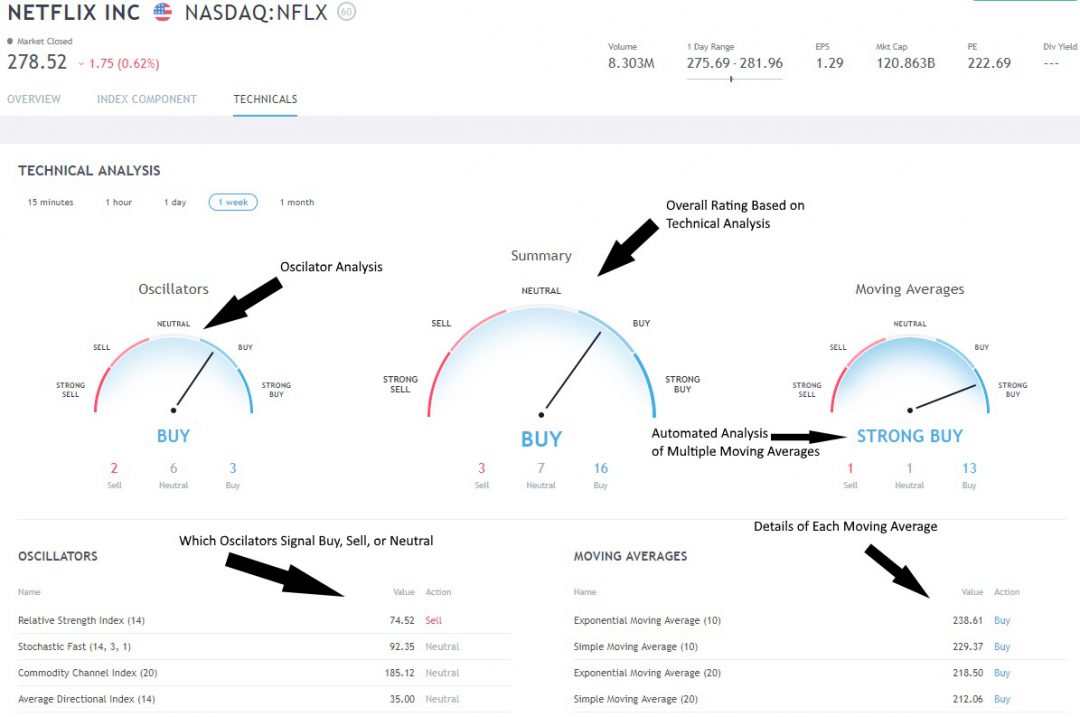
TradingView’s innovative Buy and Sell gauges save you time by providing an instant readout of which stocks are bullish, bearish, or neutral.
TradingView’s stock indicator ratings are well implemented because they incorporate two critical technical analysis indicators: price-based moving averages and price- and volume-based oscillators. Based on my observations, the TradingView buy and sell indicators are a good measure of sentiment and are featured in my Fear & Greed Index Dashboard.
Finviz Charting Is Adequate
Finviz scores only 1.54 for Chart Analysis Depth. Its charts are useful for quick confirmation, but they are not in-depth enough for serious technical analysis work. Finviz has limited indicators, fewer overlays, less interactive chart control, and a weaker annotation workflow. It is acceptable for quickly checking a setup, but TradingView is far superior for building and refining technical strategies.
Finviz offers only 9 chart overlays, including Bollinger Bands and VWAP, and 17 chart indicators. Thus, the stock charting experience with Finviz is weak. You cannot simply right-click and add an indicator or study; you have to open settings, select the indicators, and then click save. Finviz lacks an effective interactive workflow experience for users.
Additionally, throughout Finviz, you need to click SAVE constantly. There is no auto-save for your screening criteria, chart annotations, or backtests. If you accidentally move to the next chart, you will lose your configuration, which is frustrating and a dated user experience.
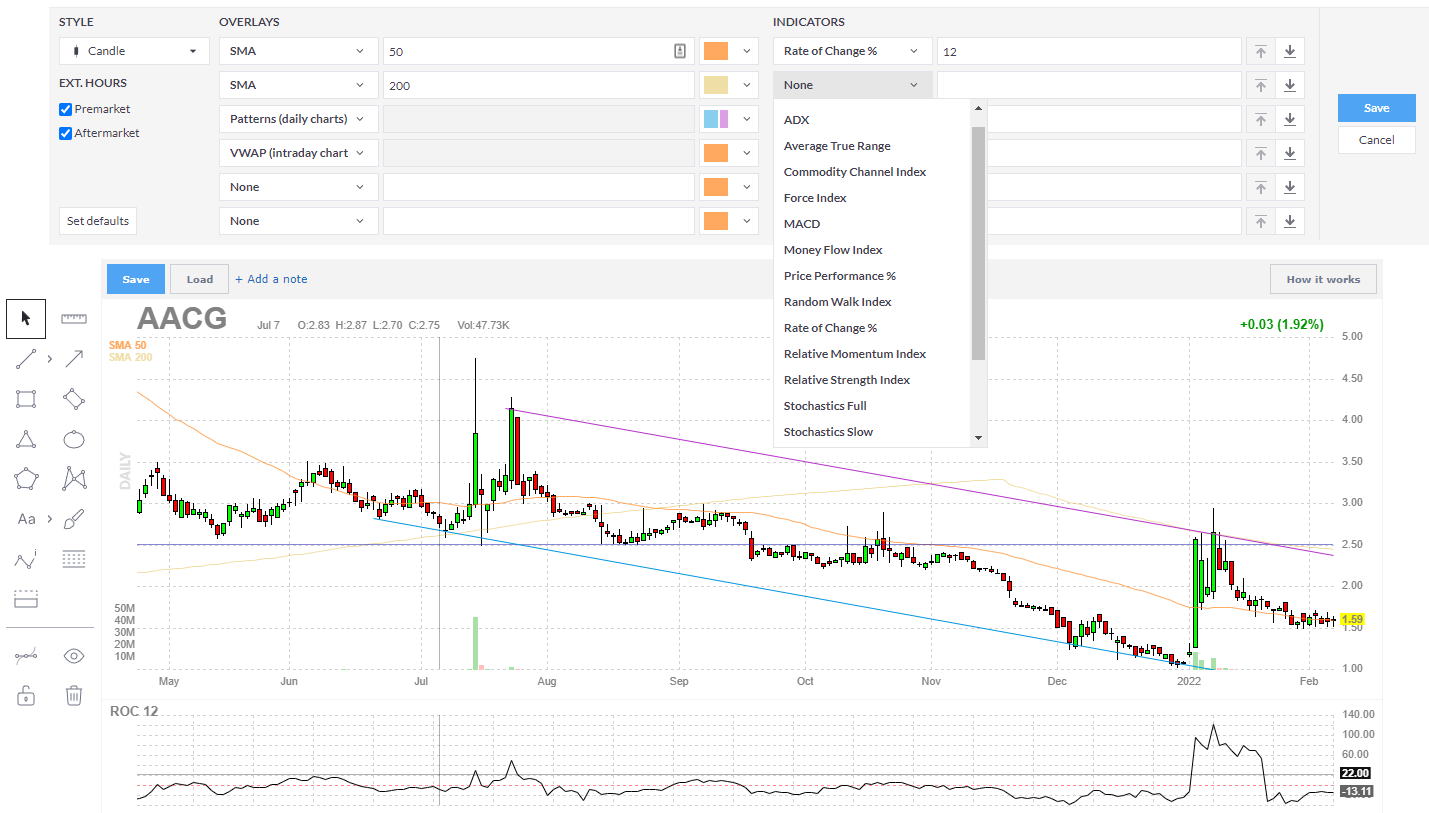
Chart Pattern Recognition
Chart Pattern Depth & Accuracy: TradingView 3.98 vs. Finviz 2.73. TradingView offers the stronger overall pattern-analysis environment, while Finviz remains useful for rapidly identifying chart patterns and technical setups.
TradingView scores 3.98 for Chart Pattern Depth & Accuracy. It is strong because its pattern recognition can be combined with Pine Script, alerts, indicators, drawing tools, and community-created scripts. TradingView is not only identifying patterns; it lets traders build workflows around those patterns, test ideas, and monitor signals across multiple assets and timeframes.
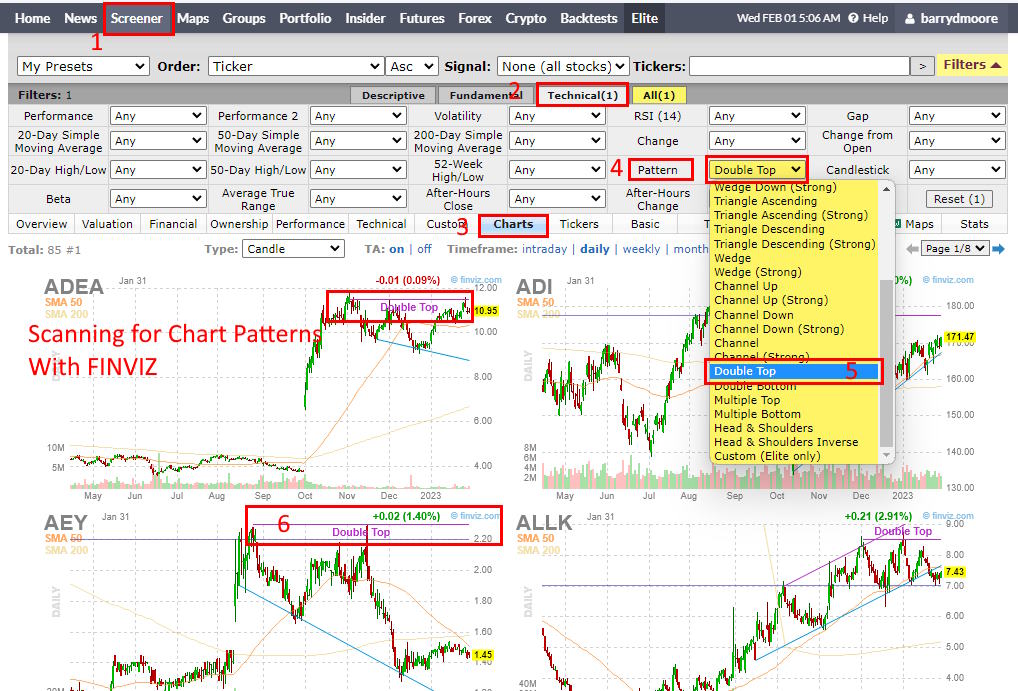
Finviz scores 2.73, which is respectable and matches the benchmark median. Pattern scanning is one of Finviz’s better technical features, especially for traders who want to quickly filter for visual setups such as trendline breaks, channels, wedges, double tops, or other chart-based signals. TradingView remains stronger overall, but Finviz is surprisingly useful for fast pattern-based stock discovery.
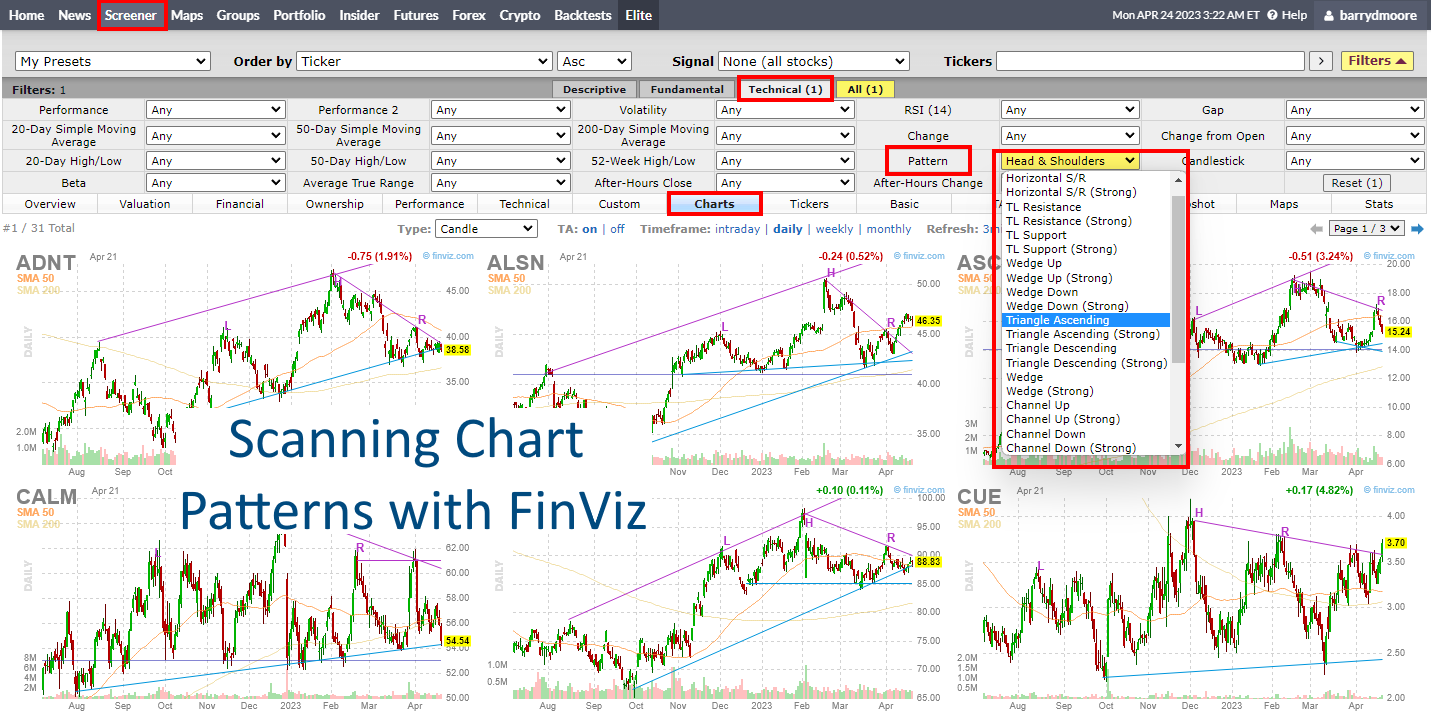
Finviz provides automatic trendline recognition, identifying price patterns such as wedges, triangles, double tops, and channels on daily charts; this is a significant advantage for pattern traders. The scanner also has 33 automated stock chart signals. TradingView is also no slouch, providing automated candlestick recognition and thousands of community-developed indicators.
Finviz and TradingView offer solid implementations of pattern recognition. The kings of automated AI pattern recognition are Trade Ideas and TrendSpider, which lead the industry.
Stock Screening
Scanning Performance: TradingView 4.83 vs. Finviz 2.26. TradingView offers broader, more flexible market screening, while Finviz remains particularly effective for fast, visual U.S. stock discovery.
TradingView wins Scanning Performance with 4.83. Its scanner is stronger because it supports broader market coverage, more flexible filters, technical and fundamental criteria, multi-asset screening, and better integration with charts, watchlists, alerts, and scripts. In my testing, TradingView is the better scanner for traders who want depth, speed, and global coverage.
Both platforms offer strong stock screening, but they serve different use cases. Finviz is fast for U.S. equity screening and visual market discovery. At the same time, TradingView provides dynamic, self-refreshing screeners with broader market coverage, more filtering depth, and tighter integration with charts, watchlists, alerts, and other asset classes.
Finviz allows you to scan for a mix of 67 fundamental criteria and combine them with 30 different trading signals. That may seem like a huge choice, but TradingView offers over 200 criteria.
TradingView Screening & Scanning
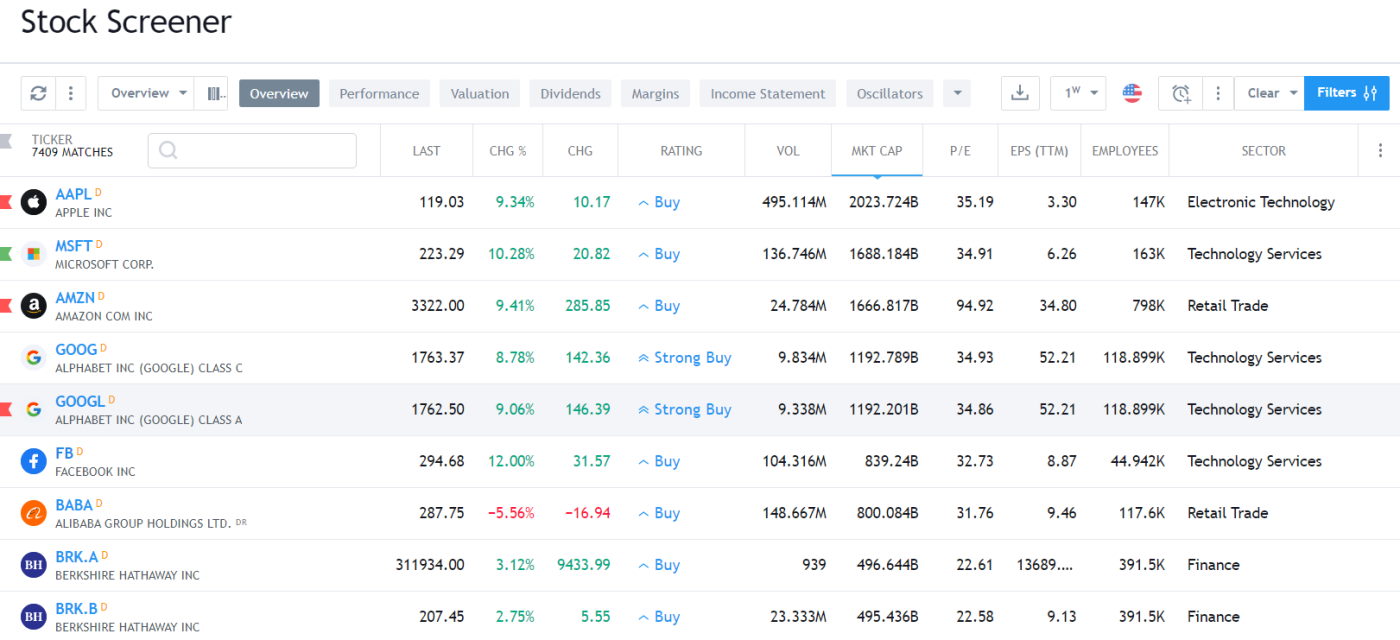
TradingView has integrated stock, forex, and crypto screeners, as well as heatmaps, covering fundamental analysis and price/volume indicator scanning. Finviz primarily focuses on technical price, volume, and indicator screening, as well as analyst rating changes and earnings announcements.
The TradingView stock screener comes complete with 160 fundamental and technical screening criteria. All the usual criteria are present, including EPS, Quick Ratio, Pre-Tax Margin, and PE Ratio. However, it also delves deeper with esoteric criteria, such as the number of employees, goodwill, and enterprise value.
Finviz Screening & Scanning
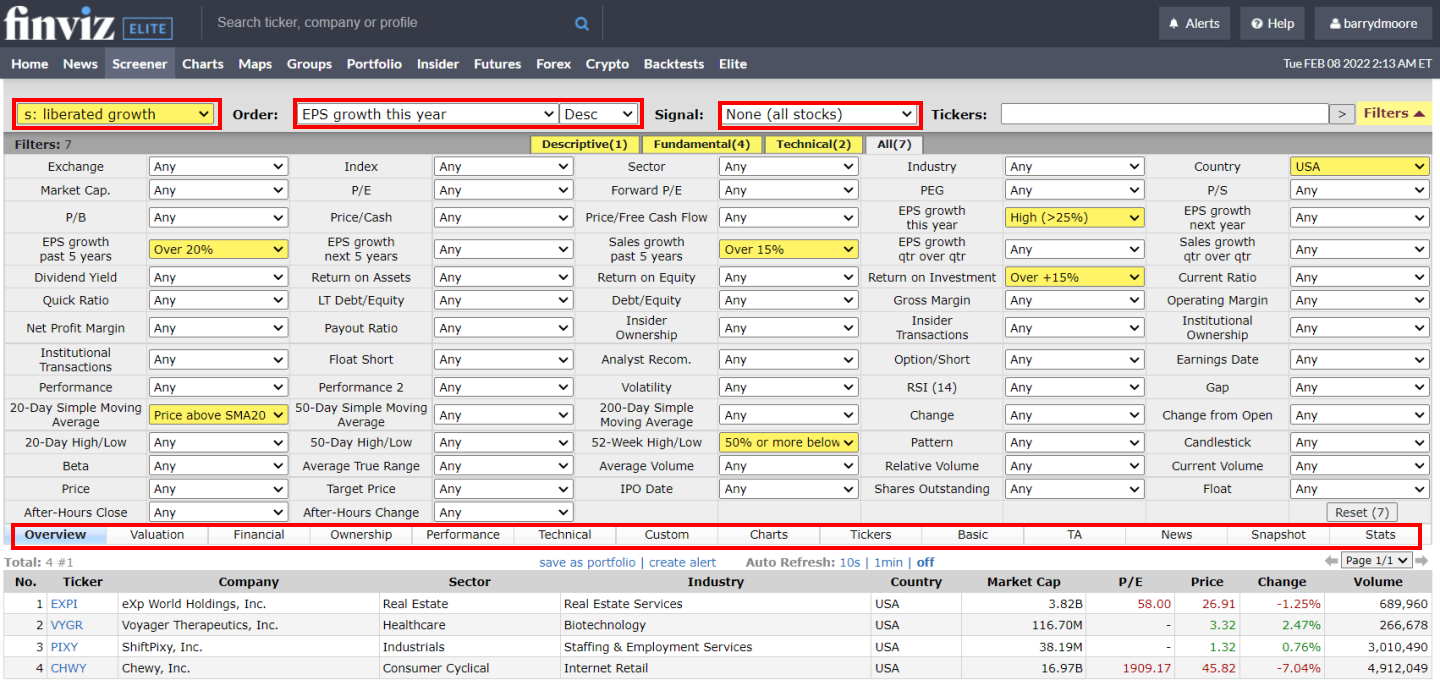
Finviz scores 2.26 for Scanning Performance. That is much lower than TradingView, but Finviz remains useful because its screener is fast, visual, and easy to operate. It is especially good for filtering U.S. stocks using fundamental data, technical signals, insider activity, analyst changes, and simple chart-pattern criteria. Finviz is good for quick screens; TradingView is better for deeper and broader market scanning.
The Finviz screener enables rapid filtering of over 8,500 major stocks and ETFs. However, this does not include all the stocks in the world; it is just the major stocks, as there are over 10,000 stocks in the USA alone.
The Finviz stock screener is extremely fast and allows you to filter on 67 fundamental and technical criteria. You can filter stocks based on specific chart-based signals, such as new highs and lows, oversold conditions, analyst upgrades, insider buying, or chart patterns like double tops and head-and-shoulders formations.
Finviz shines where the others do not, as it also allows you to screen on ten major candlestick patterns and 30 stock chart patterns. This mix of fundamental screening criteria for investors, technical charts, and candlestick pattern recognition for traders makes Finviz a good match for short-term and medium-term investors.
Backtesting Performance
Backtesting Performance: TradingView 4.19 vs. Finviz 2.75. TradingView provides greater strategy flexibility through Pine Script and Strategy Tester, while Finviz offers a simpler but more restricted backtesting environment.
TradingView wins Backtesting Performance with 4.19. Its advantage is Pine Script strategy testing, fast chart-based backtesting, and the ability to convert trading ideas into rules that can be tested historically. TradingView is especially useful for traders who want to build, modify, and test strategies directly on charts across multiple asset classes.
Finviz scores 2.75 for Backtesting Performance. That makes it usable, but limited. Finviz can support basic backtesting-style workflows, particularly around index or screener-based ideas, but it lacks the flexibility, reporting depth, coding environment, and strategy control that TradingView offers. Finviz is better for simple idea checks; TradingView is better for serious strategy development.
TradingView outperforms Finviz in terms of backtesting. TradingView offers exceptional backtesting for systems and strategies with endless flexibility, whereas Finviz backtesting is unintuitive, restrictive, and lacks any usable reporting.
TradingView Backtesting
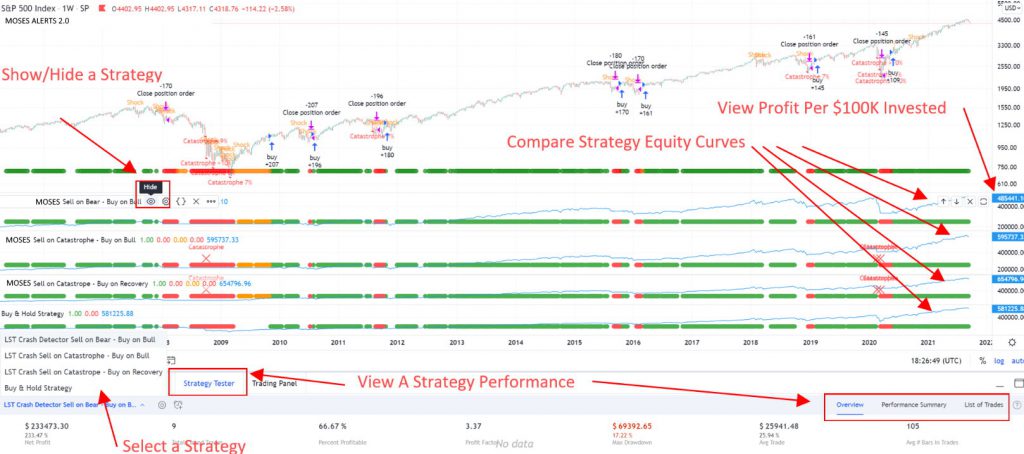
TradingView has a backtesting system called Strategy Tester, but you must develop scripting skills with the proprietary Pine code to build original backtesting systems. I have even implemented my MOSES ETF Trading strategy into TradingView; I am no developer, but the Pine Script language is so natural that anyone can do it.
Finviz Backtesting
With the Finviz Elite plan, you receive a backtesting service; however, after extensive testing, I can reveal that it is a very poor service indeed.
The Finviz Backtester offers over 100 unique indicators and automatically detects stock chart patterns to help build a truly unique system. After all this work, I created a system based on the Money Flow Index that has outperformed the S&P 500 index handsomely over the last 24 years.
The system generated a profit of 1,588%, with a compounded annual growth rate (CAGR) of 15.24% compared to the S&P 500’s 10.86% (See the proof below).
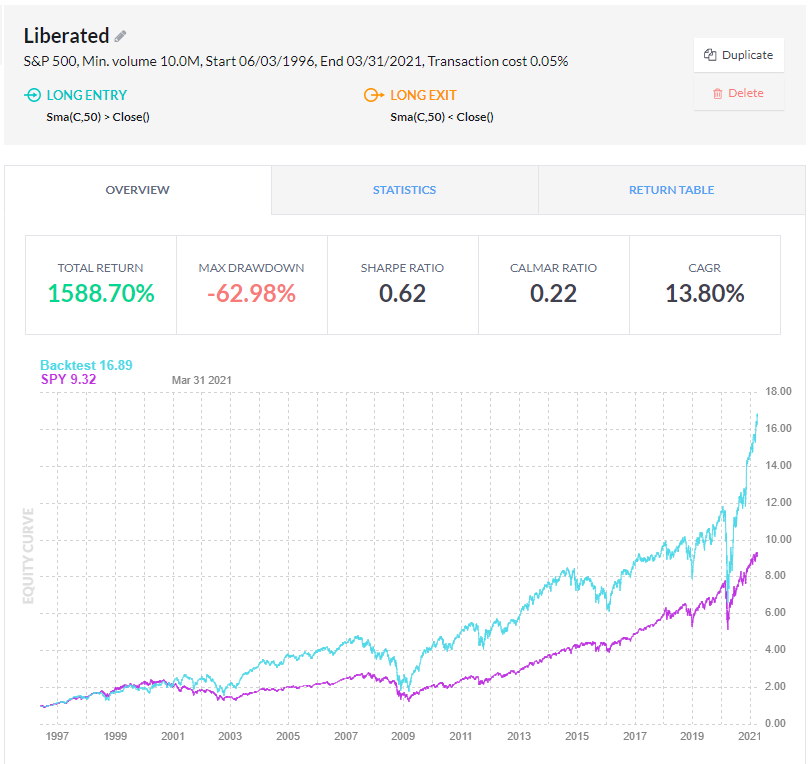
The next step is to examine all the trades, including buy signals, sell signals, drawdowns, maximum win/loss ratios, and win/loss ratios. But there is none of that. The reporting for the backtesting service is inadequate and lacks thoroughness. I could not see which trades were executed or what stocks were purchased.
One cannot believe the backtest results when there is no evidence of every trade and the entry and exit points. If you want a good backtesting service, please read my detailed review and test of the best stock backtesting software.
Automation & Auto-Trading
Trading Bot & Auto-Trading Reliability: TradingView 3.50 vs. Finviz 2.00. TradingView supports more sophisticated rule-based automation through Pine Script, alerts, webhooks, and broker integrations, while Finviz is primarily designed for research and signal discovery.
TradingView scores 3.50 for Trading Bot & Auto-Trading Reliability. It is not a fully managed bot platform, but it is strong for semi-automated workflows using Pine Script, alerts, strategy logic, and broker or webhook-style integrations. In my testing, TradingView is better than Finviz for turning rule-based analysis into actionable automation.
When it comes to stock trading, TradingView beats Finviz. TradingView offers full broker integration, allowing you to trade directly from charts. In contrast, Finviz lacks broker integration.
TradingView supports 50+ brokers, enabling tight integration so you can trade directly from charts and view your profits and losses in TradingView. Finviz does not have broker integration, so you must manually enter trades with your current broker.
Finviz scores 2.00 in this category. It provides useful alerts and screening tools, but it is not built for automated execution, strategy deployment, or bot trading. Finviz can help traders find ideas and monitor conditions, but it does not offer the same script-driven alert and automation workflow that makes TradingView more powerful for systematic traders.
AI & Algorithmic Trading
AI & Algo Index: TradingView 4.00 vs. Finviz 2.00. Neither platform is primarily an AI trading system, but TradingView provides a significantly deeper programmable ecosystem for custom indicators, strategies, alerts, and algorithmic workflows.
TradingView scores 4.00 for AI & Algo. It is not an AI-native platform, but it has a strong algorithmic ecosystem through Pine Script, public scripts, custom indicators, strategy testing, alerts, and transparent user-built logic. Its strength is not black-box AI; it is flexible, programmable, community-driven strategy development.
Finviz scores 2.00 for AI & Algo. It offers automated screening, technical signals, pattern recognition, and useful market visualization, but it does not provide a deep algorithmic development environment. Finviz is more rules-assisted than algorithmic. Traders can use it to find conditions quickly, but not to build and test advanced custom strategies as they can in TradingView.
Alerts
Alert Speed: TradingView 4.67 vs. Finviz 3.67. TradingView offers more advanced alert logic tied to prices, indicators, drawings, strategies, and Pine Script, while Finviz handles straightforward stock and screener alerts effectively.
TradingView wins Alert Speed with 4.67. Its alerting is strong because alerts can be connected to price levels, indicators, drawings, strategy conditions, and Pine Script logic. That makes TradingView highly effective for monitoring many markets and turning technical conditions into real-time notifications.
Finviz scores 3.67, matching the benchmark median. Its alerts are useful for watchlist and screener-based monitoring, but they are not as flexible as TradingView’s script-connected alerts. Finviz works well for straightforward market and stock notifications, while TradingView is stronger for complex technical, strategic, and multi-condition alert workflows.
Broker Integration
Broker Connectivity & Ecosystem Depth: TradingView 5.00 vs. Finviz 0.67. TradingView supports broker-connected trading and direct chart execution, while Finviz is designed primarily for research and does not provide an equivalent integrated trading ecosystem.
TradingView wins Broker Connectivity & Ecosystem Depth with a perfect 5.00. This is one of the biggest differences in the comparison. TradingView supports broker-connected workflows, live trading access, chart trading, and broad market coverage, making it useful as both an analysis and trading platform.
Finviz scores only 0.67 for Broker Connectivity & Ecosystem Depth. It does not function as a serious broker-connected trading platform. Users can research, screen, and monitor stocks on Finviz, but trade execution must occur elsewhere. This is a major reason TradingView wins the platform comparison so decisively.
Portfolio Tracking
Portfolio Tool Performance: TradingView 3.60 vs. Finviz 2.50. Neither platform specializes in portfolio management, although TradingView provides stronger watchlists, alerts, multi-asset monitoring, and market tracking.
TradingView wins Portfolio Tool Performance with 3.60. It is not a dedicated portfolio analytics platform, but it provides strong watchlists, market tracking, alerts, multi-asset coverage, financial data, and chart-based monitoring. For traders and investors who follow many symbols across markets, TradingView provides a better portfolio-awareness workflow than Finviz.
Finviz 2.50 for Portfolio Tool Performance. It is useful for watchlists, screening, heatmaps, sector review, and quick stock monitoring, but it does not provide deeper portfolio analytics. Finviz is better for finding stocks than managing portfolios. TradingView provides broader tracking and monitoring tools, while dedicated portfolio platforms go deeper than both.
Financial News
Financial News Speed & Depth: TradingView 3.00 vs. Finviz 1.50. TradingView provides more integrated market news within its charting and trading workflow, while Finviz is useful for aggregated headlines and quick stock-specific research.
TradingView scores 3.00 for Financial News Speed & Depth. Its news is good enough for general market context, symbol-level research, and daily awareness, especially because it sits beside charts, alerts, watchlists, and community ideas. It is not a professional breaking-news terminal, but it is more integrated into a complete trading workflow than Finviz.
Finviz scores 1.50 for Financial News Speed & Depth. It is useful for aggregated headlines and market overview, but it is not a real-time news platform for serious catalyst trading. Finviz is helpful for quick context, insider activity, and general stock research, but traders who rely on fast news need a dedicated real-time news service.
Community & Social Features
Community Utility: TradingView 5.00 vs. Finviz 1.75. TradingView’s large community, public indicators, scripts, strategies, chart ideas, and commentary make up a substantial part of its platform, whereas Finviz is primarily an individual research tool.
TradingView dominates Community Utility with a perfect 5.00. Its community is one of the platform’s biggest advantages, giving users access to shared chart ideas, public indicators, scripts, strategies, commentary, and learning workflows. This community layer makes TradingView more than software; it becomes a global technical-analysis ecosystem.
TradingView surpasses Finviz in social trading and community features, including ideas, indicators, and backtesting scripts, as Finviz lacks these offerings.
TradingView is built with social at the forefront and is best for social sharing and learning. Forget StockTwits; TradingView is the best. Its fully integrated chat forum and publishing system are excellent ways to share your charts and ideas. Finviz does not have a social community.
Check out my published ideas on TradingView and follow me for stock market and stock analysis ideas and commentary.
Join me and 20 million traders on TradingView for free. It's a great place to chart, scan, trade, and get my latest trading ideas and analysis.
Finviz scores 1.75 for Community Utility. This is one of the biggest weaknesses in the comparison. Finviz does not offer a meaningful social trading community, a public strategy marketplace, a user-generated script library, or a large collaborative chart-sharing environment. It is a fast, individual research tool, while TradingView is a community-driven platform.
Support Infrastructure & SLA Audit
Support Infrastructure & SLA: TradingView 3.25 vs. Finviz 1.25. Neither platform leads our support benchmark, but TradingView provides the stronger combination of documentation, platform resources, community knowledge, and user support.
TradingView scores 3.25 for Support Infrastructure. This is not its strongest category, but it is adequate. TradingView users benefit from documentation, platform resources, community knowledge, scripts, and peer-shared workflows. Formal support is not the main reason to choose TradingView; the stronger argument is the platform’s depth and community ecosystem.
Finviz scores 1.25, which is weak compared with TradingView. Finviz is simple enough that many users may not need much support, but its low score reflects a limited support infrastructure compared to more comprehensive trading platforms. For self-directed users who want a quick screener, that may be acceptable; for traders needing deeper onboarding, TradingView is the stronger platform.
Who Should Choose Finviz?
Choose Finviz if your main priority is quickly screening U.S. stocks, reviewing heatmaps, identifying technical or fundamental setups, and monitoring the market without needing a complete trading platform. Finviz is particularly attractive for traders and investors who value speed, simplicity, and lower pricing over advanced charting or automation.
Who Should Choose TradingView?
Choose TradingView if you need advanced charting, global market coverage, Pine Script, backtesting, alerts, broker integration, multi-asset analysis, or a large trading community. It is better suited to active traders and technical analysts who want one platform for research, strategy development, monitoring, and trade execution.
Finviz vs TradingView: Final Comparison
Finviz and TradingView are both excellent platforms, but they solve different problems. Finviz is strongest as a fast free U.S. stock screener and market-visualization tool. TradingView is a much broader platform for charting, technical analysis, strategy development, alerts, global markets, and broker-connected trading.
In my 58-point benchmark, TradingView scored 4.75 versus 3.84 for Finviz. For traders who want a complete analysis and trading environment, TradingView offers more capability. For users primarily focused on stock screening, heatmaps, and rapid market research, Finviz remains a strong and lower-cost option.
