
My lab test results show TradingView excels in live trading, community, and global data, while TrendSpider’s strengths lie in real AI LLMs, pattern recognition, and code-free backtesting for US traders.
Lab Results
TradingView excels in all areas, and TrendSpider scores well for screening, news feeds, pattern recognition, and backtesting capabilities. TrendSpider excels at using AI to automate analysis, while TradingView’s strength lies in its global data coverage across all assets and its 20 million-strong social community.
Both platforms offer excellent charts and usability.
Let’s compare the two outstanding platforms head-to-head.
TradingView Lab Ratings
TradingView is the world’s premier trading platform, trusted by over 20 million active traders. It offers a seamless blend of powerful charting tools, advanced screening features, and in-depth analysis, covering a wide range of assets, including stocks, indices, ETFs, and cryptocurrencies.
| Test | Tier | Score | Average |
|---|---|---|---|
| Composite Lab Performance Score | AAA | 4.75 | 4.21 |
| Pricing Index: $ per Day | AA | $1.97 | $2.74 |
| Value Score (VP) | AA | 4.37 | 2.82 |
| Speed & Ease of Use | AAA | 5.00 | 4.50 |
| Chart Analysis Depth Index | AAA | 5.00 | 3.17 |
| Chart Pattern Depth & Accuracy | B | 3.98 | 2.73 |
| Scanning Performance | AAA | 4.83 | 3.38 |
| Backtesting Performance | A | 4.19 | 3.38 |
| Trading Bot & Auto-Trading Reliability | B | 3.50 | 2.50 |
| AI & Algo Index | A | 4.00 | 2.00 |
| Alert Speed | AA | 4.67 | 3.67 |
| Trade Signal Quality | C | 2.50 | 0.00 |
| Broker Connectivity & Ecosystem Depth | AAA | 5.00 | 1.55 |
| Portfolio Tool Performance | B | 3.60 | 2.80 |
| Financial News Speed & Depth | B | 3.00 | 2.30 |
| Community Utility Index (CUI) | AAA | 5.00 | 3.25 |
| Support Infrastructure & SLA Audit | B | 3.25 | 3.75 |
Tested using benchmarking system v3.
See the 2026 v3 58-point TradingView test and benchmarks.
Pros
✔ 20 million users sharing ideas
✔ AAA Speed & ease of use
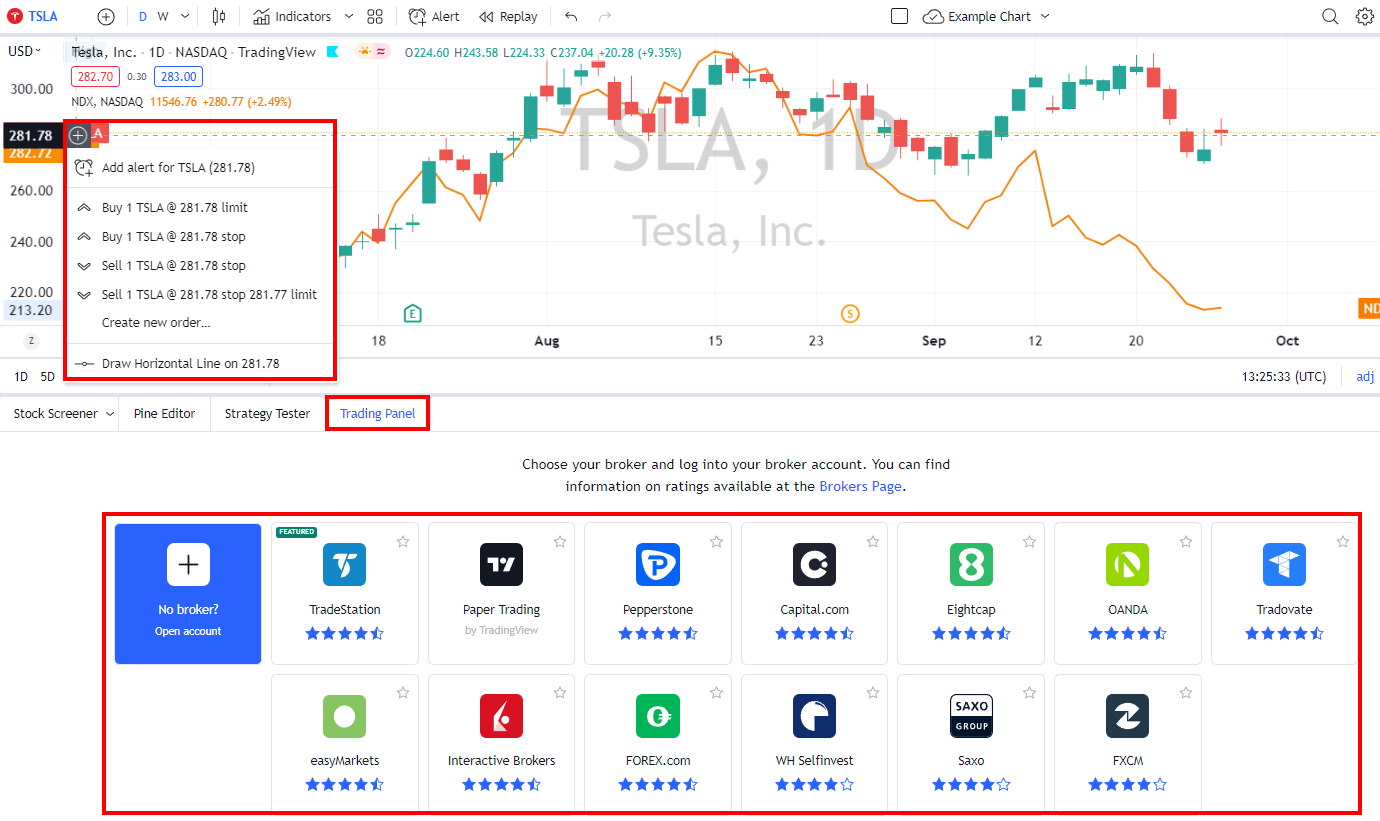
✔ Trading from charts
✔ Powerful screening and technical analysis
✔ All stock exchanges globally
✔ AAA Broker connectivity and asset coverage
✔ 100,000+ user-generated strategies
✔ Free and low-cost plans
✔ Flexible backtesting with Pine Script
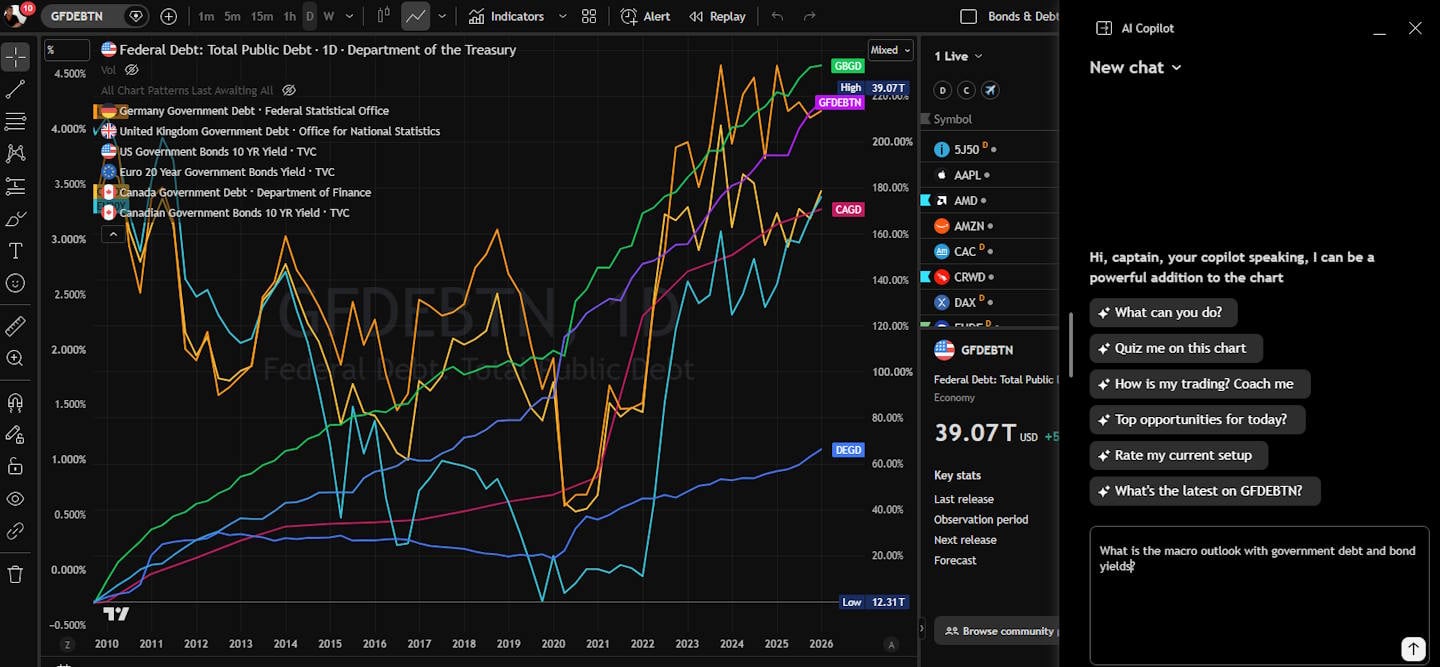
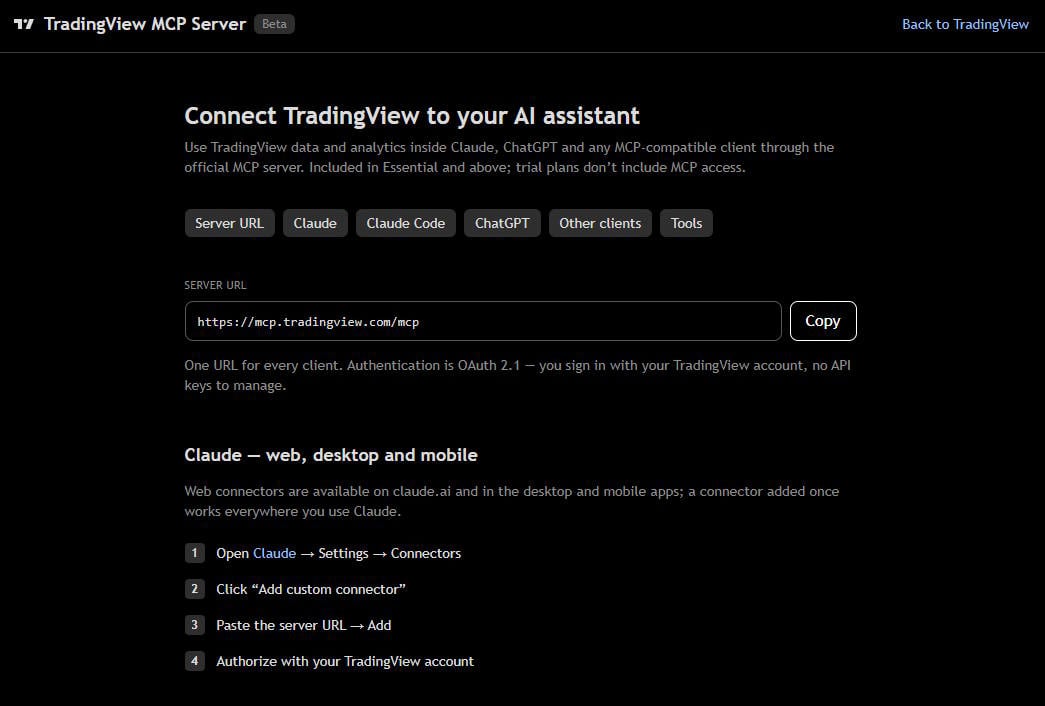
✔ New ChatBot & AI MCP Servers
Cons
✘ Not ideal for value or dividend investors
✘ Coding skills required for backtesting and custom indicators
✘ Average portfolio tools

TradingView provides best-in-class technical analysis tools to analyze financial markets. It offers heatmaps, super charts, indicators, strategy development tools, and backtesting capabilities.
Its vibrant community of traders shares ideas, strategies, and custom indicators, making it an invaluable resource for learning and collaboration.
| Features | TradingView |
| Composite Lab Performance Score | 4.75 |
| ⚡ Features | Charts, News, Watchlists, Screening |
| 🏆 Unique Features | Trading, Backtesting, Community |
| 🎯 Best for | Stock, FX & Crypto Traders |
| ♲ Subscription | Monthly, Yearly |
| 💻 OS | Web Browser|Windows |
| 🌎 Region | Global |
TrendSpider Lab Ratings
My research reveals that TrendSpider is an excellent choice for US traders seeking AI-driven tools for charting, pattern recognition, and backtesting across stocks, indices, futures, and currencies. The platform stands out by automatically detecting trendlines, Fibonacci levels, and candlestick patterns. With its robust backtesting capabilities and multi-timeframe analysis, TrendSpider is particularly well-suited for seasoned technical traders looking to refine their strategies.
| Test | Tier | Score | Average |
|---|---|---|---|
| Composite Lab Performance Score | AAA | 4.72 | 4.21 |
| Pricing Index: $ per Day | A | $2.70 | $2.74 |
| Value Score (VP) | A | 4.17 | 2.82 |
| Speed & Ease of Use | AA | 4.67 | 4.50 |
| Chart Analysis Depth Index | A | 4.03 | 3.17 |
| Chart Pattern Depth & Accuracy | AAA | 4.88 | 2.73 |
| Scanning Performance | AA | 4.67 | 3.38 |
| Backtesting Performance | AAA | 4.88 | 3.38 |
| Trading Bot & Auto-Trading Reliability | AA | 4.50 | 2.50 |
| AI & Algo Index | AAA | 5.00 | 2.00 |
| Alert Speed | AA | 4.33 | 3.67 |
| Trade Signal Quality | C | 0.00 | 0.00 |
| Broker Connectivity & Ecosystem Depth | AA | 4.43 | 1.55 |
| Portfolio Tool Performance | C | 2.10 | 2.80 |
| Financial News Speed & Depth | AA | 4.50 | 2.30 |
| Community Utility Index (CUI) | B | 3.75 | 3.25 |
| Support Infrastructure & SLA Audit | AA | 4.50 | 3.75 |
How We Test Trading Tools: Rating system V3.
See the 2026 v3 58-point TrendSpider Lab-test and benchmarks.
Pros
✔ 150+ chart and candle patterns recognized
✔ True AI Model Training & Deployment
✔ AAA Point-and-click backtesting
✔ Auto-trading bots
✔ Multi-timeframe analysis
✔ Real-time data included
✔ US Stocks, ETFs, Forex, Crypto, & Futures
✔ Seasonality charts, options flow
✔ News & analyst ratings change scanning
✔ 1-on-1 training included
Cons
✘ Not ideal for value or dividend investors
✘ No social community or copy-trading
✘ Limited portfolio management tools
TrendSpider stands out by leveraging AI and machine learning to streamline traders’ workflow, bringing automated trend and pattern recognition to the forefront. With TrendSpider, traders gain access to advanced analysis and strategy-testing capabilities that surpass manual efforts in both scale and efficiency.
| Features | TrendSpider |
| Composite Lab Performance Score | 4.72 |
| ⚡ Features | Charts, News, Watchlists, Screening |
| 🏆 Unique Features | AI Pattern Recognition, Trading, Point-and-Click Backtesting |
| 🎯 Best for | Stock, FX & Crypto Traders |
| ♲ Subscription | Monthly, Yearly |
| 💻 OS | Web Browser |
| 🌎 Region | USA |
Pricing & Discounts
TradingView offers free and more affordable premium services.
TradingView pricing starts at $0 for the Basic, ad-supported plan, which includes ad-supported screening, charting, trading, scripting, backtesting, and three indicators per chart. The Free plan is a great way to test the service.
TradingView Essential costs $12.95/mo on an annual plan and is ad-free. It includes two charts per layout, five indicators per chart, and 20 alerts. It is ideal for beginners and also enables access to the full social network.
The annual Plus Plan at $29.95/mo adds four charts per tab, 100 alerts, and advanced Renko, Kagi, Point & Figure, and Line Break charts.
I personally use TradingView Premium at $59.95/mo annually; it offers the optimal balance of price and key functionality: 25 indicators per chart, 400 alerts, and, most importantly, automated chart pattern recognition.
It is designed for intermediate and advanced-level traders who seek the optimal balance between functionality and price.
See our TradingView Pricing Guide for further details and discounts.
To get a 16% discount on TradingView, sign up for an annual subscription. Find out more in our dedicated TradingView discounts guide. Alternatively, -17% on yearly plan + $15 Discount
All TrendSpider plans include real-time data, futures, AI-powered pattern recognition, backtesting, news, options, crypto, and even automated bot trading with broker integration.
- The Standard plan gives access to all features for $82 per month, which drops to $54 if you pay yearly.
- I recommend Premium, which costs $137 and drops 44% to $91 if you pay yearly.
- Adding our partner code LST30 during checkout will save an additional 30% on your first year.
| TrendSpider Pricing | Monthly | Monthly on Annual Plan |
| Standard (Casual Traders) | $82 | $54 |
| Premium (Active Traders) | $137 | $91 |
| Enhanced (Scalpers & Day Traders) | $197 | $122 |
| Advanced (Quants & Institutions) | $321 | $214 |
| Additional Year 1, 30% Discount | -30% With Code LST30 | |
TrendSpider Coupon Code Discount
TrendSpider discount coupon code “LST30” is verified and valid, granting a 30% discount on all plans. Use coupon code “LST30” at checkout.
Using this coupon on a TrendSpider monthly subscription could save you over $2,400.
- Read this article for a step-by-step guide to claiming your 30% TrendSpider discount.
Our 4.72 ⭐ Rated Trading Tool
✅ Automated Charts & Research
✅ AI Benchmark Winner
Deal Ends In:
Chart Analysis
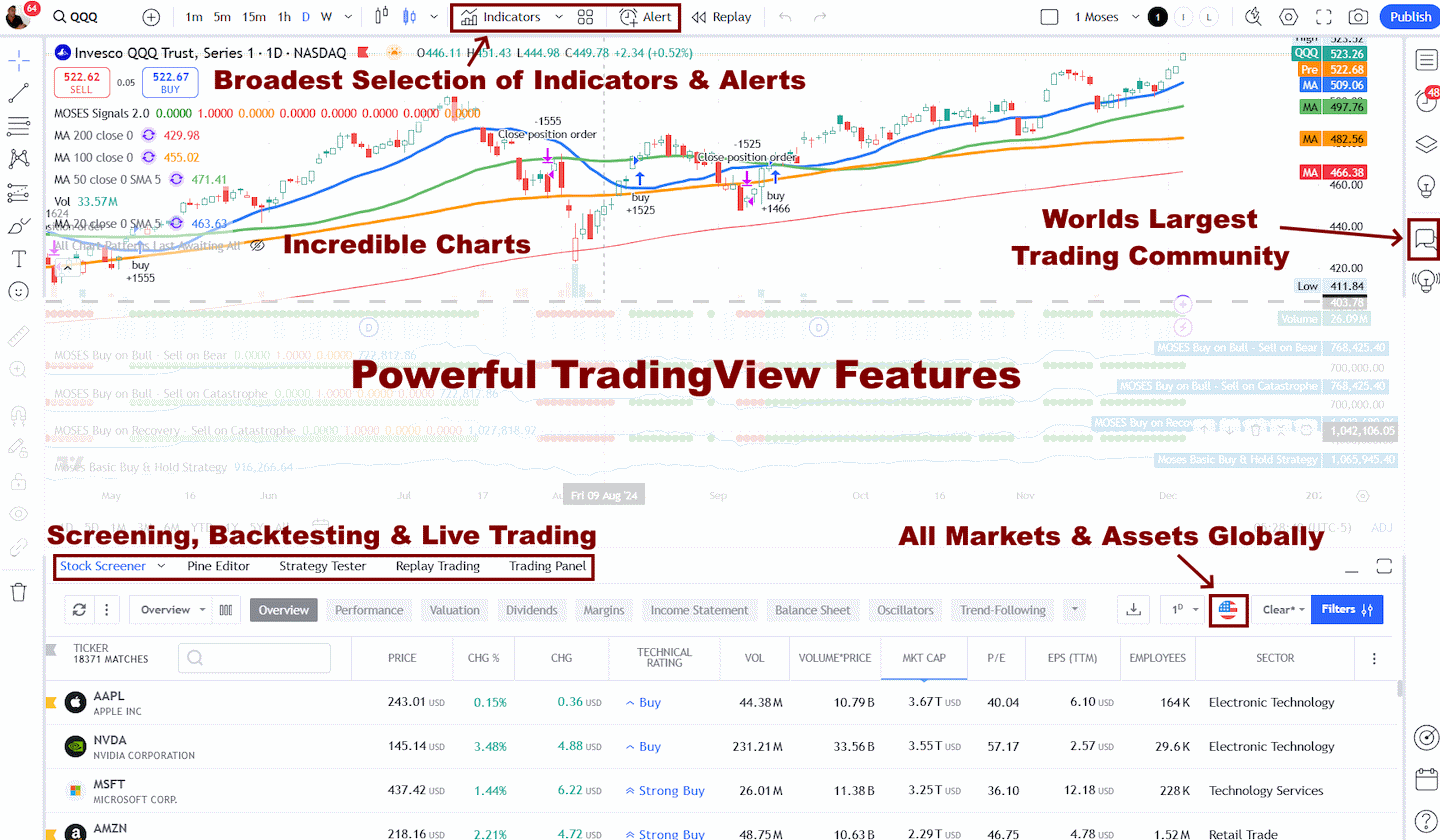
TradingView Chart Analysis Depth scored a perfect 5.00, offering 21 chart types, 400 indicators, 5.00 chart depth, 5.00 indicator depth, and 5.00 custom indicator coding through Pine Script. So TradingView is the better pure charting platform
TradingView offers broad, powerful chart analysis features. TradingView has 160 indicators and unique specialty charts such as LineBreak, Kagi, Heikin Ashi, Point & Figure, and Renko.

| Key Features | TradingView |
|---|---|
| Chart Analysis Depth Index | 5.00 |
| Chart Pattern Depth & Accuracy | 3.98 |
| Alert Speed | 4.67 |
| Global Market Data | ✔ |
| Real AI & Machine Learning | ✘ |
| Powerful Charts | ✔ |
| Stocks | ✔ |
| Futures | ✔ |
| Forex | ✔ |
| Cryptocurrency | ✔ |
| Social Community | ✔ |
| Real-time News | ✘ |
| Screeners | ✔ |
| Backtesting | ✔ |
| Code-Free Backtesting | ✘ |
| Automated Analysis | ✔ |
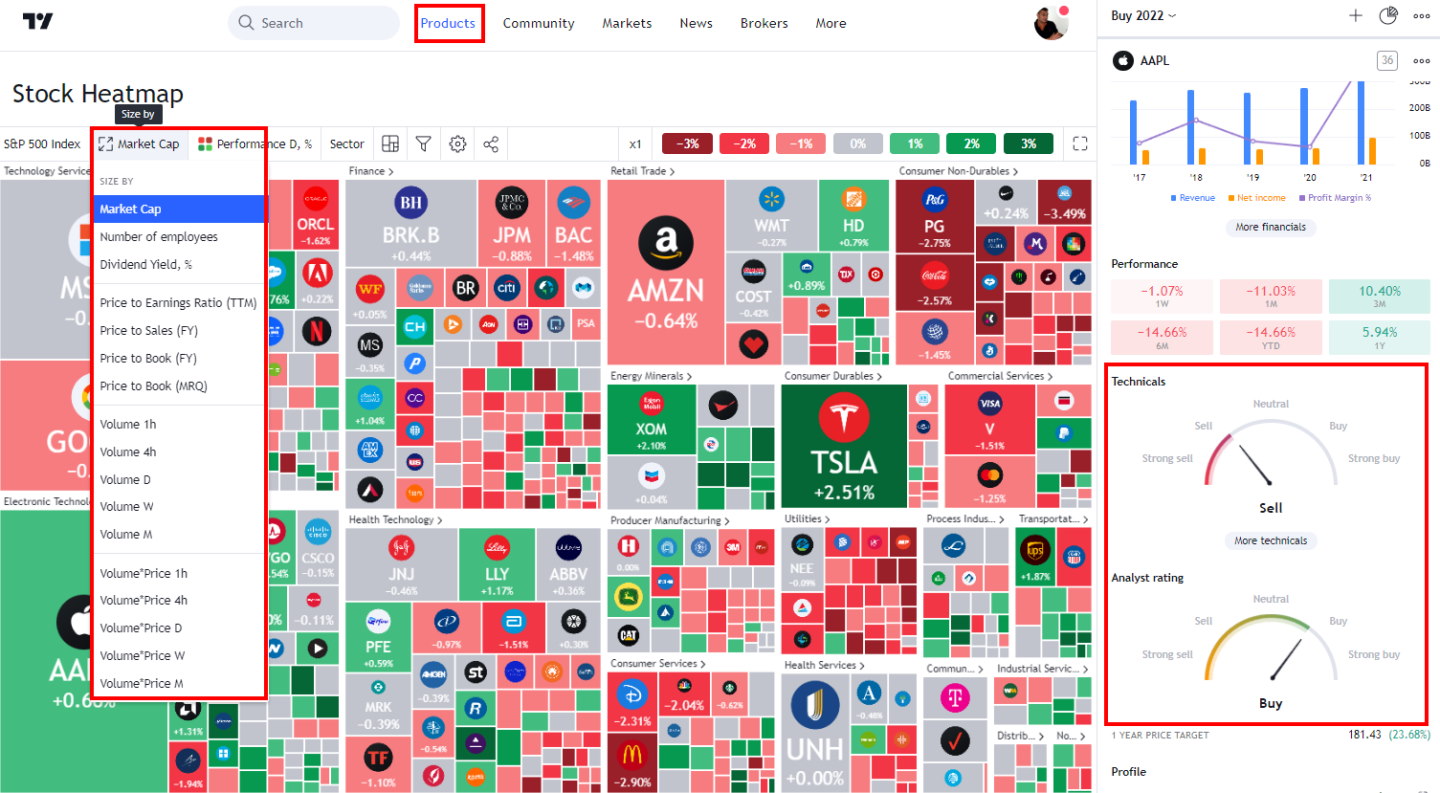
TradingView’s innovative Buy and Sell gauges save you time by providing an instant readout of which stocks are bullish, bearish, or neutral.
TradingView’s stock indicator ratings are well implemented, with two critical technical analysis indicators: price-based moving averages and price- and volume-based oscillators. Based on my observations, the TradingView buy and sell indicators are a good measure of sentiment and are featured in my Fear & Greed Index Dashboard.
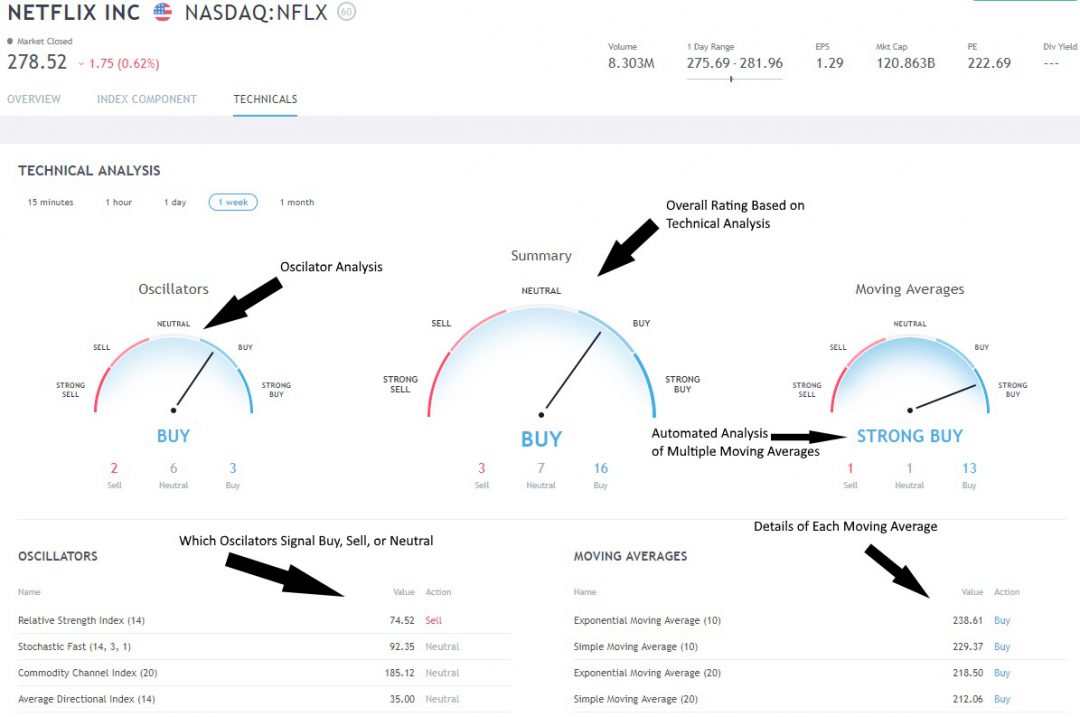
You can click “Technicals” to see three gauges on a chart. The left gauge shows the oscillating indicators, such as Relative Strength, Stochastics, and the Average Directional Index. On the right, you have a selection of Moving Averages, Simple, Exponential, and even Ichimoku Cloud.
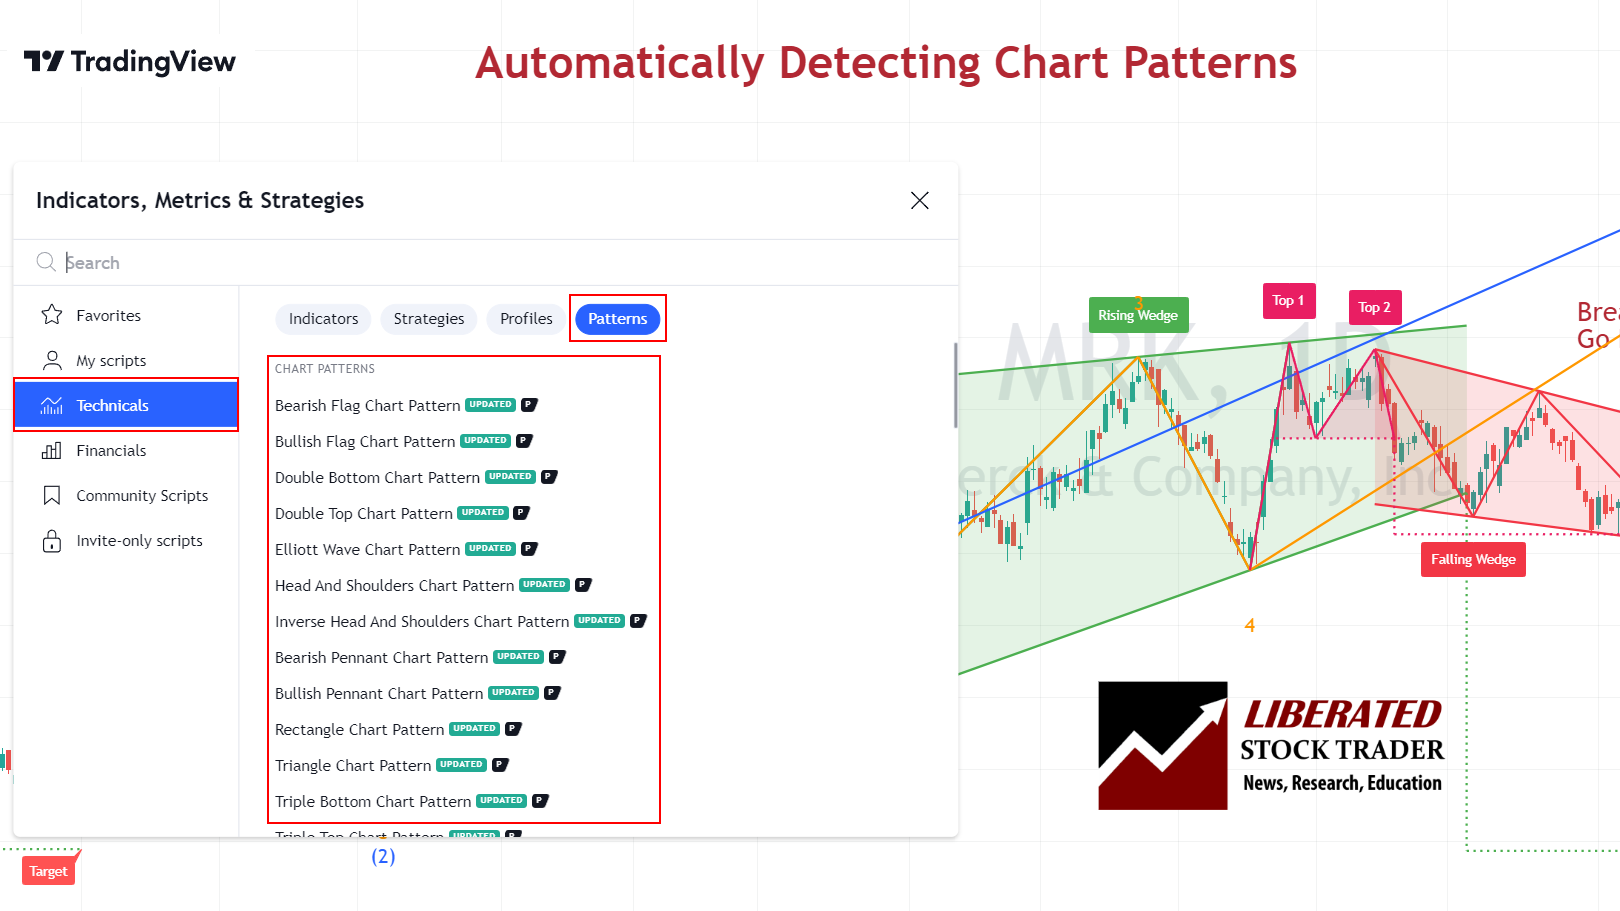
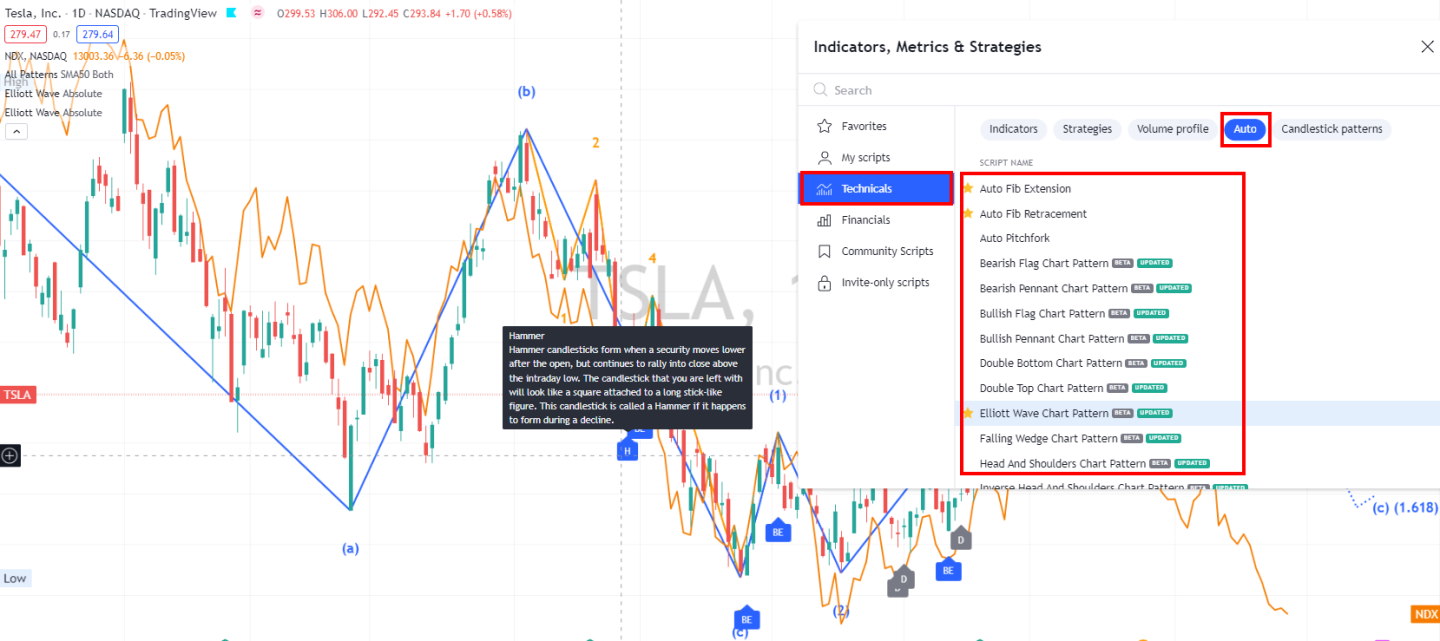
TradingView’s Chart Pattern Depth & Accuracy scored 3.98. TradingView recognizes 97 total patterns, including 44 candlestick patterns and 53 price/trend patterns, with an excellent 95% accuracy scoring 4.75 accuracy points. TradingView is excellent for charting and manual-plus-automated analysis.
TrendSpider charting is strong, with 12 chart types, 140 indicators, 3.60 chart depth, 3.50 indicator depth, and 5.00 custom indicator coding. TrendSpider is the better automation-aware charting platform.
TrendSpider offers over 200 chart indicators and patterns, including line, bar, candlestick, Heiken Ashi, and patented Raindrop charts. TradingView has an exceptional selection of chart drawing tools, including tools unavailable on other platforms. These include extensive Gann & Fibonacci tools, 65 drawing tools, 23 different chart annotation tools, and hundreds of icons for your charts, notes, and ideas.

| Key Features | TrendSpider |
|---|---|
| Chart Analysis Depth Index | 4.03 |
| Chart Pattern Depth & Accuracy | 4.88 |
| Alert Speed | 4.33 |
| Global Market Data | USA & Canada |
| Real AI & Machine Learning | ✔ |
| Powerful Charts | ✔ |
| Stocks | ✔ |
| Futures | ✔ |
| Forex | ✔ |
| Cryptocurrency | ✔ |
| Social Community | ✘ |
| Real-time News | ✘ |
| Screeners | ✔ |
| Backtesting | ✔ |
| Code-Free Backtesting | ✔ |
| Automated Analysis | ✔ |
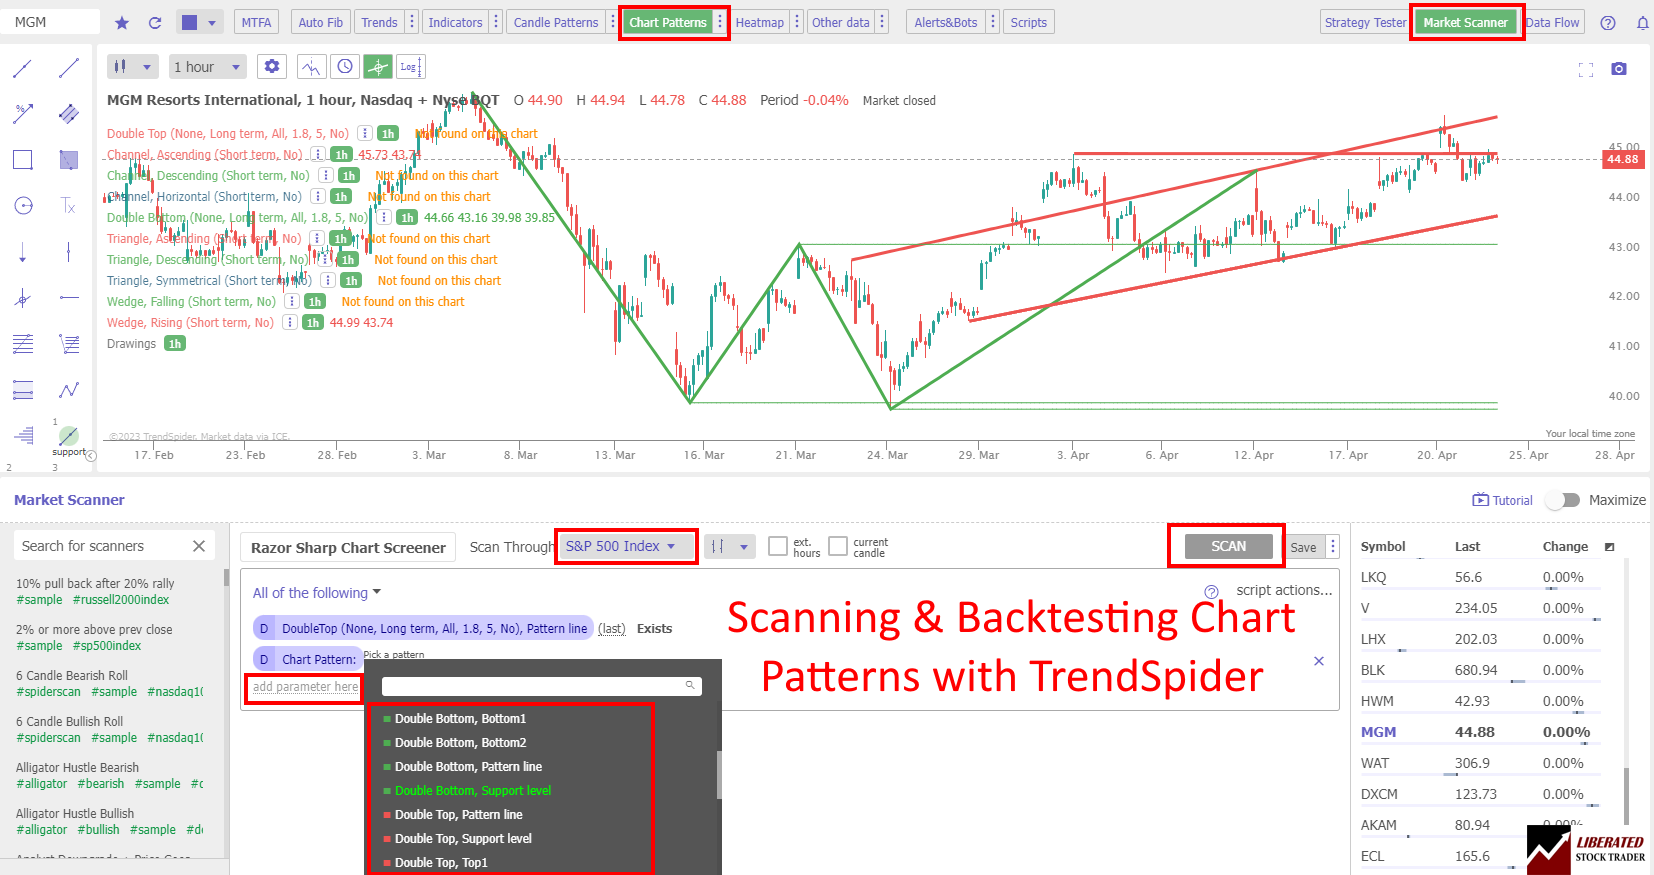
TrendSpider wins Chart Pattern Depth & Accuracy, scoring 4.88. TrendSpider recognized 226 total patterns, including 172 candlestick patterns and 54 chart price/trend patterns, with 95% accuracy and 4.75 accuracy points. TrendSpider is the superior choice for automated pattern discovery at scale.
TrendSpider’s automated trendline detection saves traders a lot of time, speeds up morning trade review preparation, and improves accuracy.
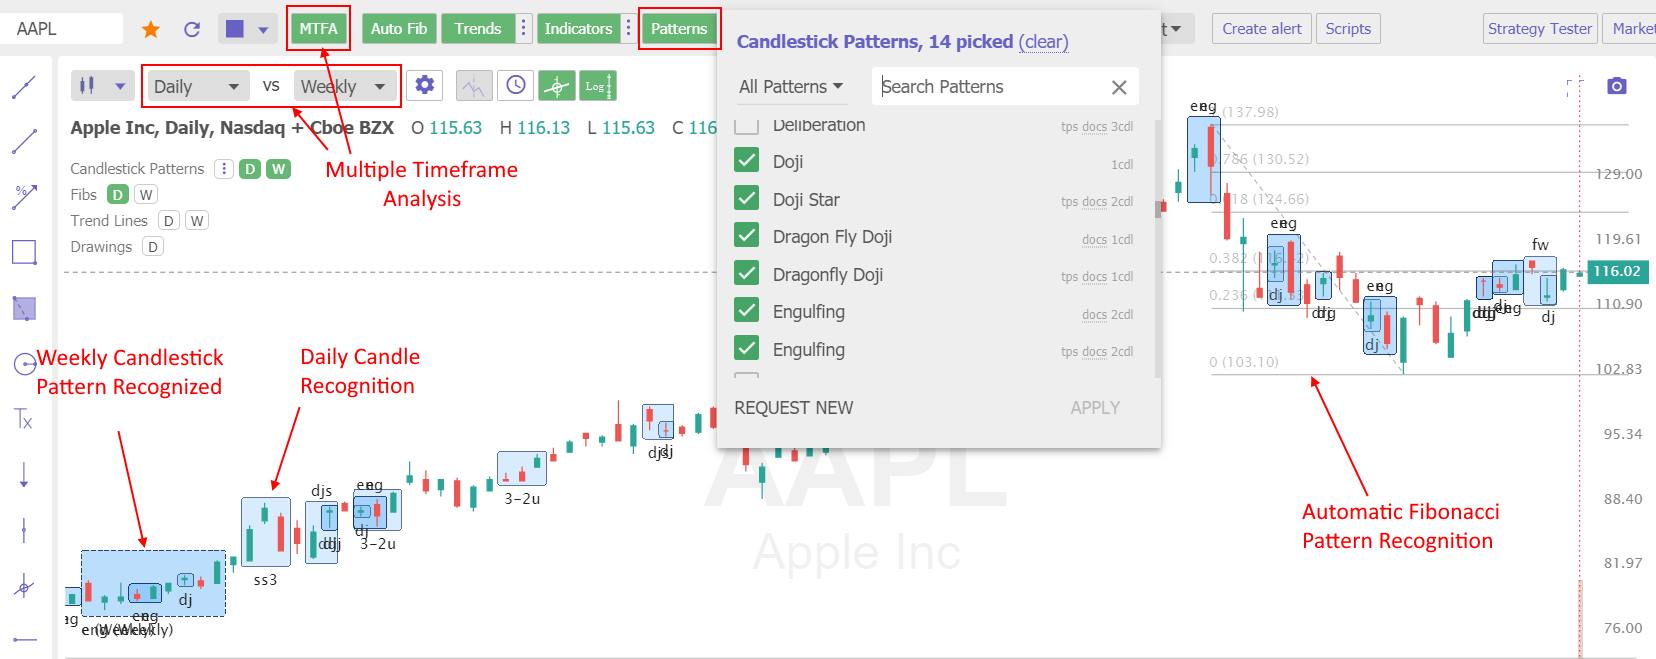
TrendSpider’s automated chart trendline detection and plotting do a better job than a human can. TrendSpider’s algorithms can detect thousands of trendlines and flag the most important ones with the highest backtested probability of success.
TrendSpider’s automated trendline detection saves traders a lot of time, speeds up morning trade review preparation, and improves accuracy. TrendSpider’s algorithm correlates all bars on a chart and automatically draws trendlines, ready for your review.
Multi-timeframe analysis means viewing multiple timeframes on a single chart, with trendlines plotted automatically. Another great feature is the advanced plotting of support and resistance lines into a subtly integrated chart heatmap. TrendSpider’s multi-timeframe analysis is not just for trendlines; it works with 42 stock chart indicators to ensure you do not miss anything.
Scanning
TradingView wins Scanning Performance overall, scoring 4.83. TradingView’s edge is raw speed: it scanned the S&P 500 across five criteria in 7 ms, earning a perfect 5.00 Scanning Speed score. It also offers 360 scanning criteria, with 4.50 for criteria depth and 5.00 for Custom Code Scanning. In practical terms, TradingView is the faster all-around scanner, especially for traders who want broad market coverage across stocks, ETFs, Forex, futures, and crypto from one platform.
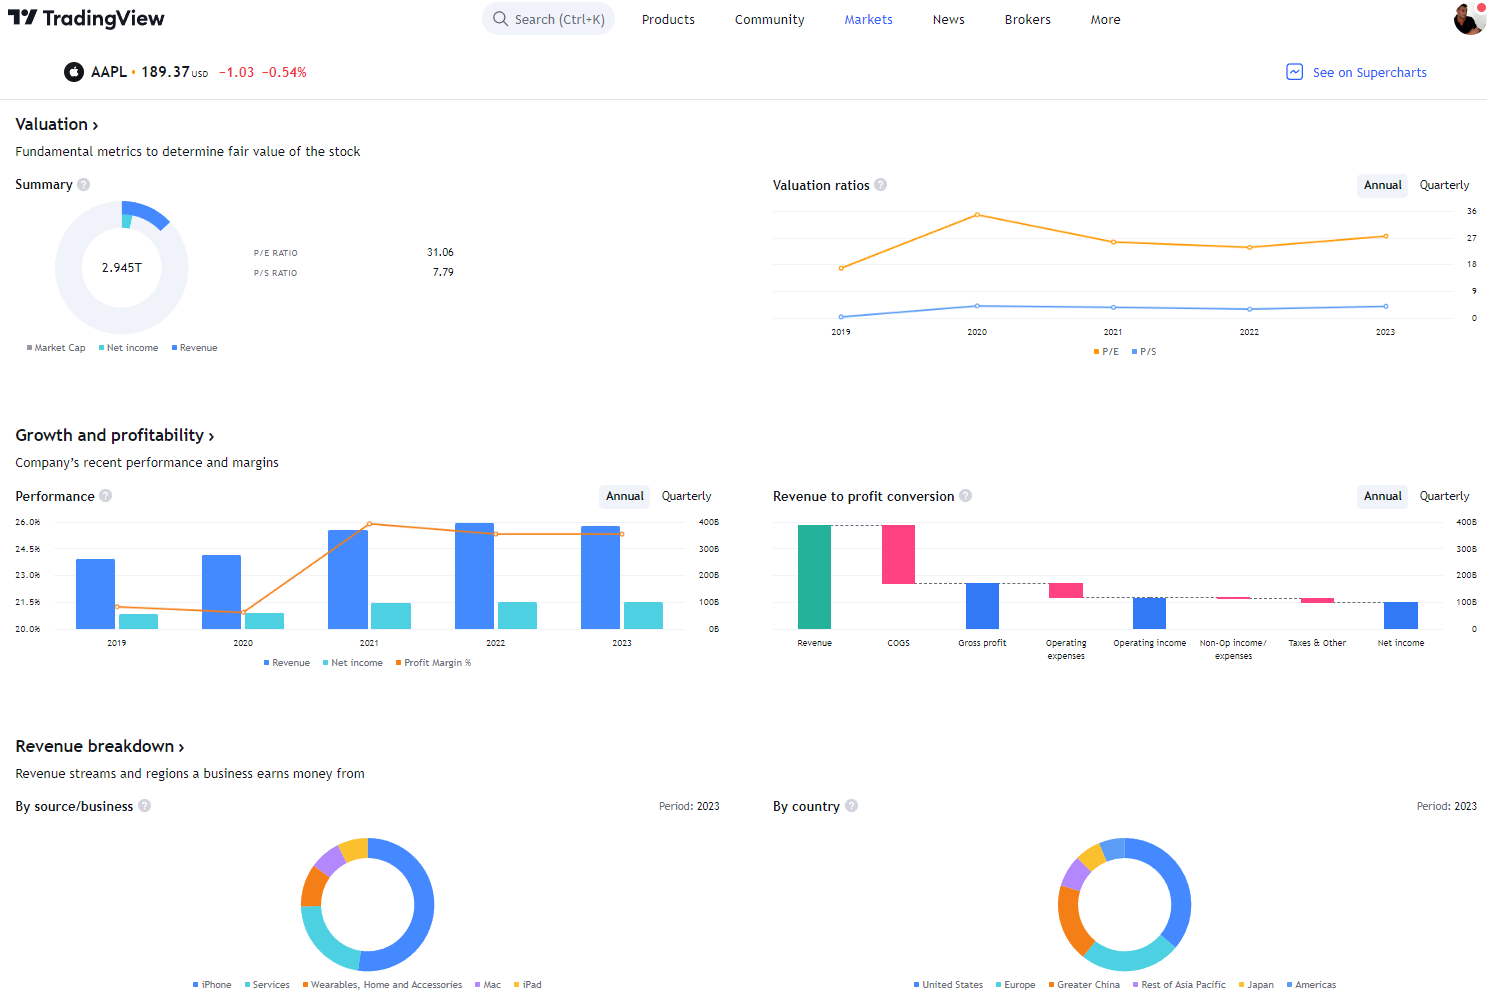
The TradingView stock screener comes complete with 160 fundamental and technical screening criteria. All the usual criteria are there, such as EPS, Quick Ratio, Pre-Tax Margin, and PE Ratio. But it also goes into greater depth with more esoteric criteria, such as the number of employees, goodwill, and enterprise value.
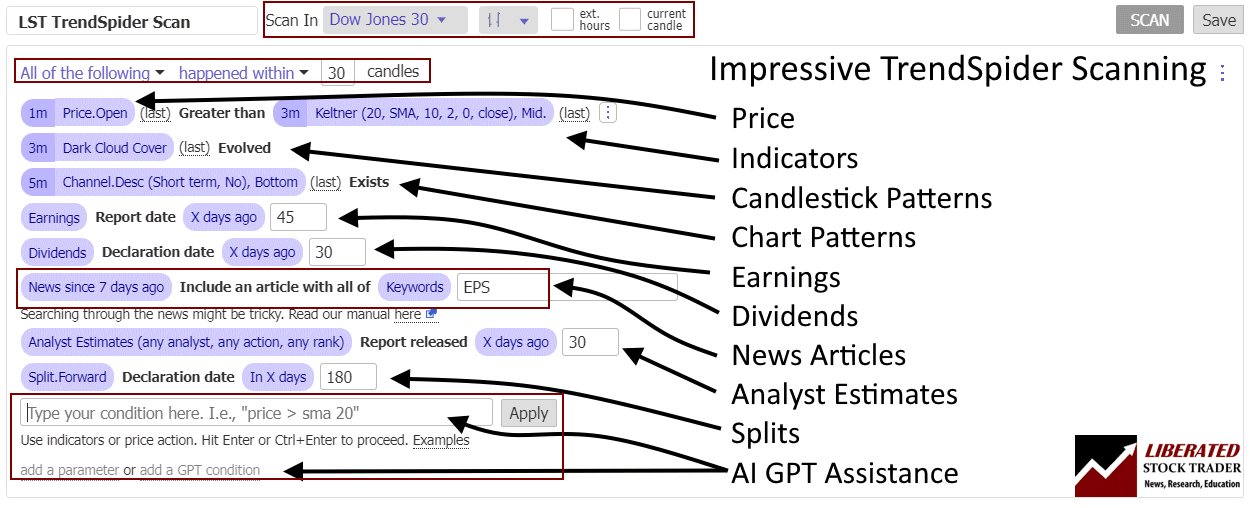
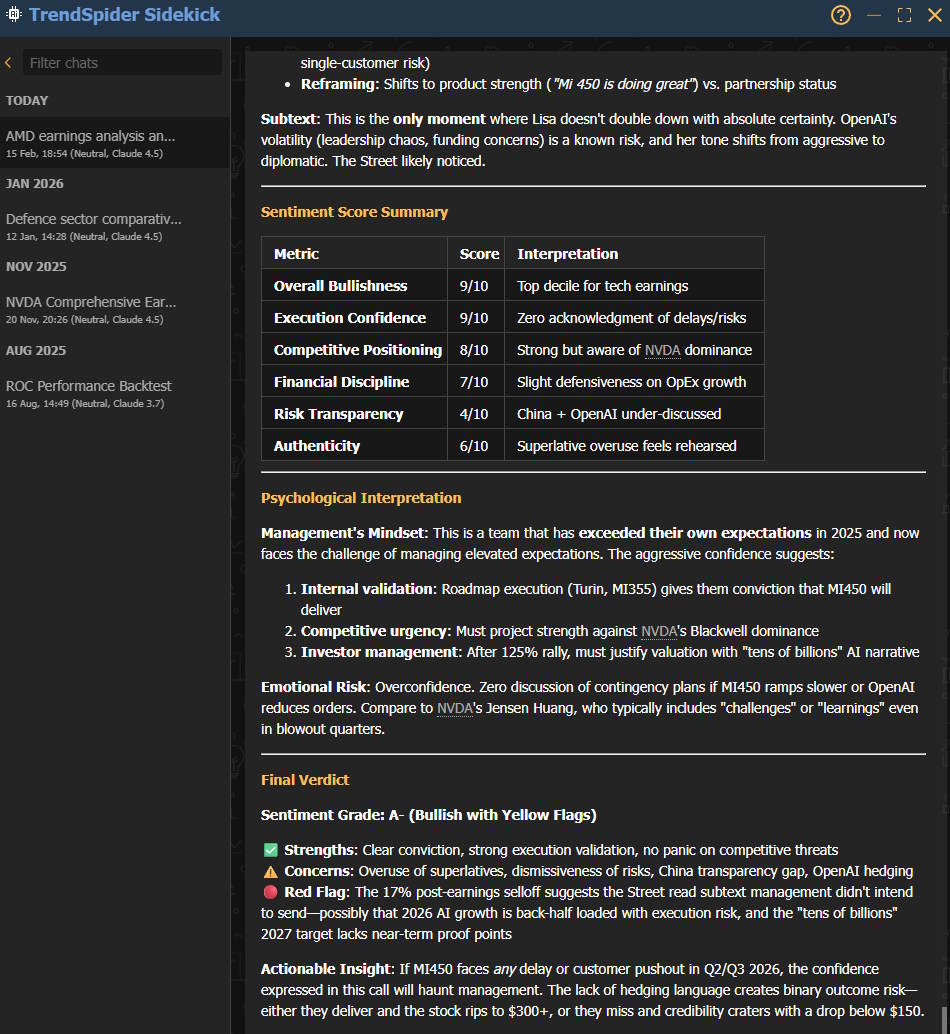
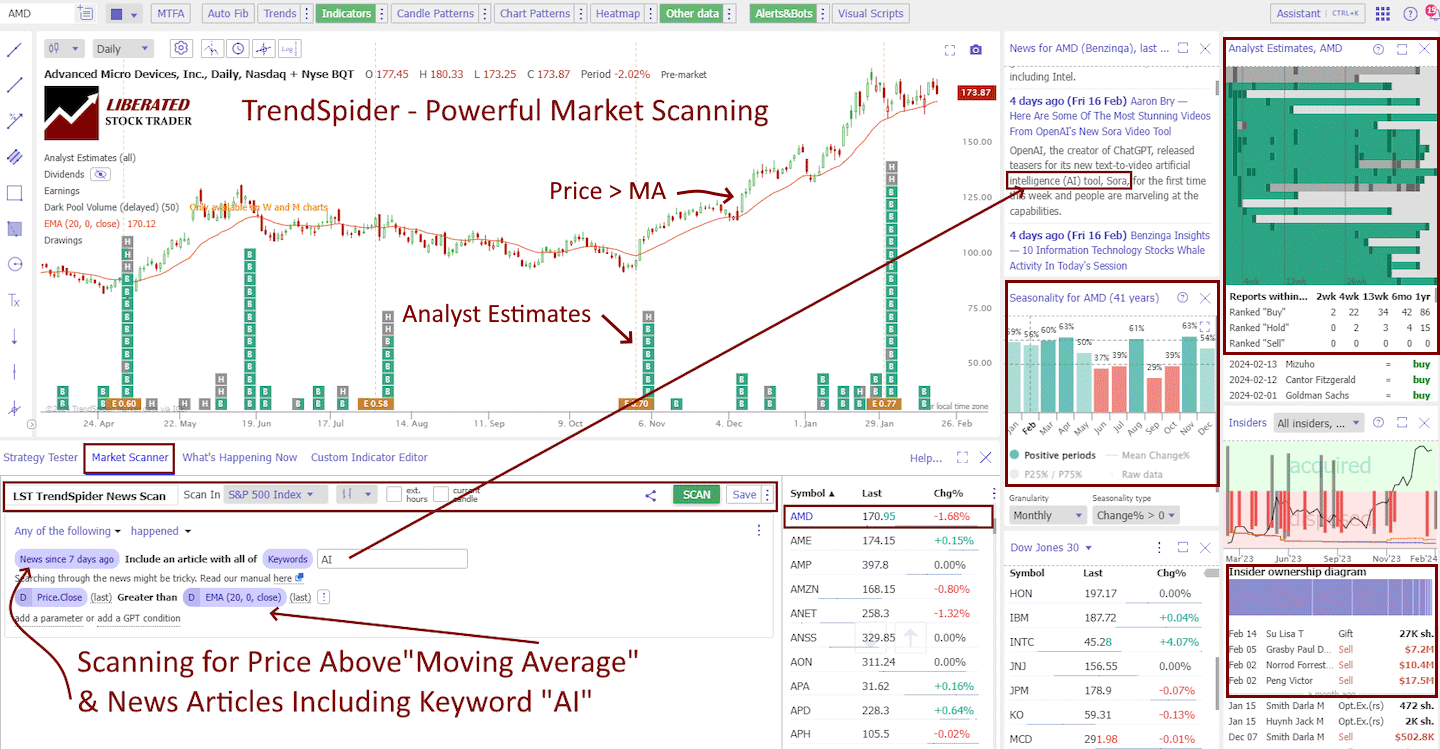
TrendSpider is only slightly behind in the headline-scanning score, but its strength lies in technical scan intelligence rather than pure latency. It scored 4.67, with 375 ms scanner performance, 4.00 scanning speed, 420 scanning criteria, a perfect 5.00 criteria-depth score, and 5.00 Custom Code Scanning. That means TrendSpider is for traders who want rich technical criteria, automated trend analysis, chart-pattern scans, analyst-estimate filters, and news-event scans inside a point-and-click workflow.
For example, you can scan for companies that report earnings in the next seven days, that analysts expect to post a positive earnings surprise, and that news reports mention “AI.”
TrendSpider’s Market Scanner enables you to scan a specific stock and the entire market for stocks that match your technical criteria. Combining AI trend detection and analysis with the ability to scan the whole stock market is powerful.
Brokers, AI & Algo Trading
TradingView supports 50 high-quality brokers, enabling tight integration so you can trade directly from charts and view your profits and losses in TradingView. TradingView focuses on user-created indicators and automated systems built with Pine Script.
TradingView provides greater flexibility for traders who prefer to build and customize their own algorithmic trading strategies.
| Lab Test Ratings | TradingView |
|---|---|
| Trading Bot & Auto-Trading Reliability | 3.50 |
| AI & Algo Index | 3.00 |
| Trade Signal Quality | 2.50 |
| Broker Connectivity & Ecosystem Depth | 5.00 |
TradingView offers powerful screening, custom indicators, and automated strategies via Pine Script; most of the intelligence comes from user-created algorithms rather than built-in AI automation. TradingView excels as a flexible charting platform where traders can design, test, and deploy their own trading ideas.
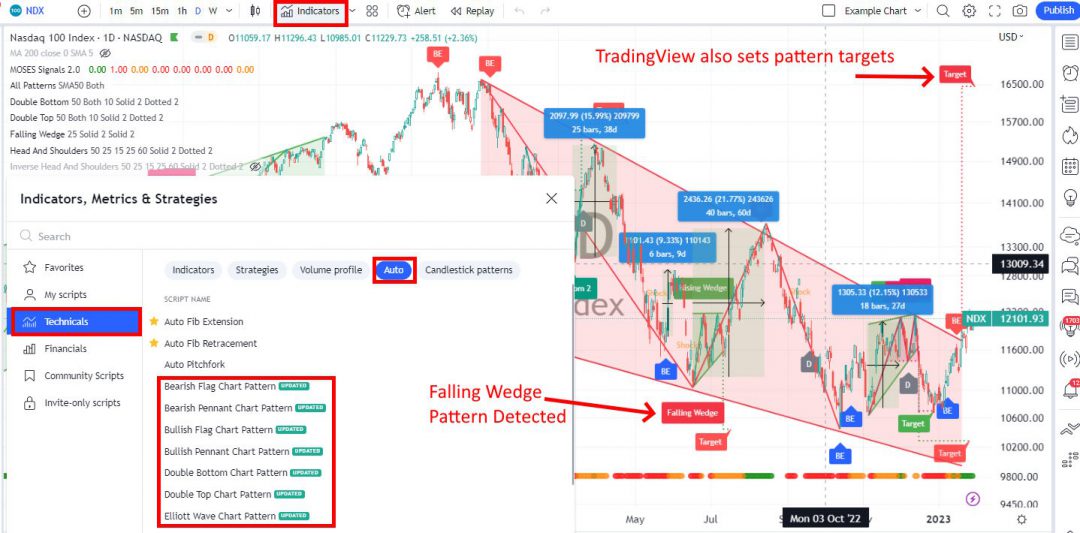
TradingView offers tremendous flexibility. For investors and traders seeking turnkey AI-powered analysis and automation
TrendSpider integrates with 25 brokers, and you can launch trading bots to automate your stock, Forex, or crypto trading.
| Lab Test Ratings | TrendSpider |
|---|---|
| Trading Bot & Auto-Trading Reliability | 4.50 |
| AI & Algo Index | 5.00 |
| Trade Signal Quality | 0.00 |
| Broker Connectivity & Ecosystem Depth | 4.43 |
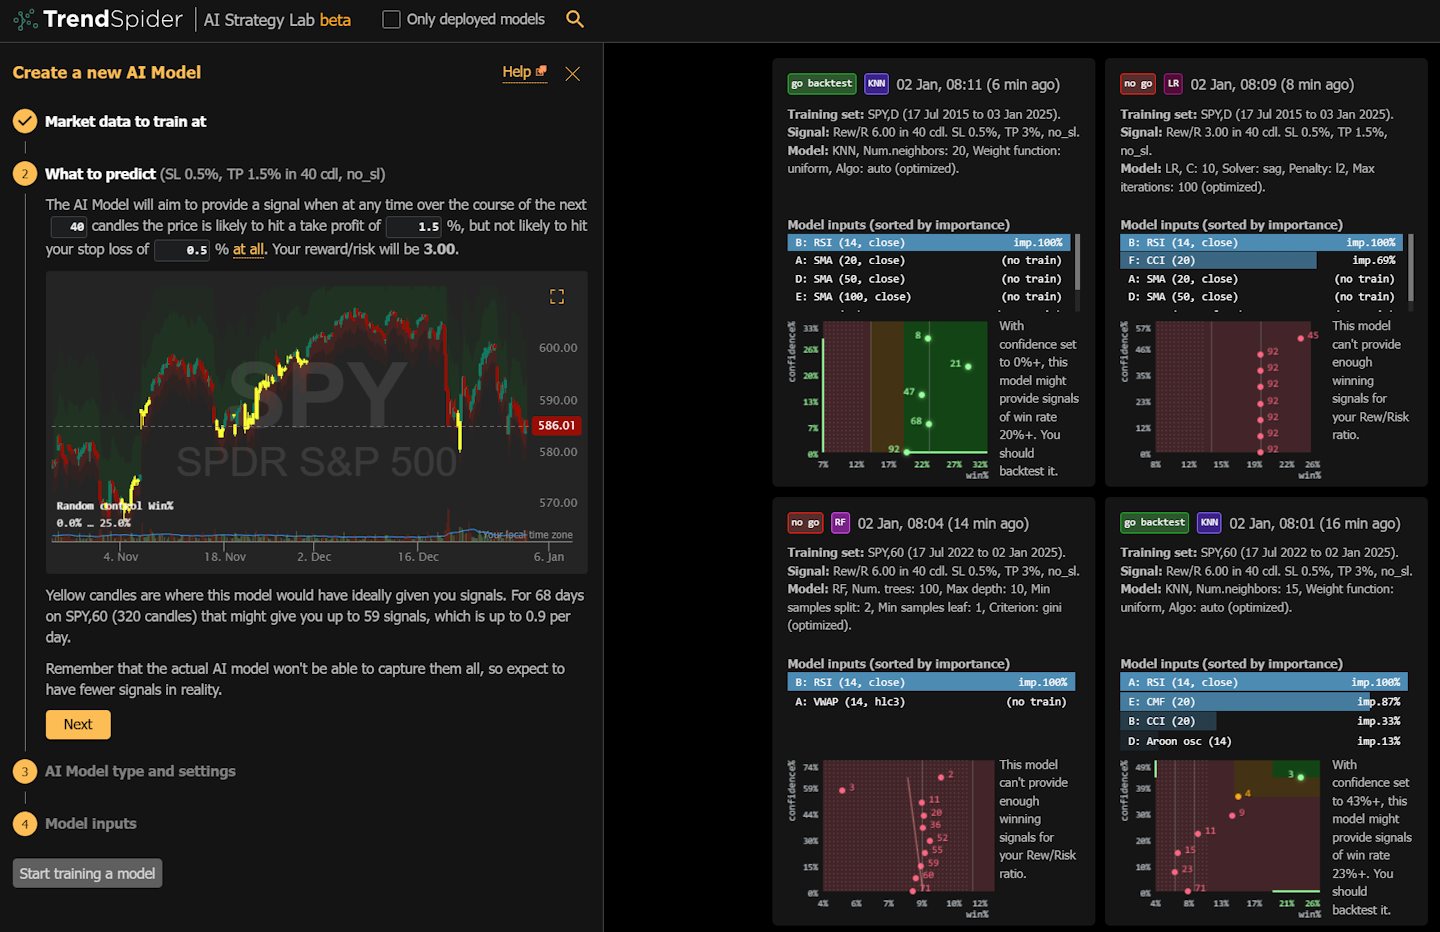
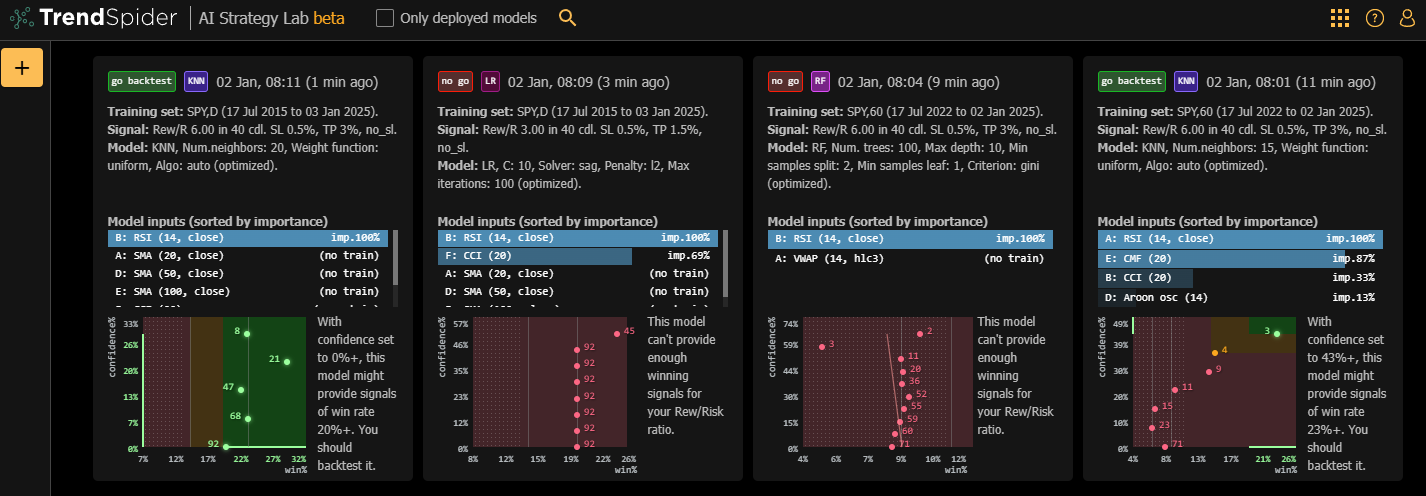
TrendSpider offers built-in AI-powered pattern recognition, automated trendline analysis, and no-code strategy automation, while automatically scanning the market for chart patterns and trading opportunities.
TrendSpider is a clear leader in AI-powered chart analysis and algorithmic trading capabilities. Its platform uses artificial intelligence to automatically detect trendlines, support and resistance levels, candlestick formations, and chart patterns without requiring manual drawing. The system can continuously scan thousands of stocks, identify trading opportunities, generate alerts, and automatically test strategies against historical data.
This combination of AI-driven market analysis, automated pattern recognition, and no-code strategy development earned TrendSpider a perfect AI & Algorithmic Trading score of 5.00 in my testing. For traders seeking automation and data-driven decision-making, TrendSpider significantly reduces the time required for technical analysis while increasing market coverage.
News & Community
TradingView wins decisively for community, education, and shared trading workflows.
TradingView has the best community. It scores a perfect 5.00 for Community Utility. TradingView has a global social ecosystem with published chart ideas, shared indicators, scripts, and community strategies.
TradingView’s financial news speed scored 3.00 with a news delay of 60–300 seconds. TradingView’s news is useful, but it behaves more like a research-friendly aggregator than a breaking-news terminal.
| Lab Test Ratings | TradingView |
|---|---|
| Financial News Speed & Depth | 3.00 |
| Community Utility Index (CUI) | 5.00 |
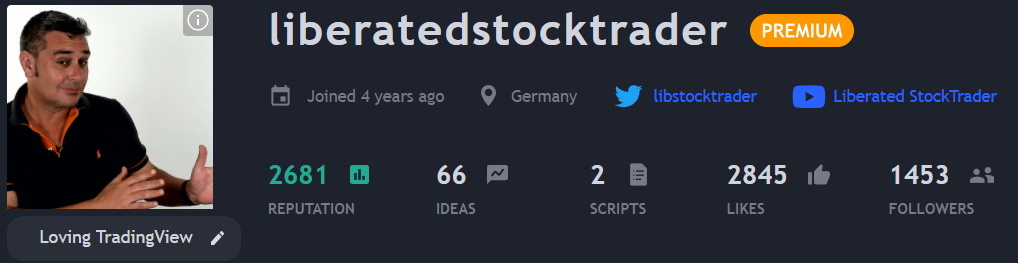
Check out my published ideas on TradingView and follow me for stock market analysis ideas and commentary.
TrendSpider wins financial news speed, scoring 4.50. In my benchmark, TrendSpider’s estimated news delay is 15–45 seconds; that makes TrendSpider better for catalyst-aware traders who want faster news integrated into a technical workflow. Plus, you can also set up screeners to scan the news, analyst estimates, or announcements, which makes it incredibly useful.
| Lab Test Ratings | TrendSpider |
|---|---|
| Financial News Speed & Depth | 4.50 |
| Community Utility Index (CUI) | 3.75 |
TrendSpider’s Community Utility scored 3.75, with a smaller community that leans more toward automation.
Strategy Backtesting
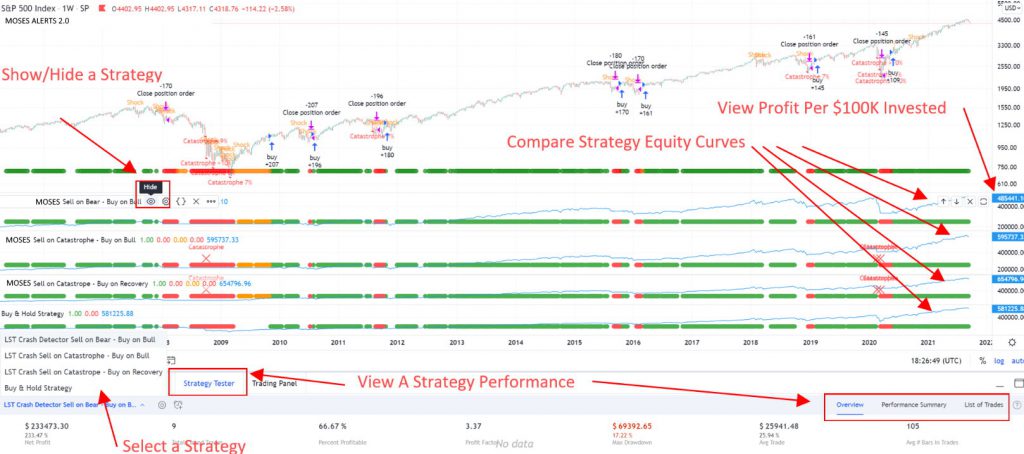
TradingView is a strong backtesting tool, but it is code-dependent. It scores 4.19, with outstanding 7 ms backtest speed and 5.00 speed points, but its no-code backtesting score is 0.00. In practice, TradingView is excellent for traders comfortable with Pine Script and single-instrument strategy testing.
| Lab Test Ratings | TradingView |
|---|---|
| Scanning Performance | 4.83 |
| Backtesting Performance | 4.19 |
TradingView has a backtesting system called Strategy Tester, but you must develop scripting skills using the proprietary Pine code to develop original backtesting systems. I have even implemented my MOSES ETF Trading strategy into TradingView; I am no developer, but the Pine Script language is so natural that anyone can do it.
TrendSpider is an excellent backtesting platform scoring 4.88. TrendSpider’s advantage is not raw speed alone; it is the complete testing workflow. It delivered 167 ms backtesting speed, 4.50 speed points, 5.00 no-code backtesting, 5.00 flexible coding backtesting, 100% report quality, 5.00 report-quality points, and 5.00 multi-stock basket backtesting. That makes it a top choice for traders who want to test strategies quickly without having to code first.
| Lab Test Ratings | TradingView | TrendSpider |
|---|---|---|
| Scanning Performance | 4.83 | 4.67 |
| Backtesting Performance | 4.19 | 4.88 |
TrendSpider has made this process much simpler by implementing a point-and-click system that eliminates the need for coding and enables backtesting of scans.
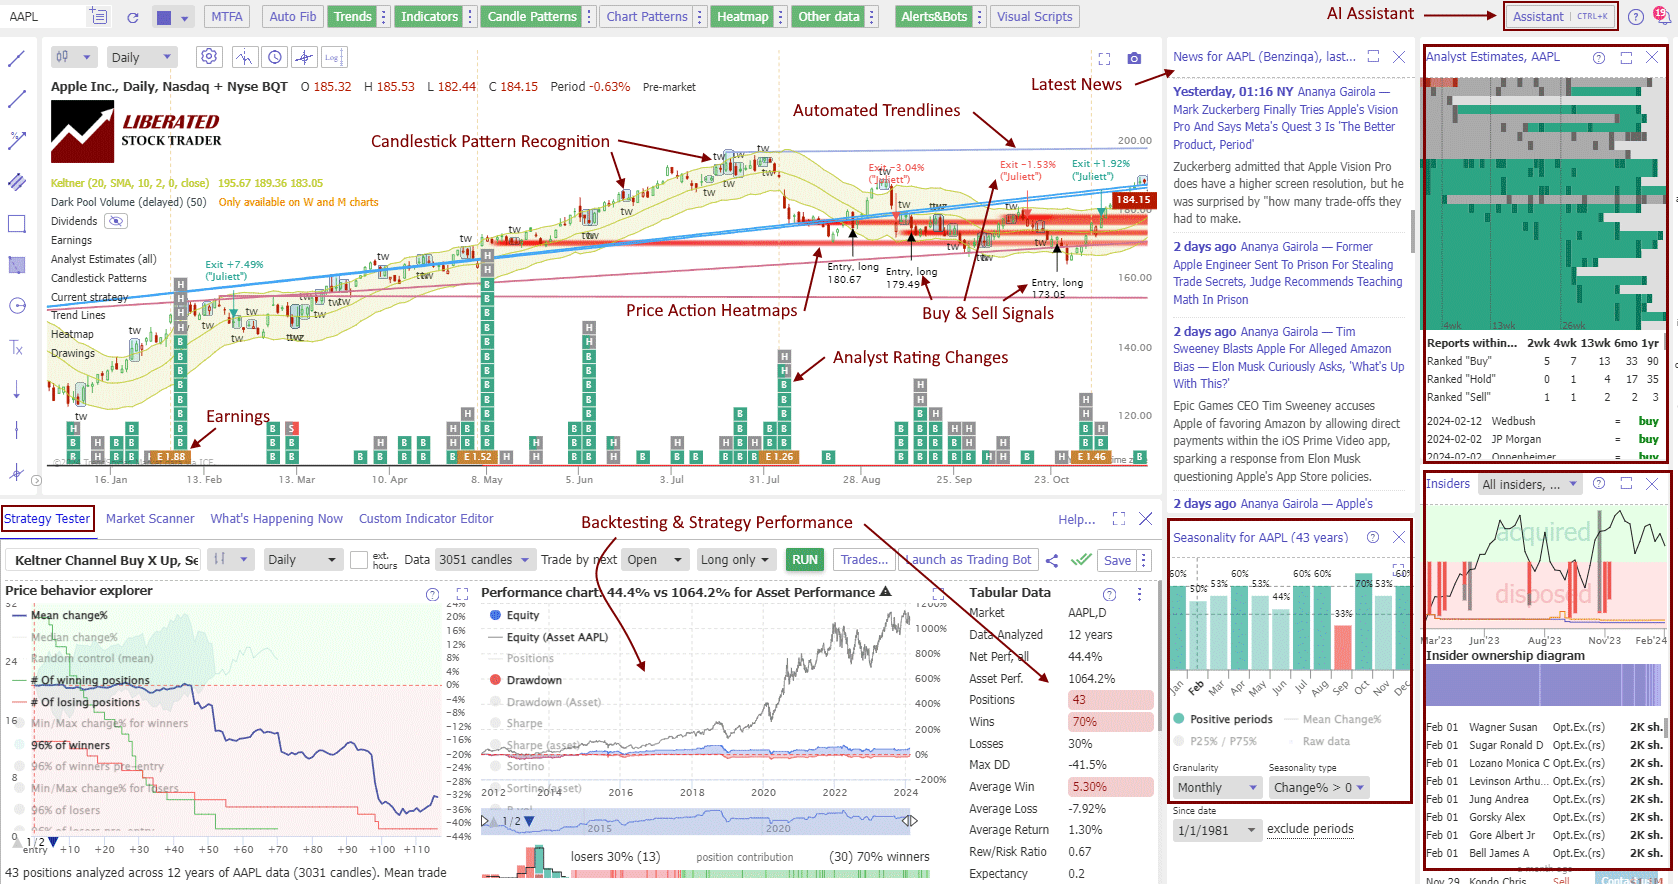
TrendSpider has also implemented a strategy tester that lets you freely type what you want to test, and it handles the coding for you. It was a smooth, powerful implementation that had me develop a strategy within minutes.
Usability & Support
TradingView wins usability and speed overall, scoring a perfect 5.00. TradingView loaded a chart in 1.55 seconds, scored 5.00 for time-to-chart, delivered 20 ms multi-chart latency, scored 5.00 for multimonitor speed, and completed the action workflow in 2 clicks for a 5.00 ease score. That makes TradingView feel extremely light, fast, and intuitive despite being web-based.
| Lab Test Ratings | TradingView |
|---|---|
| Speed & Ease of Use | 5.00 |
| Community Utility Index (CUI) | 5.00 |
| Support Infrastructure & SLA Audit | 3.25 |
The practical difference is that TradingView is faster and smoother as a daily charting interface.
TrendSpider is also fast, especially considering how much automated analysis it performs. It scored 4.67, with a 2.36-second chart load, 5.00 time-to-chart performance, 184 ms multi-chart latency, 4.00 multimonitor chart speed, and a 2-click workflow with 5.00 ease-of-use points.
| Lab Test Ratings | TrendSpider |
|---|---|
| Speed & Ease of Use | 4.67 |
| Community Utility Index (CUI) | 3.75 |
| Support Infrastructure & SLA Audit | 4.50 |
Final Thoughts
If you want intelligent AI pattern recognition, no-code backtesting, and bot trading for US markets, then TrendSpider is a great choice. TradingView is the best stock analysis and trading software for international markets. It is perfect for beginner and experienced traders, with a vibrant community and excellent charts, backtesting, scanning, and screening globally.
If you need real-time news, backtesting, and stock chart indicators, I recommend MetaStock. Stock Rover is the best software for building long-term value, income, and growth portfolios. Finally, if you want to use the power of AI for short-term day trading, Trade Ideas is the best choice.
FAQ
Is TradingView or TrendSpider better for stock trading?
Both TradingView and TrendSpider are great for stock trading. TradingView is better for stock trading from charts than TrendSpider. TradingView integrates with over 50 brokers globally. However, TrendSpider has broker integration and also automated bot trading.
Is TrendSpider better at pattern recognition than TradingView?
While both TradingView and TrendSpider offer excellent stock chart pattern recognition, TrendSpider’s pattern recognition is superior. TrendSpider natively recognizes patterns, trendlines, Fibonacci levels, and candlesticks across multiple timeframes on a single chart.
TradingView or TrendSpider: which is better?
TrendSpider is better for pattern recognition and backtesting for non-programmers. TradingView is better for a social trading community and powerful charting and backtesting for those who can code.
Which is easier to use, TrendSpider or TradingView?
Both TrendSpider and TradingView are elegantly designed and intuitive to use. TradingView covers more assets and markets. TrendSpider offers free personal 1-to-1 training.
What is the big difference between TradingView and TrendSpider?
TradingView has 20 million active users and a vibrant social trading community, covering stocks, currencies, and crypto globally. TrendSpider has the best stock chart pattern recognition, the easiest-to-use backtesting, and better screening for the US markets.
