After thoroughly evaluating Motley Fool’s stock-picking performance, I’ve uncovered the key details about their Stock Advisor service.
I have closely followed the Motley Fool, observing its highs and lows. I took a deeper dive, downloaded their 20 years of stock picks, and conducted an independent audit. The findings are remarkable.
Lab Test Composite Score
Motley Fool’s A 4.04 CLPS reflects a product that’s optimized for research consumption and decision support, not workflow speed for traders. Against the median CLPS (4.21), it’s slightly lower because many competing “tools” include full charting/scanning/backtesting stacks—areas Motley doesn’t try to win. The practical upside: if your bottleneck is finding high-conviction ideas and sticking with them, its structure is a feature.
The overall result might seem low, but when considering Motley Fool Stock Advisor and Epic, they are highly focused on stock recommendations, which earns an AAA 5.00
| Metric | Calculation | Motley Fool | High | Median | Low |
|---|---|---|---|---|---|
| Composite Lab Performance Score (CLPS) | Average for all ratings + 5X Superpower Boost for Top 5 killer features | 4.04 | 4.75 | 4.21 | 2.93 |
| Composite Lab Performance Score (CLPS) Overall Test Winners | TradingView 4.75 | TrendSpider 4.72 | Trade Ideas 4.52 |
In Context: Motley Fool is structurally an “investment advisory + research library.” This is evident in the CLPS: it can score extremely well on signal usefulness and community utility because the output is curated and repeatable (model portfolios, recurring picks, thesis framing).
Where it loses points is where a research publisher should lose—chart engineering, scanning depth, and execution tooling. If you already have a broker + charts, Motley’s job is to feed you better ideas and better conviction.
Motley Fool Test Scores
After four years of independent testing, I confirm Motley Fool Stock Advisor has an excellent performance track record of stock selection that outperforms the market. Motley Fool offers an impressive stock advisory service for long-term growth investors. However, it is not a full-stack trading service, as it lacks powerful charts, backtesting, and automation.
I subscribe to and invest in the Motley Fool Stock Advisor service using my own funds, as I genuinely believe it offers excellent value for money.
| Test | Tier | Score | Average |
|---|---|---|---|
| Lab Test Composite Score | 4.04 | 4.04 | 4.21 |
| Pricing Index | AAA | $1.37 | $2.74 |
| Value Score (VP) | C | 2.89 | 2.82 |
| Speed & Ease of Use | AAA | 5.00 | 4.50 |
| Chart Analysis Depth Index | C | 0.50 | 3.17 |
| Chart Pattern Depth & Accuracy | N/A | N/A | 2.73 |
| Scanning Performance | C | 1.34 | 3.38 |
| Backtesting Performance | N/A | N/A | 3.38 |
| Trading Bot & Auto-Trading Reliability | N/A | N/A | 2.50 |
| AI & Algo Index | B | 3.50 | 2.00 |
| Alert Speed | C | 2.67 | 3.67 |
| Trade Signal Quality | AAA | 5.00 | 0.00 |
| Broker Connectivity & Ecosystem Depth | C | 2.00 | 2.00 |
| Portfolio Tool Performance | B | 3.50 | 2.80 |
| Financial News Speed & Depth | B | 3.00 | 2.80 |
| Community Utility Index (CUI) | A | 4.25 | 3.25 |
| Support Infrastructure & SLA Audit | B | 3.00 | 3.75 |
Tested using rating system v3.
See the 2026 v3 58-point Motley Fool test and benchmarks.
Pros
✔ AAA Stock Selection
✔ Proven to beat the market consistently over 20 years
✔ Ability to build watchlists & entire portfolios
✔ Very Cost-effective service
✔ Fully transparent auditing of stock-picking performance
✔ A straightforward and intuitive website
✔ A passionate and loyal community of 700,000 people
Cons
✘ Stock Screener is basic.
✘ It can be tricky to find the original research reports.
✘ Charting is very basic.
✘ No Backtesting
✘ No Broker Integration

My independent Motley Fool tests confirm that Motley Fool Stock Advisor outperforms the S&P 500; they are a mature stock advisory service with a proven track record. Since the Motley Fool team reorganized its approach to stock investing advice in 2002, it claims an excellent record of beating the market with its Stock Advisor service.
Features
| ⚡ Motley Fool Features ? | Stock Selection, Live Webinars |
| 🏆 Unique Features ? | Proven Winning Track Record |
| 🎯 Best for | Long-Term Stock Investors |
| ♲ Subscription | Monthly, Yearly |
| 💰 Price | $199-$499/mo |
| 💻 OS | Web Browser, iOS, Android |
| 🎮 Trial | 30 Day |
| ✂ Discount | 50% Discount $99 |
| 🌎 Region | USA |


What is the Motley Fool?
Motley Fool is a privately held company owned by brothers Tom and David. For over 20 years, the Gardners have provided sensible investing advice, popularising investing in index funds and high-growth stocks. Motley Fool became a household name with the “Motley Fool Investment Guide,” published in 1997. This book inspired me to start investing.
Pricing Index
Pricing Index is in dollars, not a 0–5 rating. Motley Fool’s $1.37/day is way below the median $2.74/day, and well below the “High” cost anchor ($9.99/day). That’s the “headline” affordability. The nuance lies in Effective Monthly Cost (EMC): if you upgrade to higher tiers to match the research-tool depth of dedicated platforms, the true comparable spend increases.
| Metric | Calculation | Motley Fool | High | Median | Low |
|---|---|---|---|---|---|
| Cost-per-day | $/day on an annual plan. Minimum viable plan with real-time exchange data | $1.37 | 9.99 | 2.74 | 0.74 |
| $ per feature | Effective Monthly Cost /Total Features | $3.78 | 23.37 | 5.95 | 1.94 |
| Effective Monthly Cost (EMC) | EMC = (Plan price + required real-time data fees + key premium add-ons) / month | $41.58 | 303.87 | 83.32 | 22.50 |
Motley Fool is cheap if you benchmark it as “a newsletter that sends stock picks.” Stock Advisor costs only $199 per year; it is a great deal.
If you want additional benefits such as screeners, portfolio analytics, deeper quantitative data, or something comparable to platforms that let you perform your own research, the $499 Epic service is realistic.
The benchmarking in this review uses the Epic service because using only Stock Advisor makes the platform a one-trick pony, which would score poorly overall.
Stock Advisor — $199/year
- Entry‑level service focused on long‑term stock picks.
- 2 monthly stock recommendations.
- Suggested portfolio size: $25K+.
- Includes foundational stock rankings and partial access to tools like FoolIQ and GamePlan.
Epic — $499/year
- Expanded version of Stock Advisor.
- 5 monthly stock recommendations.
- Suggested portfolio size: $50K+.
- Full access to FoolIQ, GamePlan, and broader analyst coverage.
- Access to the Moneyball: Hidden Gems database (190+ companies).
Epic Plus — $1,999/year
- The highest tier of the core subscriptions.
- 8+ monthly recommendations, including daily Moneyball picks.
- Suggested portfolio size: $100K+.
- Access to the AIball database (3,400+ companies).
- Includes additional scorecards, portfolios, and advanced research tools.
Trade Signal Quality
Motley scores 5.00 in this rubric because it provides audited, explicit recommendations (i.e., actionable picks and portfolio guidance). This category is not “predictive quant alpha”; it’s “does the product deliver clear, testable signals for the user to act on?”
| Metric | Calculation | Motley Fool | High | Median | Low |
|---|---|---|---|---|---|
| Signal Alpha & Predictive Efficacy | 5 = Audited specific signals; 2.5 = gauges | 5.00 | 5.00 | 0.00 | 0.00 |
| Trade Signal Quality Test Winners | Trade Ideas 5.00 | Seeking Alpha 5.00 | Tickeron 5.00 | Motley Fool 5.00 |
In Context: Motley’s entire value proposition is signals: recurring picks, portfolio guidance, and thesis updates that map to “buy/hold/sell conviction.” The key nuance is that these are long-horizon signals, not trading signals. If you treat them like swing entries, you’ll misapply them. Used correctly—diversified sizing, patience, and time for thesis to play out—this is exactly the kind of signal structure many investors lack.
Stock Advisor Track Record
Motley Fool offers 32 premium services, from the most popular Stock Advisor and Rule Breakers to advice on real estate investing. Stock Advisor and Rule Breakers are the only services sharing market-beating performance.
The Motley Fool premium stock research reports are clear and precise, focusing on the company’s financials but, most importantly, the industry’s future and business outlook. This is important because if you want market-beating results, you must select companies that are potential industry disruptors and market dominators.
I have subscribed to Motley Fool Premium for four years because I value their qualitative analysis. My initial reason for subscribing to the service was to test whether it was legitimate or a scam. I was impressed by how simple and effective their service is.
I am a paying subscriber and recently partnered with Motley Fool because I can wholeheartedly recommend their service.
Motley Fool Stock Advisor Features
| Company | Motley Fool |
| Product Name | Stock Advisor |
| Research Reports Stocks | ✔ |
| Real-Time Research Reports | ✘ |
| Analyst Research Reports | ✔ |
| Fund Research Reports | ✘ |
| Long-Term Investing | ✔ |
| Stock Ratings | ✔ |
| Portfolio Mgt Tools | ✘ |
| Short-Term Trading | ✘ |
| Buy Signals | ✔ |
| Price Per Year | |
| Visit | 50% Off Motley Fool |
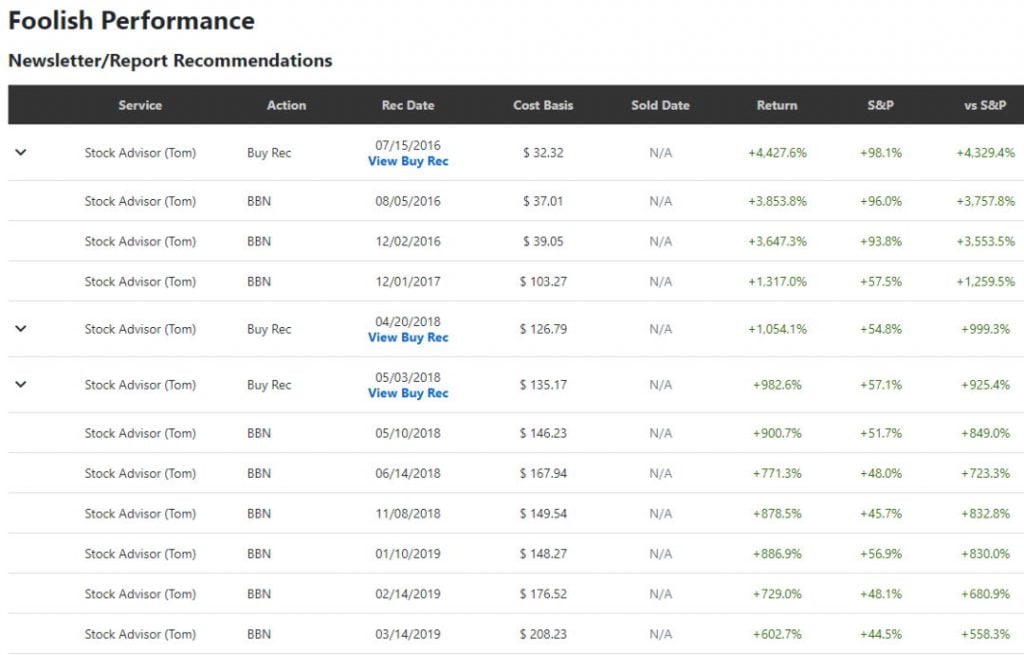
Performance Track Record
The Motley Fool Stock Advisor claims a performance track record of 421% profit since 2002 versus the S&P 500 increase of 85%. This track record is impressive, but is it true? We put it to the test.
Motley Fool does not try to perform research on every stock and fund in the USA. The team focuses on stocks that will significantly beat the S&P 500 over the long term. They then provide lightweight and easy-to-read research reports and recommend why they feel the stock will be a superior long-term investment.
Motley Fool Stock Advisor Portfolio Performance 20-Year $10,000 Investment
| Motley Fool Stock Advisor | S&P 500 |
| $325,000 | $55,000 |
The Motley Fool team claims outstanding market-beating performance. But is this true? In the next section, I perform an independent analysis to verify the facts.
Stock Picks Performance
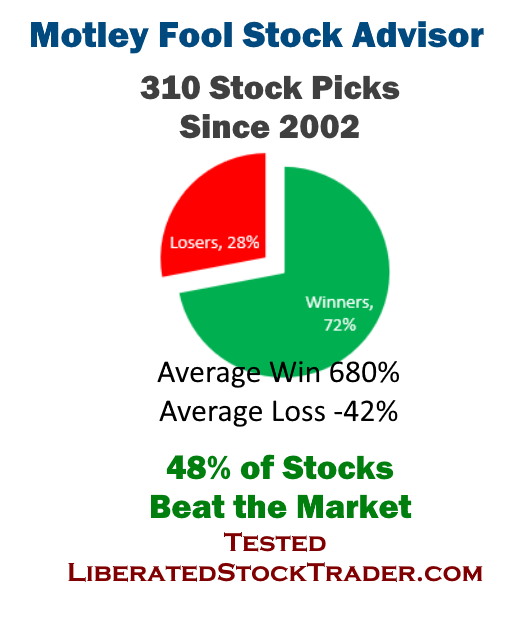
My independent analysis of the stock advisor service’s audited results reveals that since 2002, 48% of the stocks beat the S&P 500. The average winning stock outperformed the S&P 500 by 780%. 28% of the stocks recommended lost 42% on average, while 82% of the stocks made a profit, averaging 640%.
What does this mean? You still have a 28% chance of losing money on any stock recommendation. However, at current performance levels, you have a 72% chance of investing in a company that will make you a profit.
Stock Advisor Returns
I independently verified the Motley Fool Stock Advisor returns and confirmed a 46.3% profit. This is exceptional performance, recommending 310 stocks, of which 48% outperformed the S&P 500 with an average return of 680%. The average loss was 48%.
- They recommended 310 individual stock picks to investors.
- 72% of the stocks made a profit.
- 48% of the recommendations beat the market.
- The average winning stock beat the market by 780%.
- The average profit of each profitable stock was 680%.
- The average loss was -42%
- The best recommendation was Netflix in 2004, which made a 29,990% profit.
Independent Performance Test
I downloaded the full list of Motley Fools Stock Advisor recommendations. I have independently analyzed the stock picks in Stock Rover, and I can confirm that last year, the Motley Fool Stock Advisor service made a profit of +52.7% vs. the S&P 500 return of +18.4%. Motley Fool beat the S&P 500 by 34.3% for the year to January 1, 2021.
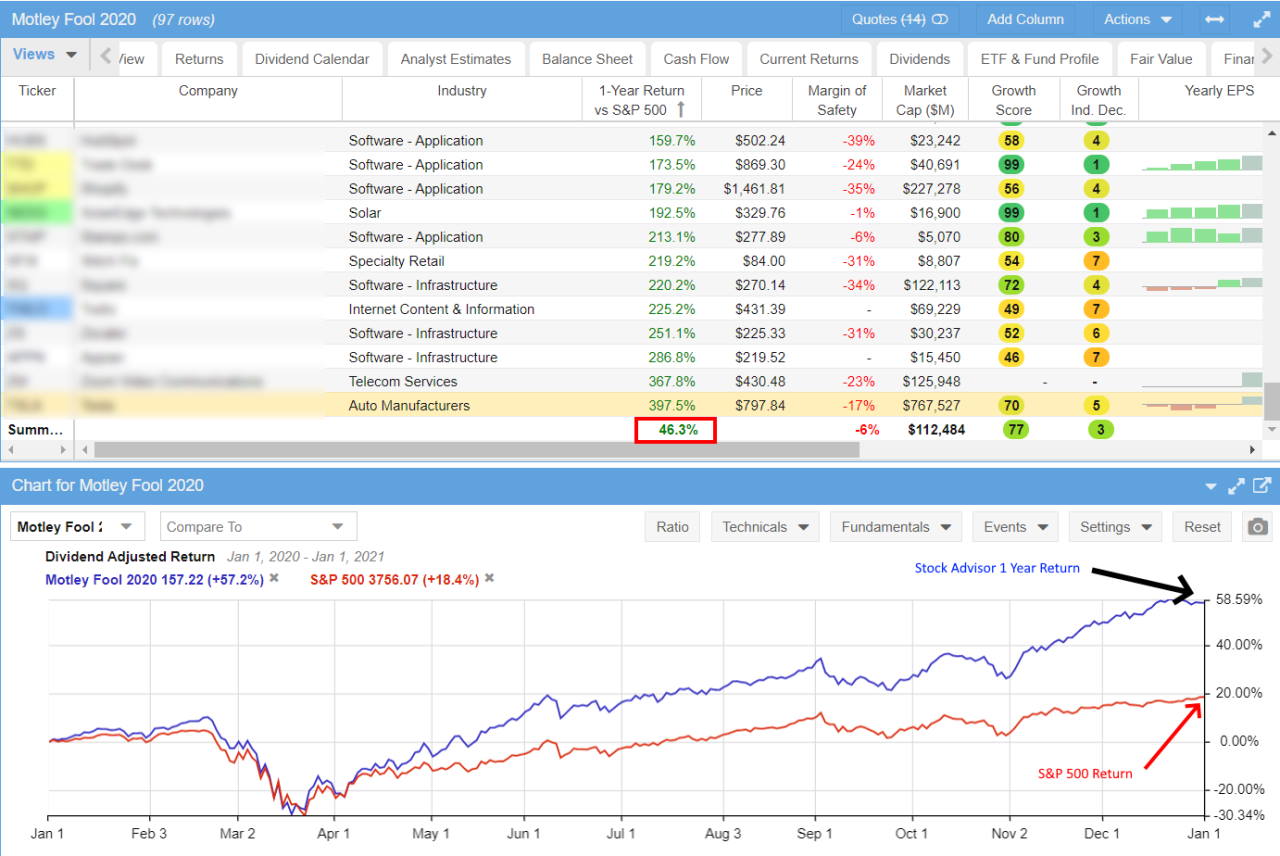
For the full year 2020, Motley Fool Stock Advisor picked 97 stocks. 62 stocks beat the S&P 500 by an average of 83%. 35 stocks did not beat the market, losing an average of 20% against the S&P 500. As you can see in the screenshot above, the average return vs. the S&P 500 was 46.3% across all stocks. This is an impressive result.
Does Motley Fool Beat the Market?
Yes, according to detailed auditing, the Motley Fool Stock Advisor service has returned 612% vs. the S&P 500 return of 120%. Motley Fool has significantly beaten the market since its inception in 2002; in real terms, the S&P 500 averaged 6.13% per year, and the Stock Advisor service averaged a 32.2% annual gain.
As a Motley Fool premium member, I can access all open and closed trades audited since 2002. In the next section, I will share my research on performance.
Portfolio Tool Performance
Motley scores 3.50 vs median 2.80, a pleasant surprise for an advisory product. The key is coverage: 33/80 (41.2%) of critical portfolio metrics are covered. That’s not “institutional risk analytics,” but it can be enough to support a guided long-term portfolio.
| Metric | Calculation | Motley Fool | High | Median | Low |
|---|---|---|---|---|---|
| Portfolio Health & Risk Analytics | Composite rating | 3.50 | 4.80 | 2.80 | 2.00 |
| Health Check & Reporting Depth | % of “Critical Financial Metrics” covered | 33/80 (41.2%) | 76/80 (95.0%) | 36/80 (45.0%) | 20/80 (25.0%) |
| Portfolio Tool Performance Test Winners | Stock Rover 4.80 | Portfolio 123 4.80 | Seeking Alpha 4.30 |
Motley’s portfolio tooling is “good enough” for the investor who wants a single place to see holdings + guidance, but it won’t replace a true portfolio analytics platform. Consider this portfolio organization and coaching rather than portfolio engineering.
When signing up to Motley Fool, you get more than a list of stocks to buy. You get support, encouragement, and regular emails with suggestions for structuring your portfolio. They also provide sound advice on investing and what to expect from the market.
Buy 15 Stocks
The service recommends you buy at least 15 stocks and hold those stocks for 3 to 5 years. This is wise advice because, as we know, the stock market goes down and up, and according to my research, you can expect that 30% of their stock recommendations will not be big winners. Buying a larger basket of stocks helps diversify your portfolio and reduces the risk of being over-exposed to a single company. Additionally, holding stocks for longer allows stocks the time they need to develop outsized profits.
Help Building Your First Portfolio
The service assists you in constructing your initial portfolio by recommending ten starter stocks for purchase. This will set you on the right path to build your portfolio effectively and efficiently. This is a great help to any new investor or anyone looking to refresh their investing performance.
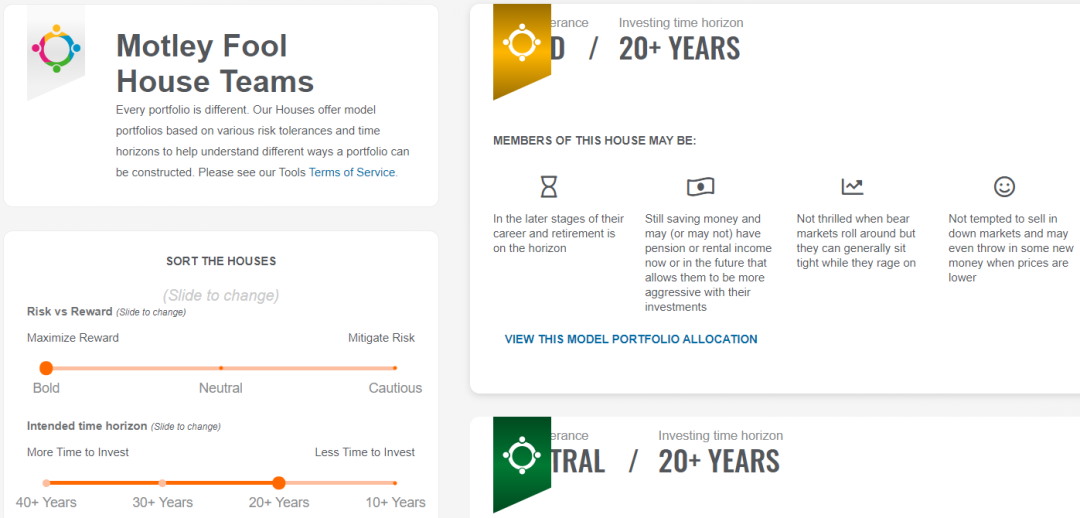
Portfolio Allocator Tool
The Portfolio Allocator tool is simple; it will help you build a portfolio based on your risk profile and investing timeframe. From the Tools menu, select Allocator to be presented with a list of potential portfolio structures. You can select your Risk/Reward and Time to Invest preferences, and they will recommend a portfolio that might meet your needs. See the Screenshot Below.
Try Stock Advisor with a 50% Discount
Your Model Portfolio With Stock Recommendations
When you open your recommended portfolio, you are presented with a Pie that suggests your investment allocation between stocks, ETFs, bonds, and real estate. You can then drill down to see the specific stocks they advise you to buy.
This is a great tool if you need this structured approach to building a well-rounded, diversified portfolio.
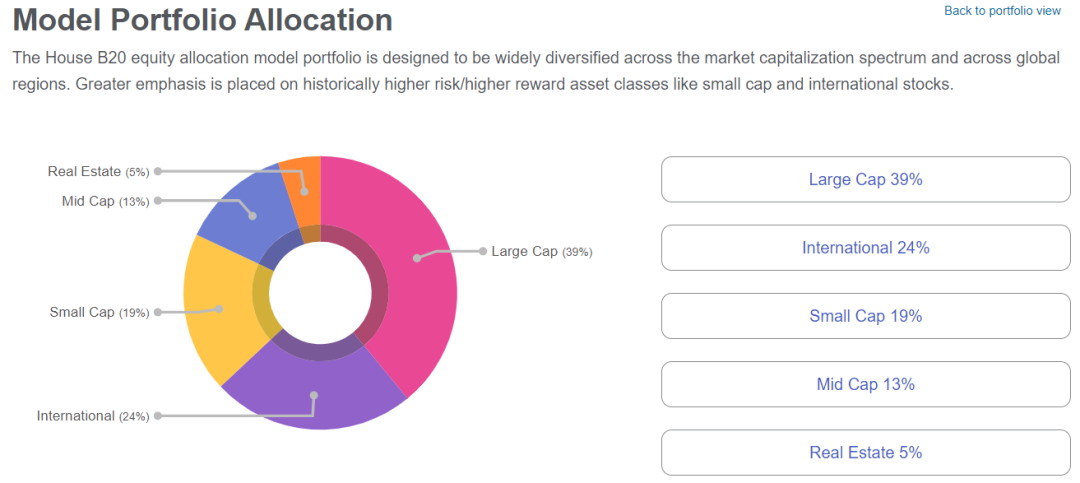
Table: Motley Fool Stock Advisor vs. Rule Breakers
As you can see, the only real difference is in the Best Stocks to Buy Now, where the list of the 5 best stocks is smaller companies with considerable potential. However, the service with the best track record is the Motley Fool Stock Advisor.
Is Motley Fool a Legitimate Business?
Yes, The Motley Fool LLC is a legitimate business that has been providing stock advice and educating investors since 1993. Employing over 300 people and headquartered in Virginia, the Motley Fool has never been involved in any complaints or litigation with the SEC.
Also, the Motley Fool has testified in Congress on four occasions to support individual investors’ rights.
Is Motley Fool Reliable?
Yes, the Motley Fool is a reliable service. Like any stock advisory service, it has made a few mistakes in its 27 years. The Foolish Four recommendations in the early 2000s nearly bankrupted the company. More recently, their recommendation to buy Luckin Coffee backfired for investors, as the Chinese stock plummeted 90% on fraud news.
“The Motley Fool deserves a great deal of credit for openly supplying a vast amount of information on a timely basis. While many investment industry participants offer model portfolios or other forms of advice, few maintain real-money accounts in public view (in effect, putting their money where their mouths are).” Source: Journal of Business & Economics Research
Speed & Ease of Use
Motley Fool scores 5.00, beating the median (4.50), because it’s built to be consumed fast: 2.14 seconds to load the core “chart” experience you’re using (typically price context + content), plus strong click-efficiency. This score does not mean it’s a fast trading workstation—it means low friction to reach actionable content.
| Metric | Calculation | Motley Fool | High | Median | Low |
|---|---|---|---|---|---|
| Speed & Use Index Rating | Average of Time to Chart Performance, Multimonitor Chart Speed & 3 Click Rule: Ease of Use | 5.00 | 5.00 | 4.50 | 3.30 |
| Time to Chart Speed (Seconds) | Seconds from clicking the icon to a fully loaded chart with 200 price bars & 2 indicators. | 2.14 | 17.03 | 4.70 | 1.60 |
| Time to Chart Performance | Speed to Chart Points | 5 | 5.00 | 4.50 | 3.00 |
| Multi-Chart Latency (ms) | N/A | 667.00 | 209.00 | 10.00 | |
| Multimonitor Chart Speed | Multi-Chart Sync Points | N/A | 5.00 | 3.50 | 0.00 |
| 3-Click Rule Test | Number of Clicks to place a trade or launch a scan | 3 | 6.00 | 3.00 | 2.00 |
| 3 Click Rule: Ease of Use | 5 Click Points. Each click > 3 = 1 minus point | 5 | 5.00 | 3.00 | 2.00 |
| Speed & Ease of Use Test Winners | TradingView 5.00 | Stock Rover 5.00 | Seeking Alpha 5.00 |
Motley Fool’s strength is “get me to the point”—latest updates, research, and pick rationale. That makes it feel instant compared with platforms that need layouts, indicators, timeframes, and saved scans.
Chart Analysis Depth Index
Motley Fool is 0.50 vs a median 3.17 because it’s not a charting stack. You get basic price context, not indicator engineering, custom scripting, or deep multi-chart workflows. If you buy Motley for charts, you’re buying the wrong product.
| Metric | Calculation | Motley Fool | High | Median | Low |
|---|---|---|---|---|---|
| Chart Analysis Depth Index | Average of Chart Depth, Indicator Depth & Custom Coding Scores | 0.50 | 5.00 | 3.17 | 0.50 |
| Chart Types | Total Count | 1 | 38.00 | 10.00 | 1.00 |
| Chart Depth | Chart Type Score 0.3 points per chart | 1.00 | 5.00 | 3.00 | 0.30 |
| Indicators | Total Count | 0 | 400.00 | 116.00 | 0.00 |
| Indicator Depth | Indicators Scores 0.025 points per indicator | 0.00 | 5.00 | 2.90 | 0.00 |
| Custom Indicator Coding | Available = 5 Points | 0.00 | 5.00 | 0.00 | 0.00 |
| Chart Analysis Depth Index Test Winners | TradingView 5.00 | MetaStock 5.00 | Optuma 5.00 |
Motley Fool’s charts exist to provide context and continuity—what happened after a pick, what’s the long-term trend, how volatile is the ride—not to be a decision engine. If you’re a technical analyst, pair Motley with a dedicated charting platform. If you’re fundamentally driven, you’ll likely prefer this “minimal charting, maximum narrative” model because it keeps you anchored to a thesis instead of indicator tweaking.
Scanning Performance
Motley scores 1.34 vs median 3.38 because the scanning layer is minimal: a small criteria set, no custom-code scanning, and no real-time refresh scanning. If your edge comes from finding setups first, this will not suffice.
In Motley Fool Stock Advisor and in the quant database in Epic, you can scan for 82 criteria. The scanning is fast at 200 milliseconds, but it is not customizable; you are screening a universe of Fool’s curated stocks.
| Metric | Calculation | Motley Fool | High | Median | Low |
|---|---|---|---|---|---|
| Market Scanning Latency & Depth | Average of Scanning Speed, Criteria & Customer Code Scores | 1.34 | 5.00 | 3.38 | 0.80 |
| Scanner Performance (ms) | Milliseconds to search the entire S&P 500 across 5 different criteria. | 200 | 2500.00 | 300.00 | 7.00 |
| Scanning Speed Points | Scanner Performance Points | 3 | 5.00 | 4.00 | 1.00 |
| Scanner Auto-Refresh Rate (seconds) | Auto-Refresh Speed(Not Scored) | N/A | 60.00 | 1.00 | 0.00 |
| Scanning Criteria & Depth | Total Criteria Count | 82 | 675.00 | 200.00 | 30.00 |
| Scanning Criteria & Depth | Scanning Criteria 0.0125 points per criteria | 1.03 | 5.00 | 2.50 | 0.38 |
| Custom Code Scanning | Exists 5 Points | 0.00 | 5.00 | 5.00 | 0.00 |
| Scanning Performance Test Winners | Stock Rover 5.00 | TradingView 4.83 | TrendSpider 4.67 |
Motley’s “scanning” is essentially editorial curation—you’re receiving pre-filtered ideas, not building a machine to search the market. That can be a feature for long-term investors (less noise, more thesis).
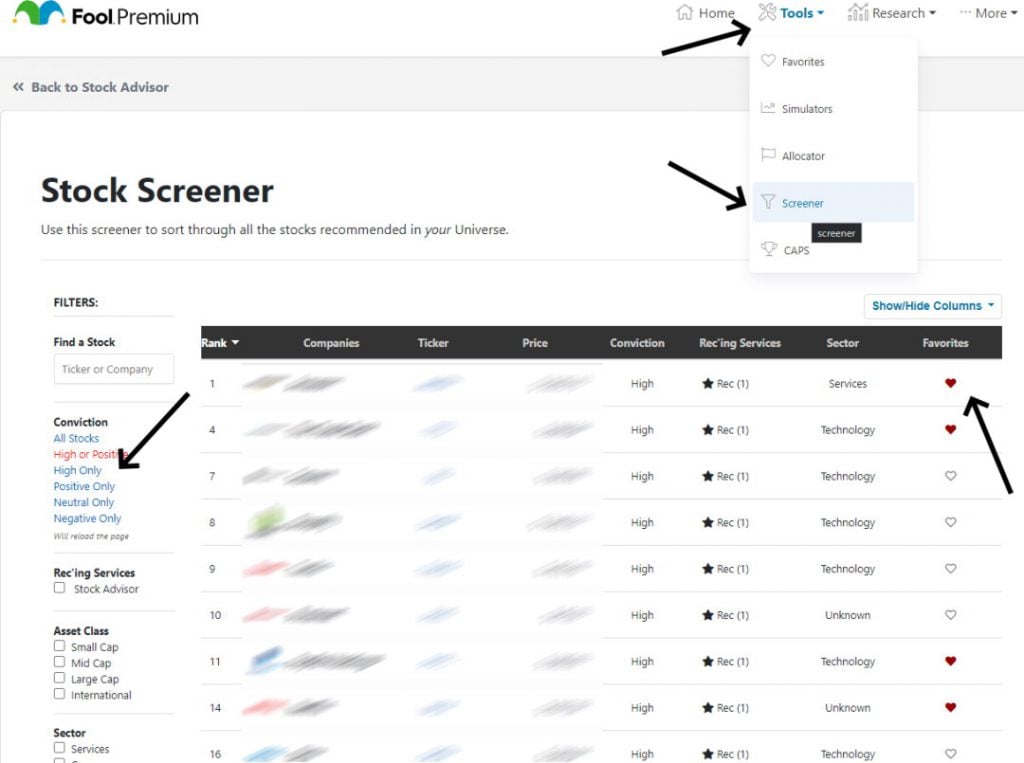
The Motley Fool stock screener is simple and effective, allowing you to screen for their stock pick recommendations. I get my stock selections using the Fool Premium Stock Screener. Click on Tools -> Screener, then select High Only to get a list of their High Conviction Stock Picks. These are the stocks they rate the best of the best for potential future growth.
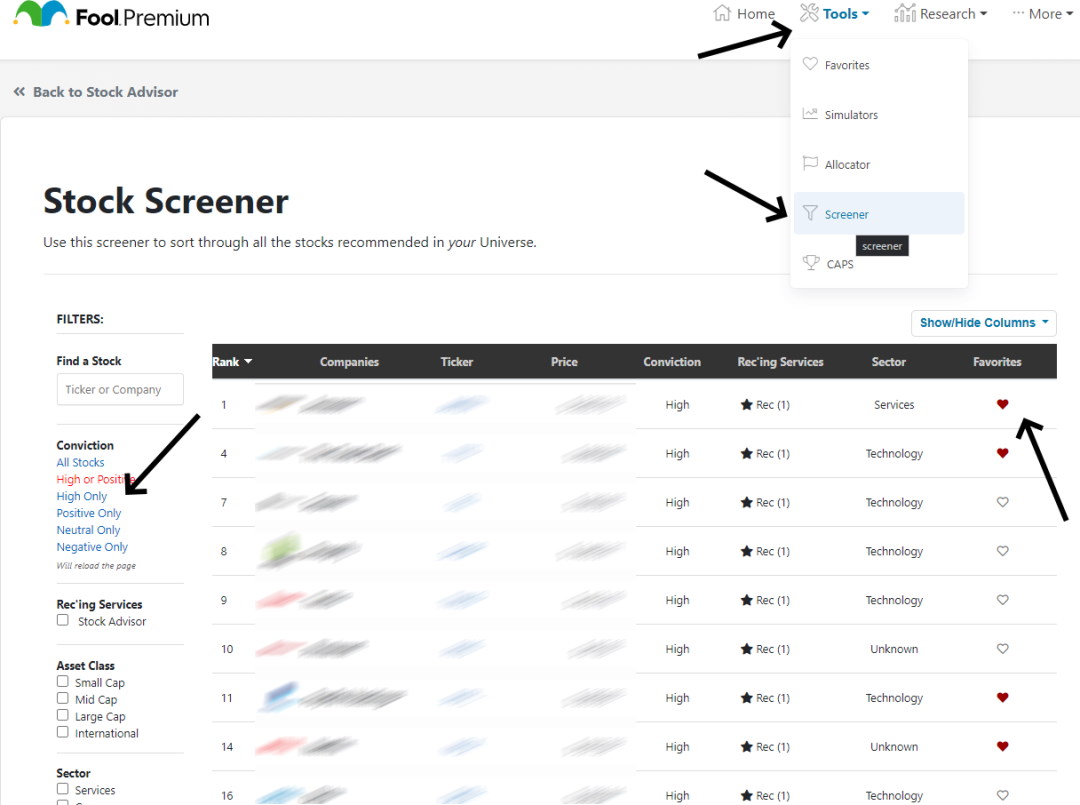
You can then click each stock to get a full research report on the company and understand why they selected it. What is also great is that you can see the entire audit of when the stock was first recommended and every time they have reiterated their buy recommendation.
This stock screener does not screen the entire stock market; it is limited to the stocks that the Motley Fool team has recommended, meaning you will have a total universe of about 900 stocks.
AI & Algo Index
Motley scores 3.50 vs median 2.00, which is strong for a research publisher. The score is driven by Algo Depth (2.00) and some AI Layer (1.00), but note the transparency is only 0.50: you may benefit from internal tooling, but the user-facing product is still mostly human-authored research.
| Metric | Calculation | Motley Fool | High | Median | Low |
|---|---|---|---|---|---|
| Algorithmic Intelligence & AI Tier Index | Sum of Algo Depth, AI Layer & Transparency Points | 3.50 | 5.00 | 2.00 | 1.00 |
| Algo Depth | Algo Depth (0.0–2.0) | 2.00 | 2.00 | 1.50 | 1.00 |
| AI Layer | AI Layer (0.0–2.0) | 1.00 | 2.00 | 0.00 | 0.00 |
| Transparency | Transparency (0.0–1.0) | 0.5 | 1.00 | 1.00 | 0.00 |
| AI & Algo Index Test Winners | TrendSpider 5.00 | Trade Ideas 4.50 | Tickeron 4.50 |
Motley Fools is a human-curated recommendations/service model rather than an AI decision engine. Algorithms are used in its quantitative research, but they are limited.
Analyst Picks: While they use AI for internal research, the “tool” provided to the user is human-authored content, not an interactive reasoning engine.
Alert Speed
Motley scores 2.67 vs median 3.67 because alerts are content-driven, not market-tick driven. You can get notifications, but not the kind of high-frequency, multi-condition, price/indicator alert engine that traders expect.
Notifications depend on publication timing, and recommendations, rather than market-tick evaluation.
| Metric | Calculation | Motley Fool | High | Median | Low |
|---|---|---|---|---|---|
| Alert Trigger Latency & Delivery Speed | Average of Concurrent Alerts, Alert Streams Richness & Alert Speed Rating Scores | 2.67 | 4.67 | 3.67 | 2.33 |
| Concurrent Alerts | 1 point per 50, to a max of 5 points | 5 | 5.00 | 5.00 | 5.00 |
| Concurrent Alert Count | Unlimited | 2000.00 | 875.00 | 400.00 | |
| Alert Streams Richness | 1 point per stream, max 5 points | 2 | 5.00 | 2.00 | 1.00 |
| Alert Speed Rating | 1 | 5.00 | 3.00 | 1.00 | |
| Speed Metric | Content-driven (newsletter/trade-alert schedule) |
| Alert Speed Test Winners | TradingView 4.67 | TrendSpider 4.33 | Benzinga Pro 4.33 |
In Context: This is where investors and traders diverge. Investors mostly need “tell me when the thesis changes” or “remind me about updates.” Traders need “tell me when price/volume/indicator conditions trigger.” Motley’s alerting is the former.
Broker Connectivity & Ecosystem Depth
Motley scores 2.00, which sits at the median. That’s mostly because it’s distributed as a research service that can coexist with any broker, rather than a platform with direct broker APIs and measured order-routing latency.
Broker connectivity is another area in which the toolset is lacking; it would be a great addition to link with your broker and allow Fool to display your stocks, versus its universe of recommendations. But sadly not.
| Metric | Calculation | Motley Fool | High | Median | Low |
|---|---|---|---|---|---|
| Asset & Data Coverage Index | Average of Live Trading, Broker Integration, Asset & Data Coverage Scored | 2.00 | 5.00 | 2.00 | 0.67 |
| Live Trading | 5 Points | N/A | 5.00 | 5.00 | 0.00 |
| Total number of brokers integrated | N/A | 1200.00 | 2.00 | 0.00 | |
| Asset & Data Coverage | Stocks, Options, FX, USA, International – 1 point each | 2.00 | 5.00 | 2.00 | 2.00 |
| Broker Connectivity & Ecosystem Test Winners | TradingView 5.00 | MetaTrader 5.00 | TrendSpider 4.43 |
Financial News Speed & Depth
Motley scores 3.00 vs median 2.80—but interpret this carefully. The “speed” is not wire-speed; my audit note is that the news is curated for thesis relevance rather than immediate price action. A 30+ minute delay is irrelevant to long-term investors and fatal to day traders.
| Metric | Calculation | Motley Fool | High | Median | Low |
|---|---|---|---|---|---|
| Financial News Speed & Quality Rating | Weighted rubric | 3.00 | 5.00 | 2.80 | 0.00 |
| Wire Delay | Seconds of delay vs primary wire feeds | 30+ mins | < 1 s | 60–300 s | Hours/Days |
| Financial News Speed & Depth Test Winners | MetaStock 5.00 | Benzinga Pro 5.00 | Scanz 5.00 |
News is curated for long-term thesis impact rather than immediate price action.
Community Utility Index (CUI)
Motley scores 4.25, well above the median (3.25). That’s a strong “ecosystem” signal: the community is large enough to feel alive, and the contribution quality is above average (4.50), even if it’s not technical code-sharing like chart-script communities.
Fool has a massive subscriber base that follows expert leads but contributes less than other peer-to-peer platforms. Most interactions happen on legacy-style bulletin boards.
| Metric | Calculation | Motley Fool | High | Median | Low |
|---|---|---|---|---|---|
| Community Utility Index | Avg of size + contribution quality | 4.25 | 5.00 | 3.25 | 1.75 |
| Active Community Size | Active Users scale | 4.00 | 5.00 | 3.25 | 1.80 |
| Quality of Community Contribution | Quality of IP scale | 4.50 | 5.00 | 3.50 | 1.50 |
| Community Utility Index Test Winners | TradingView 5.00 | MetaTrader 5.00 | Trade Ideas 4.75 |
Support Infrastructure & SLA Audit
Motley scores 3.00, below the median (3.75). It has acceptable access channels and reasonable response times, but it’s not built like a trading terminal support org with immediate “down system” urgency.
| Metric | Calculation | Motley Fool | High | Median | Low |
|---|---|---|---|---|---|
| Support SLA Audit: Time-to-Human Benchmarks | Avg of comm channels + response time | 3.00 | 5.00 | 3.75 | 1.00 |
| Support Communication Channels | Access scale | 3.00 | 5.00 | 3.50 | 1.00 |
| Support Response Times | SLA scale | 3.00 | 5.00 | 4.00 | 1.00 |
| Support Infrastructure & SLA Audit Winners | TrendSpider 5.00 | TC2000 5.00 | ThinkorSwim 4.75 |
Support expectations should match product risk. If a charting terminal breaks mid-session, that’s an execution risk event. If a research subscription has a login issue, it’s frustrating but rarely market-critical.
Motley’s support profile is consistent with that of a subscription publisher: generally functional, often billing- and account-oriented, and less “ops-engineered” than that of trading platforms.
Is Motley Fool Stock Advisor Worth It?
Yes, Motley Fool Premium services are worth it, as they improve your chances of investing in profitable stocks. In 2020, only 13% or 815 US stocks performed better than the S&P 500. This means you have only a 13% chance of picking an outstanding stock. Motley Fool Stock Advisor helps increase your chance of beating the market, as 48% of their recommendations outperform the S&P 500.*
*According to my research using Stock Rover, out of 7,500 US stocks, only 851 companies with a market capitalization greater than $1 billion beat the S&P 500 index in 2020.
How Do I Use Stock Advisor?
For 20 years, I have preferred to conduct my own stock research, but after using Motley Fool’s Stock Advisor for four years, I have found it saves me a lot of time and provides unique insights and ideas.
I typically review the Motley Fool’s High Conviction recommendations and then add them to Stock Rover. Stock Rover lets me analyze the financials, analyst ratings, future revenues, and earnings in depth. It also allows me to connect to my Broker, access their research reports, rebalance my portfolio, and screen the entire market for stocks. I have even developed my own Beat the Market Growth Stocks Strategy, now available for all Stock Rover customers.
Summary
I was skeptical about the Motley Fool Stock Advisor service for many years, but having been a subscriber for four years, I can recommend it for the following reasons. Their stock picking is excellent, and they have a proven track record of significantly beating the market. They support you with continual updates and new stock alerts. Motley Fool is a great place to start if you want to be one of the 10% of people who beat the market.
The Motley Fool Stock Advisor service has significantly beat the market since its inception in 2002. According to its detailed auditing, Stock Advisor has returned 612% vs. the S&P 500 return of 120%. In real terms, the S&P 500 averaged 6.13% per year, and the Stock Advisor service averaged a 32.2% annual gain.
Value Score (VP)
Motley Fool’s 2.89 is slightly above the median (2.82) on value, driven by feature quality (3.66) and strong device support (4.00)—you can consume it anywhere, fast. The drag is feature depth (1.00): it’s not trying to be a technical workstation; it’s trying to be a high-quality decision feed.
| Metric | Calculation | Motley Fool | High | Median | Low |
|---|---|---|---|---|---|
| Value Score | Sum of Feature Quality (60% Weight), Feature Depth (30%) & Device Support Depth (10%) | 2.89 | 4.37 | 2.82 | 1.70 |
| Value Rank | Percentile Ranking | 2.50 | 5.00 | 2.50 | 1.00 |
| Feature Quality | Average of All Feature Quality Ratings | 3.66 | 4.16 | 2.97 | 2.00 |
| Feature Breadth | Feature richness (count of meaningful core features) | 11 | 17 | 12 | 9 |
| Feature Depth | Percentile Ranking | 1.00 | 4.75 | 3.00 | 1.00 |
| Device Support Depth | Web 2 points, (PC, Android/iOS/ 1 Point each) | 4.00 | 5.00 | 2.00 | 1.00 |
| Value Score Test Winners | TradingView 4.37 | TrendSpider 4.20 | Trade Ideas 4.05 |
Motley Fool’s “value” is best understood as quality of decision support per dollar, not the number of technical widgets. The best use case is the investor who wants repeatable idea flow (picks, updates, thesis reminders) and can act through an existing broker.
FAQ
What is Motley Fool Stock Advisor?
Stock Advisor is The Motley Fool's flagship investment service, providing stock recommendations and investment advice for both new and experienced investors.
How often does Stock Advisor release new stock recommendations?
Stock Advisor releases two new stock recommendations each month.
What other features does Stock Advisor offer besides stock recommendations?
In addition to stock picks, Stock Advisor provides in-depth research, educational content, live market commentary, and a community of investors for members to engage with.
Can I see past performance of Stock Advisor picks?
Yes, the past performance of Stock Advisor picks is available for members to view and is often highlighted as a part of the service's track record.
How are stocks chosen for Stock Advisor?
Stocks are chosen for Stock Advisor based on a variety of criteria including business quality, growth potential, and valuation, among other factors, as outlined by The Motley Fool's investment philosophy.
How much does Stock Advisor cost?
Stock Advisor costs $199 annually, but varies depending on promotional rates and subscription terms. As a new subscriber you can have your first year for $99.
Can I manage a portfolio within Stock Advisor?
Yes. Stock Advisor offers features to track your portfolio, allowing you to add stocks to 'My Portfolio' and monitor their performance.
Does Stock Advisor provide advice on when to sell a stock?
Yes, Stock Advisor does provide sell recommendations when they believe it's no longer advantageous to hold a stock.
Hi Michael, thanks for the question. You are correct, Motley Fool do not have a published defined set of rules for the buy or sells. However, for each recommendation they do justify why it is a buy or sell. The reasons are usually fundamental (earnings/sales are down) or business conditions (industry turmoil). In the famous case of luckin coffee it was because the company filed false accounts.
My testing involved adding all their recommendations into a Stock Rover portfolio, and and removing them when Motley Fool signalled a sell.
I think it is important to follow their guidance on buy if you want to emulate their performance numbers.
thanks
Barry
Barry, Stock Advisor has a rather loosely defined method for buying and selling the recommended stocks. Can you give us more information on number of stocks you held and how you determined when to sell them?
Hi Frank, thanks for pointing out the error. This has been corrected; it now reads – 72% of the stocks made a profit.
48% of the recommendations beat the market.
How could 72% of the stocks recommended by Motley Fool have made a profit but did not beat the market, while 48% of the recommendations beat the market. That’s over 100% of the stocks recommended which does not compute.
I would Contact fool.com
Where can I find all the stocks recommended by Motley from 2002. Under fool.com I don’t see PERFORMANCE tab anymore.