Choosing the right indicators is critical to a trader’s success. But which are the most reliable, and what are the ideal settings?
My research on 10,400 years of exchange data shows the best day trading indicators are the Price Rate of Change, VWAP, Weighted Moving Average, Hull Moving Average, Simple Moving Average, and RSI.
Each of these tested indicators produces winning trades at least 43% of the time. Many stock chart indicators can produce losses due to incorrect configuration.
This research, compiled over three years, will show you how to configure the right indicators for your day-trading strategy.
11 Best Day Trading Indicators Success Rates
Our tests have demonstrated win rates of over 80% for the Price Rate of Change, VWAP, and Weighted Moving Average indicators. We calculate the win rate as the percentage of DJ-30 stocks that produced profits higher than a buy-and-hold strategy when traded with the indicator. For example, trading the Price Rate of Change indicator on 30 Dow Jones stocks produced market-beating returns on 28 stocks, e.g., 93%.
| Top Day Trading Indicators | Chart Timeframe | Win Rate |
| Price Rate of Change | 5-min | 93% |
| VWAP | 5-min | 93% |
| Weighted Moving Average | 5-min | 83% |
| Hull Moving Average | 5-min | 77% |
| Simple Moving Average | 5-min | 70% |
| Relative Strength Index | 5-min | 53% |
| Commodity Channel Index | 60-min | 50% |
| Bollinger Bands | 60-min | 47% |
| Aroon Indicator | 5-min | 47% |
| Money Flow Index | 60-min | 43% |
| Stochastic Indicator | 60-min | 43% |
Save 38% to 45% on TrendSpider
Our Top Rated 4.72 ⭐ Trading Tool
✅ Leader in AI Trading & Chart Pattern Recognition
✅ Scanning & Auto-Trading
Deal Ends In:
1. Price Rate of Change – 93% Win Rate
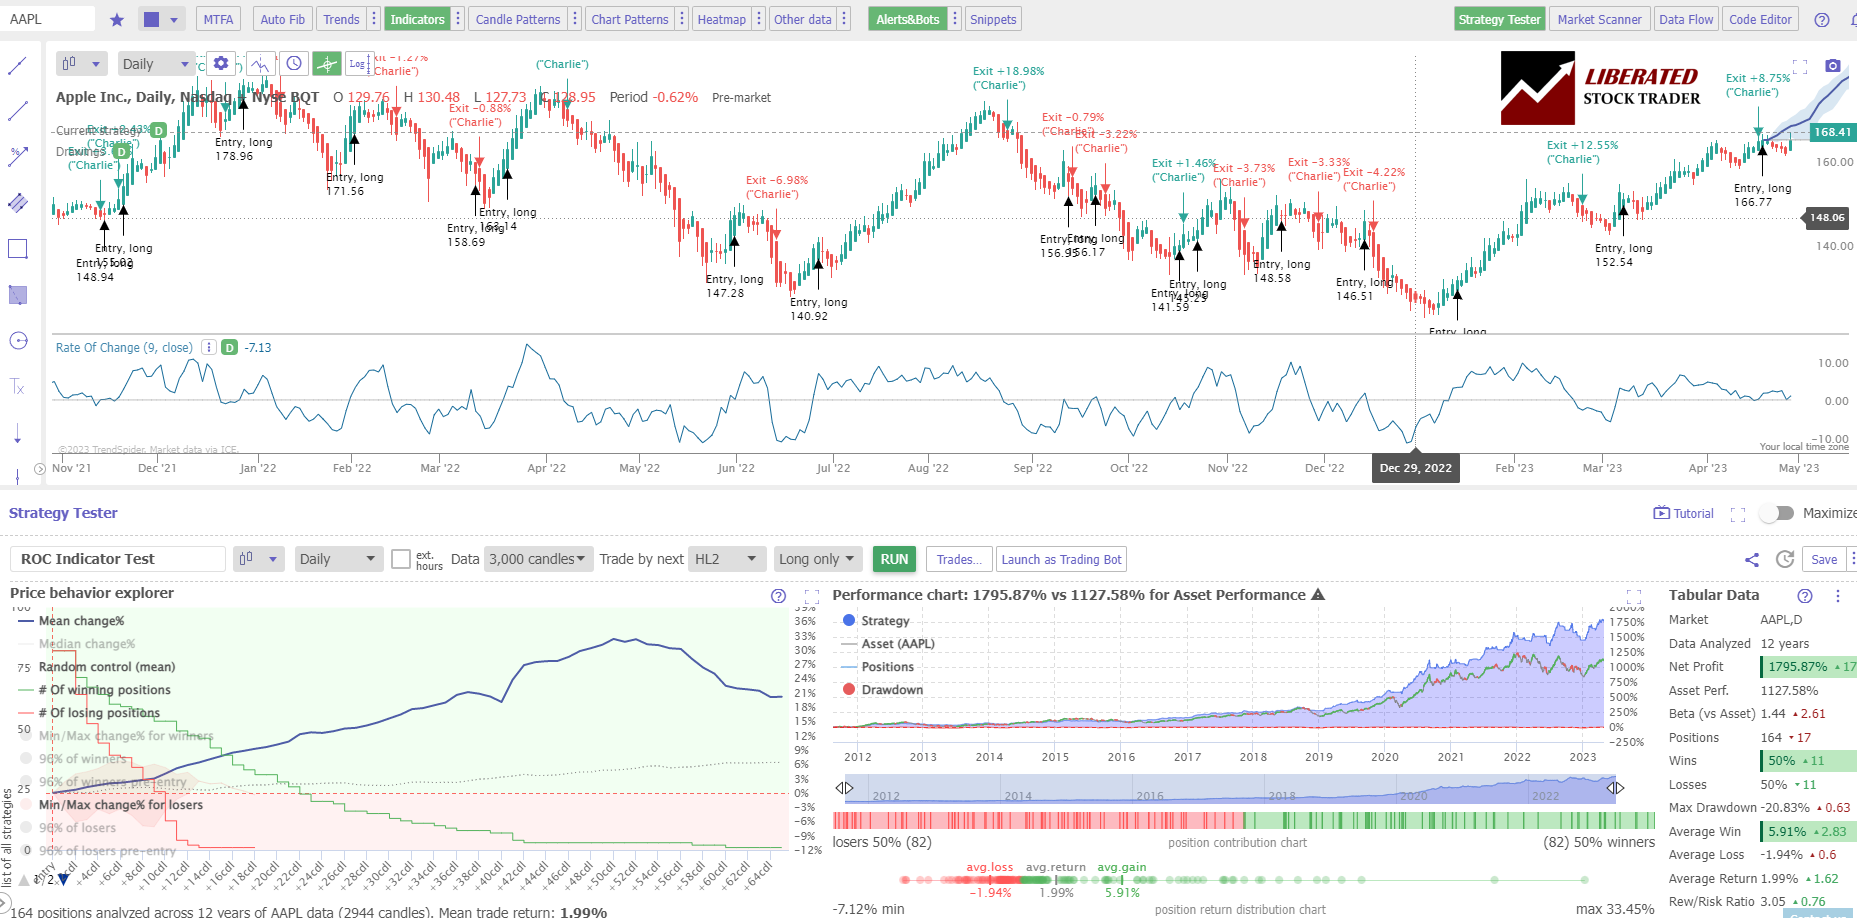
The Price Rate of Change (ROC) is a powerful technical analysis chart indicator. ROC was the most profitable indicator we tested using a Heikin Ashi chart. ROC allows traders to gauge both the speed and direction of price movements.
As its name suggests, it measures the rate at which a security’s price changes over time by comparing current prices with those from the recent past.
By doing so, traders can determine if a security is trending upwards or downwards and the velocity of its price fluctuations. This invaluable information empowers traders to make informed decisions and capitalize on market opportunities.
Backtest Your Strategies on TrendSpider
Test Results
According to our testing, the price rate of change is a top-performing indicator, with 20-year results proving a reward/risk ratio of 2.5 and outperforming a buy-and-hold strategy on 66% of stocks on a daily chart.
Configured for a day trading strategy using the Rate of Change setting 9 on a Heikin Ashi chart, produced an incredible 93% win rate, outperforming a buy-and-hold strategy. Over 40 days, there were 130 trades, resulting in a reward-to-risk ratio of 2.1:1, with 55% of trades yielding a profit.
| ROC Indicator Tests | Candlestick Chart | Heikin Ashi Chart |
| Timeframe | 5-min | 5-min |
| Duration | 40 Days | 40 Days |
| % Beating Mkt | 43% | 93% |
| Avg # Trades | 152 | 114 |
| Reward/Risk Ratio | 1.84 | 2.7 |
| % Winners | 45% | 55% |
The results demonstrate that utilizing a Heikin Ashi chart, which smooths out previous bars, is a significant advantage in trading. Using a standard OHLC or candlestick chart resulted in many losing trades due to volatility, but the Heikin Ashi chart enhanced the rate of change indicator, making it highly profitable.
TrendSpider 4.8/5⭐: My Pick for AI-Power & Auto-Trading
I’ve used TrendSpider for 7 years for my research and testing. It auto-detects trendlines, patterns, and candlesticks, backtests ideas, and lets you use AI to create unique strategies and launch trading bots—with no code.

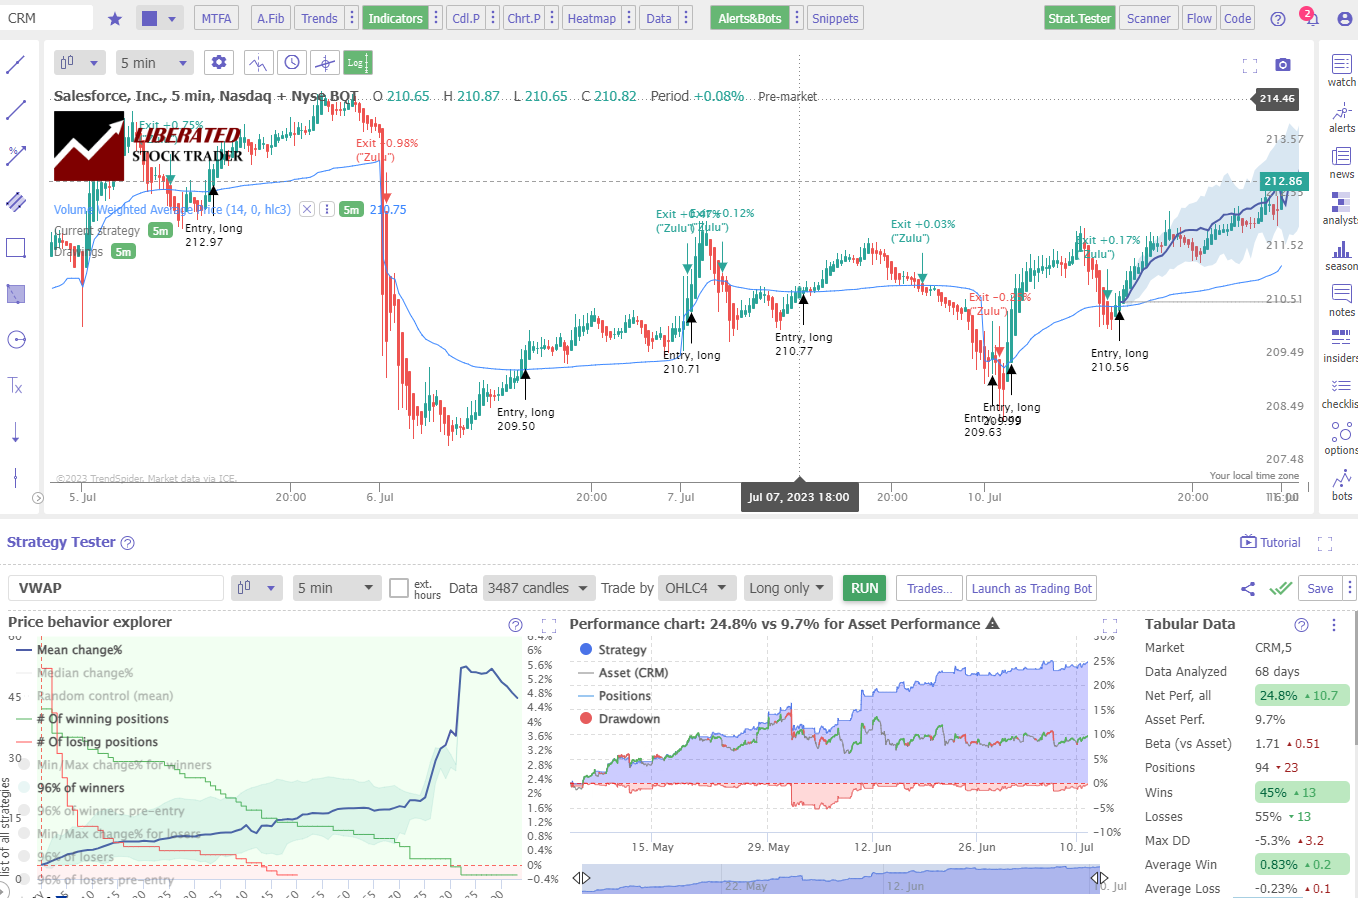
2. VWAP – 93% Win Rate
The Volume-Weighted Average Price (VWAP) indicator is not profitable for day traders when used with a standard candlestick/OHLC chart, yielding a 30% win rate.
However, when combined with a Heikin Ashi chart, the indicator delivers excellent returns.
The Volume-Weighted Average Price (VWAP) indicator is calculated by adding up the total dollar amount of all traded securities in a given period, divided by the total number of shares traded during that period. This gives investors an idea of where buyers and sellers are active in relation to price movement.
Test Results
Using VWAP on a 5-minute day trading and a Heikin Ashi chart produced a superb win rate, outperforming 93% of stocks using a buy-and-hold strategy. Although the winning trades were only 29%, the 4.1 reward/risk ratio led to success on nearly every stock.
| VWAP Indicator Tests | Candle Chart | Heikin Ashi Chart |
| Timeframe | 5-min | 5-min |
| Duration | 68 Days | 68 Days |
| % Beating Mkt | 30% | 93% |
| Avg # Trades | 170 | 130 |
| Reward/Risk Ratio | 4 | 4.1 |
| %Winners | 20% | 29% |
The VWAP indicator for day trading was set to 14 and tested across the DJ30 stocks for 68 days. Using a standard OHLC chart, the indicator produced a 30% success rate of beating a buy-and-hold strategy and a 4:1 reward-to-risk ratio. This strategy produced only 20% of winners, which is a losing strategy.
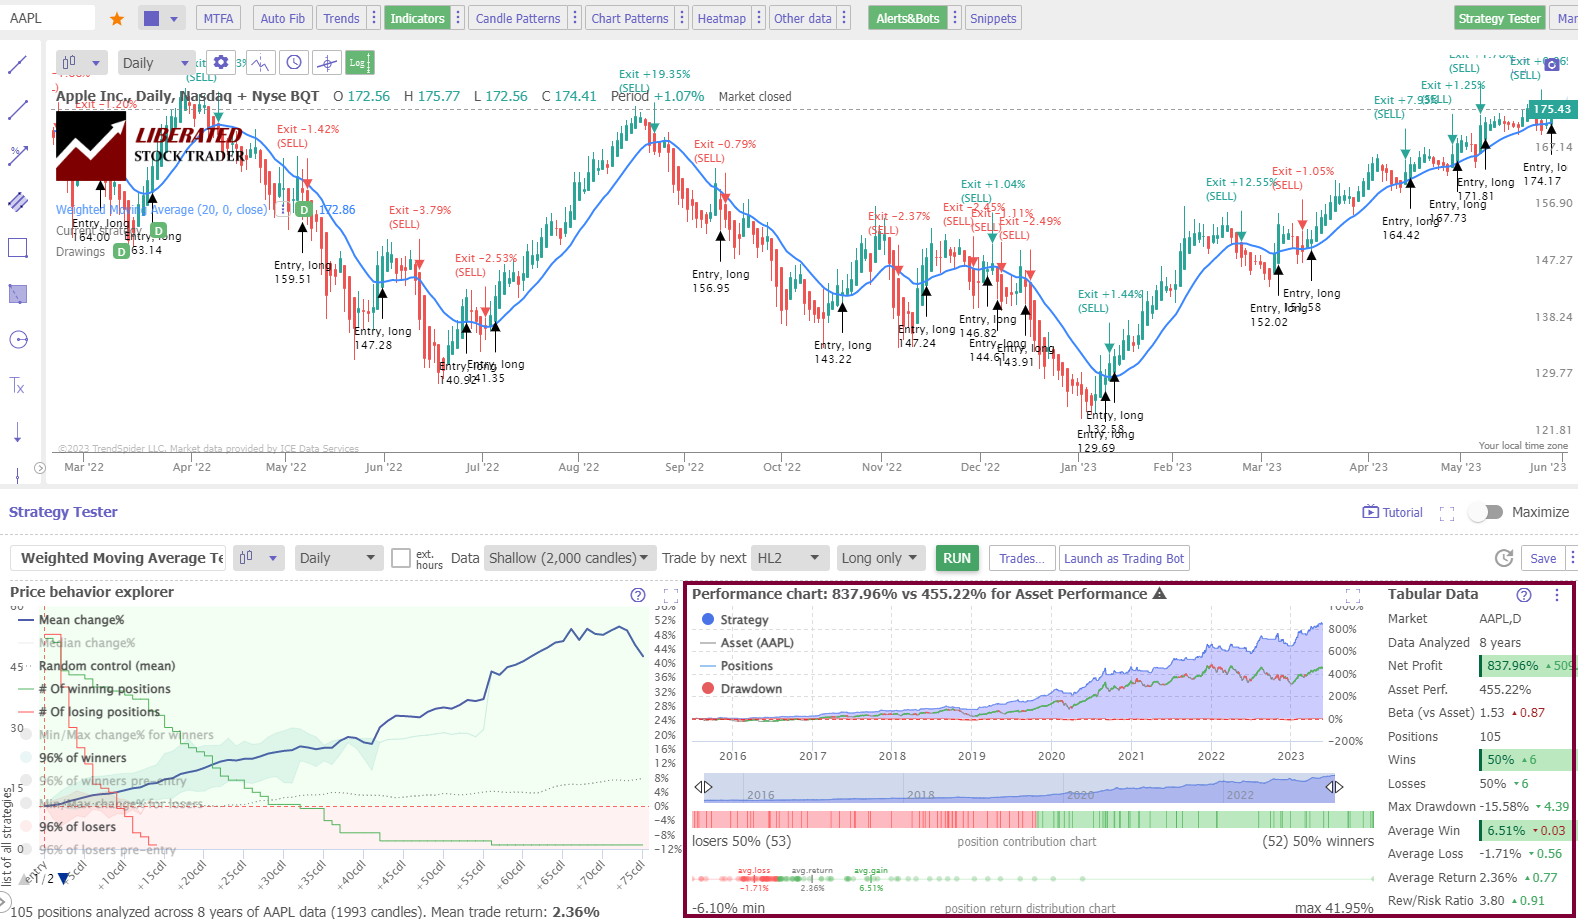
3. Weighted Moving Average – Win Rate 83%
The weighted moving average (WMA) is a widely used chart indicator, but our testing reveals it underperforms other moving averages with only a 7% win rate on a standard OHLC chart.
Using WMA on candlestick charts is not advised due to its poor performance.
However, using the weighted moving average on day trading settings on a Heikin Ashi chart produces excellent results.
Traders often use WMAs to enter and exit trades. A buy signal is generated when the price crosses above the WMA, and a sell signal is generated when the price crosses below the WMA.
Traders may assign higher weights to more recent prices and lower weights to older ones to reflect significant short-term price movements better. Additionally, some traders may opt for an exponential weighting scheme, in which each successive price is assigned a higher weight than the preceding one.
Test Results
Using a weighted moving average (20) on a 5-minute day trading chart, the Heikin Ashi chart produced an impressive 83% win rate versus a buy-and-hold strategy.
The table below demonstrates that using the WMA 20 outperforms all other settings.
| 8-Year Backtest Heikin Ashi Chart | % Win Rate | # Trades |
| Timeframe: | Daily | Daily |
| 20-Day WMA | 83% | 149 |
| 50-Day WMA | 50% | 71 |
| 100-Day WMA | 23% | 57 |
| 200-Day WMA | 13% | 35 |
| Average | 43% |
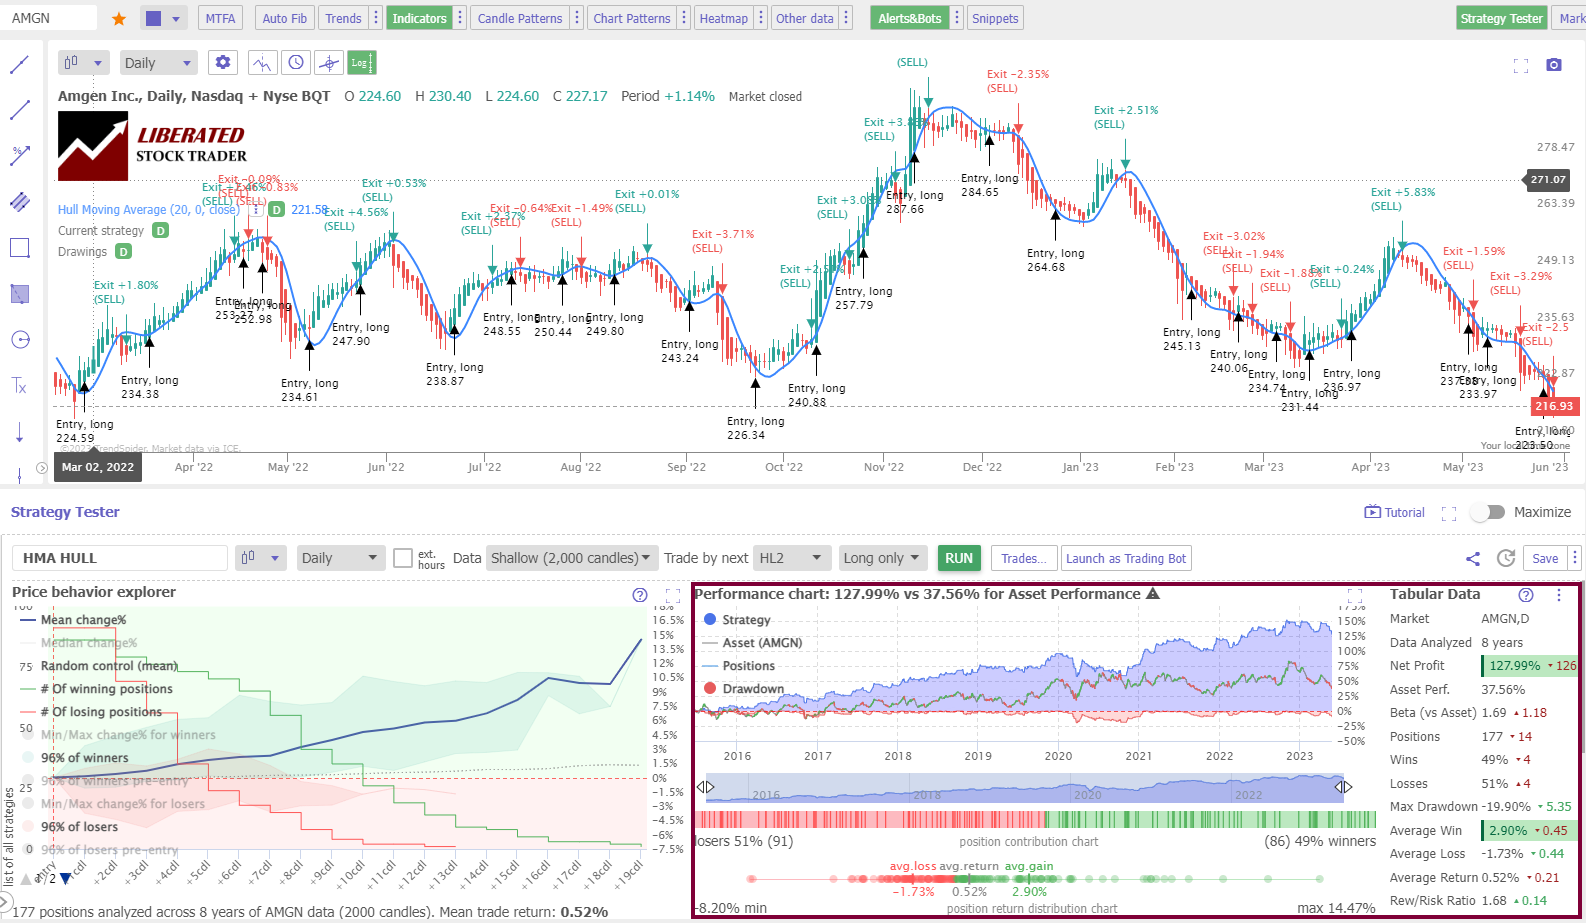
4. Hull Moving Average – 77% Win Rate
The Hull moving average (HMA) is a specialized moving average that applies varying weights to data points within a specific period. It prioritizes recent data points, giving them greater weight than earlier ones.
This deliberate weighting strategy diminishes noise while magnifying the average’s responsiveness to short-term price movements.
TrendSpider – The Smartest AI Trading Tool Available
Test Results
For day traders using Heikin Ashi charts, the Hull Moving Average(HMA) produces impressive trading results. The HMA yields a 77% success rate versus a buy-and-hold strategy on a 5-minute day trading chart. The winning trades average 58% with a reward/risk ratio of 1.98%, which is a winning combination.
| HMA Indicator Test | Daily OHLC Chart | Daily Heikin Ashi Chart |
| Index: | DJIA | DJIA |
| Date Range | 8 Years/2000 Candles | 8 Years/2000 Candles |
| Settings: | 20, 50, 100, 200 | 20, 50, 100, 200 |
| Entry Criteria: | Price > HMA 20 | Price > HMA 20 |
| Exit Criteria: | Price < HMA 20 | Price < HMA 20 |
| Sell: | Next Open | High+Low/2 |
5. Simple Moving Average – 70% Win Rate
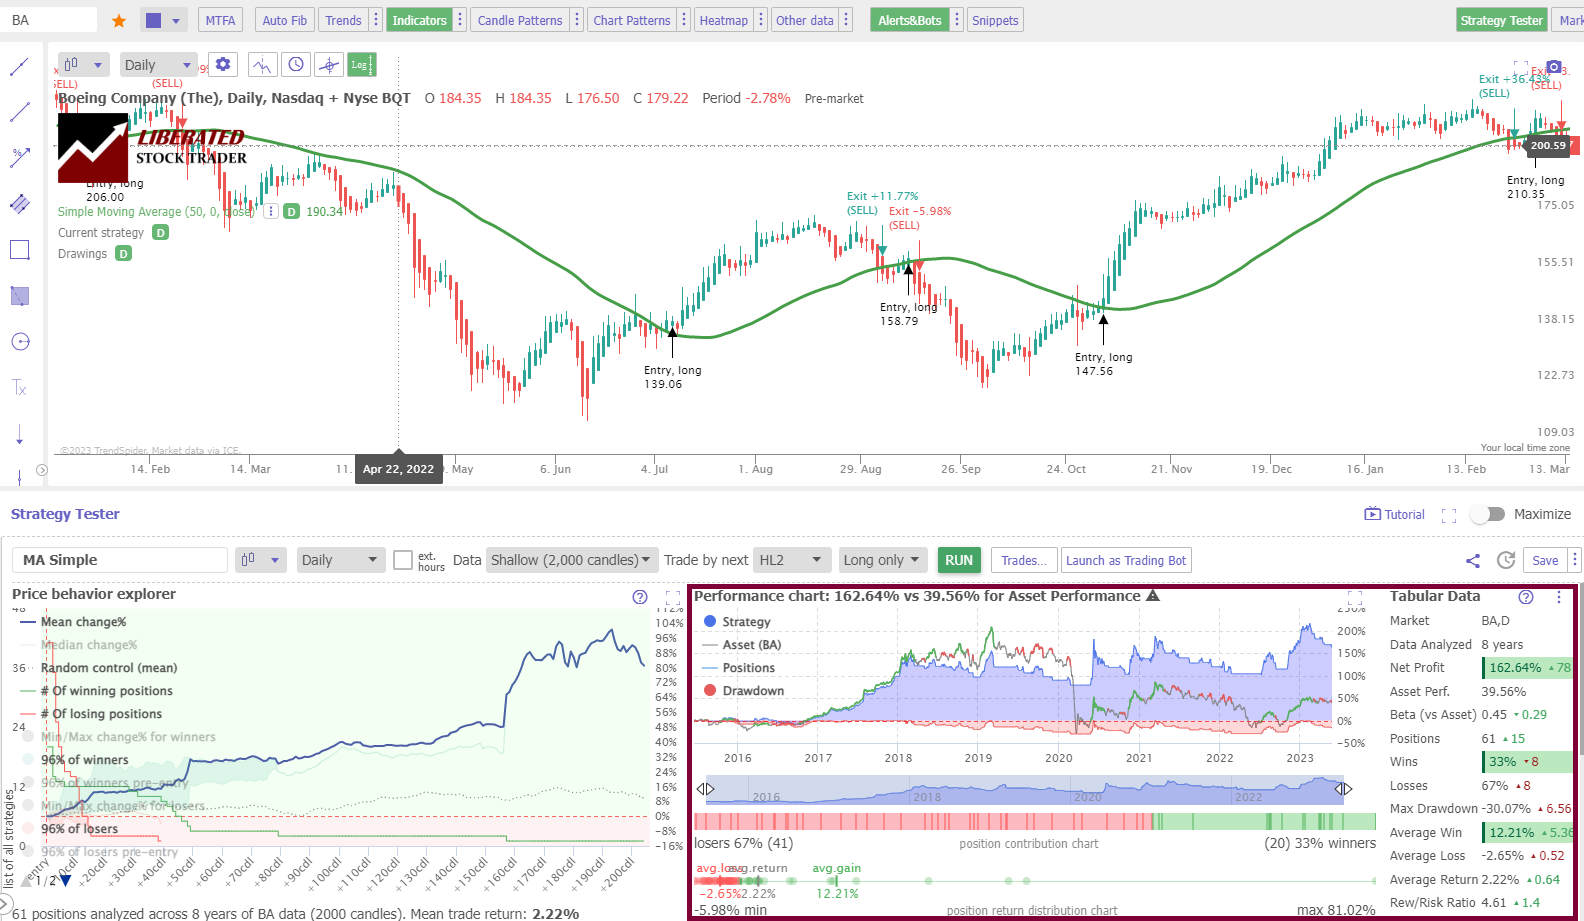
The longer the moving average period used, the more reliable the indicator can be for determining long-term trends in stock prices. For example, if you wanted to measure an uptrend in the stock, you might look at a 200-day moving average. If prices are consistently above this line, then it’s likely that the overall trend of the stock is upwards. Similarly, if you’re looking for potential sell signals, you might use a 50 or 20-day moving average and watch when prices fall below that line.
Test Results
Using a 20-day simple moving average in combination with a Heikin Ashi chart produces an impressive 70% win rate, beating a buy-and-hold strategy on 700% of the DJ30 stocks.
| 8-Year SMA Indicator Test | % Win Rate | # Trades |
| Timeframe: | Daily | Daily |
| 20-Day SMA | 70% | 140 |
| 50-Day SMA | 30% | 60 |
| 100-Day SMA | 23% | 38 |
| 200-Day SMA | 10% | 23 |
| Average | 33% |
6. Relative Strength Index – 53% Win Rate
I backtested four RSI indicator trading setups across 1-minute to daily charts for DJ30 stocks, spanning 1 month to 27 years, for a total of over 820 years of testing data. Not all RSI configurations work, but I discovered the most profitable RSI indicator settings for day traders.
To trade using the RSI indicator, traders look for buy and sell signals based on the RSI oscillator’s value. When the RSI exceeds 70, it indicates an overbought market, suggesting price increases may slow or reverse. The typical trigger for selling an asset is an RSI line crossing below 70.
For an RSI sell signal, traders will look for the oscillator to dip below 30. When the RSI is below 30, it indicates an oversold market, suggesting that price declines may slow or reverse. The typical trigger for buying an asset is the RSI line crossing above the 30 mark.
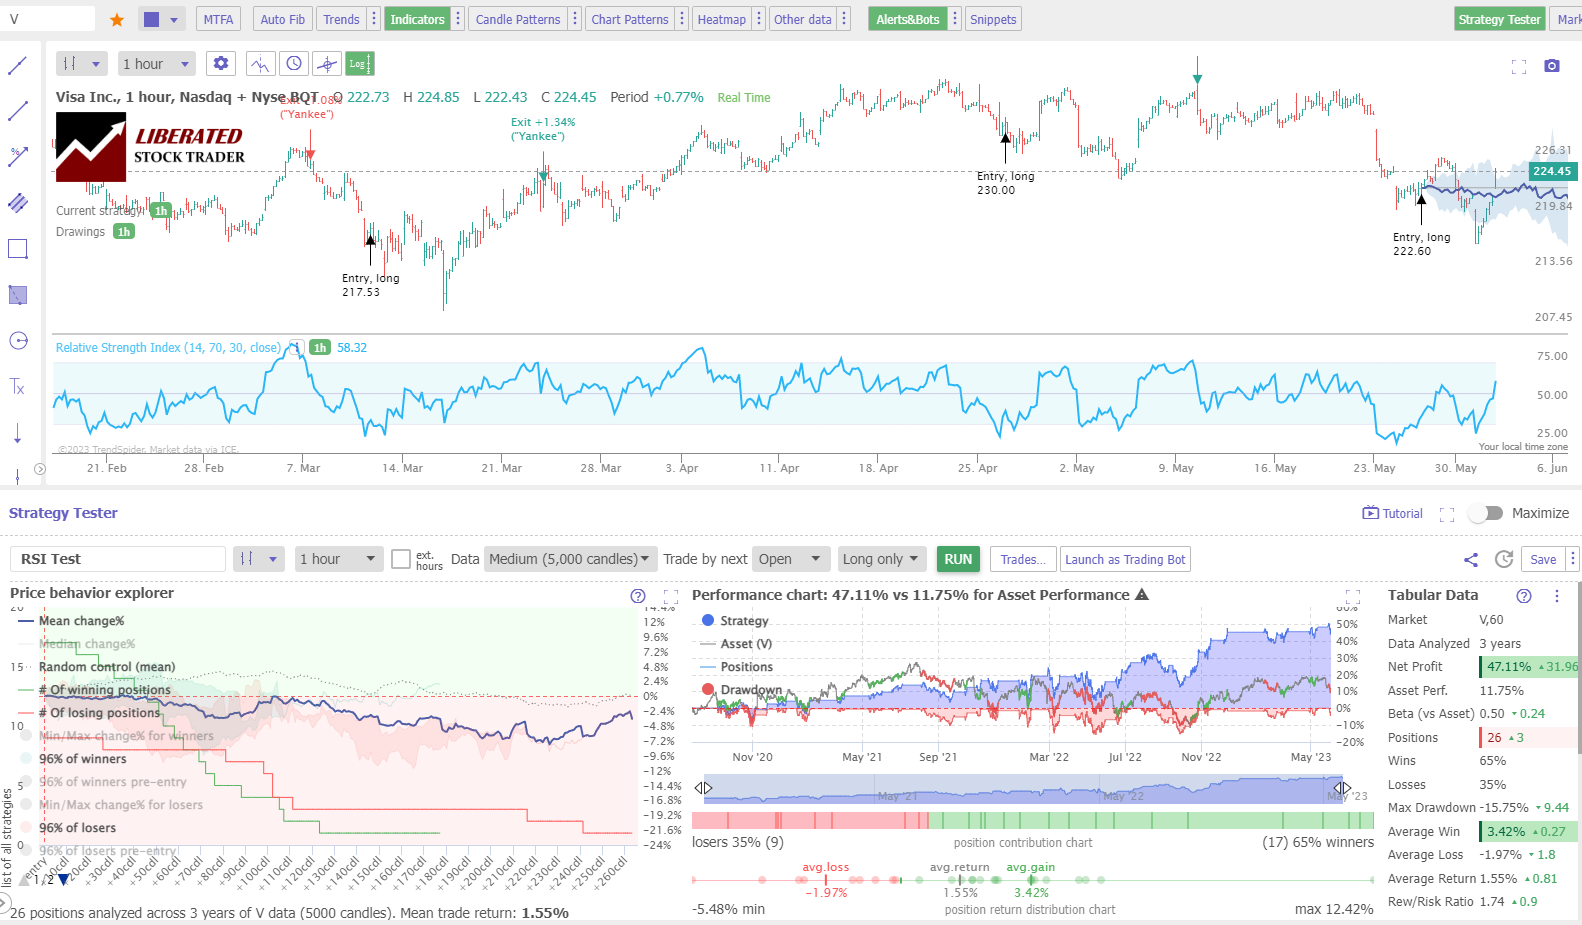
Test Results
Using day trading settings of 5 minutes per bar and a standard OHLC chart, the RSI (14) produced results that beat buy-and-hold strategies 50% of the time. Considering the trade-by-trade results, we see the average winning trades are 65%, with a reward/risk ratio of 1.74%, making this indicator highly profitable.
| RSI Indicator Results | OHLC Chart | Duration | % Winners | Avg # Trades |
| RSI 14,70,30 | 1-min | 20 Days | 20% | 19 |
| RSI 14,70,30 | 5-min | 1 Month | 23% | 8 |
| RSI 14,70,30 | 1-hour | 4 Years | 53% | 10 |
| RSI 14,70,30 | Daily | 27 Years | 20% | 20 |
| Average | 28% | 12 |
7. Commodity Channel Index – 50% Win Rate
The Commodity Channel Index (CCI) is a statistical measure that assesses price deviation from its mean value. It consists of a zero line and an unbounded oscillator that fluctuates above and below zero.
The indicator’s value aligns with the oscillator’s upward or downward movement. Upon reaching specific thresholds, it is categorized as overbought or oversold.
Although the Commodity Channel Index is less commonly utilized and often unfamiliar to novice traders, it harbors immense potential as a hidden gem for generating substantial profits for day traders.
Much is written about the best way to trade the Commodity Channel Index, but my testing shows only one profitable strategy. The proven way to trade the CCI indicator is to buy when it moves above -100 after dipping below it and sell when it moves back below +100 after rising above it.
It’s important to note that the CCI can also provide false signals up to 50% of the time, especially with the wrong settings. Based on our considerable data, I will detail the optimal setting.
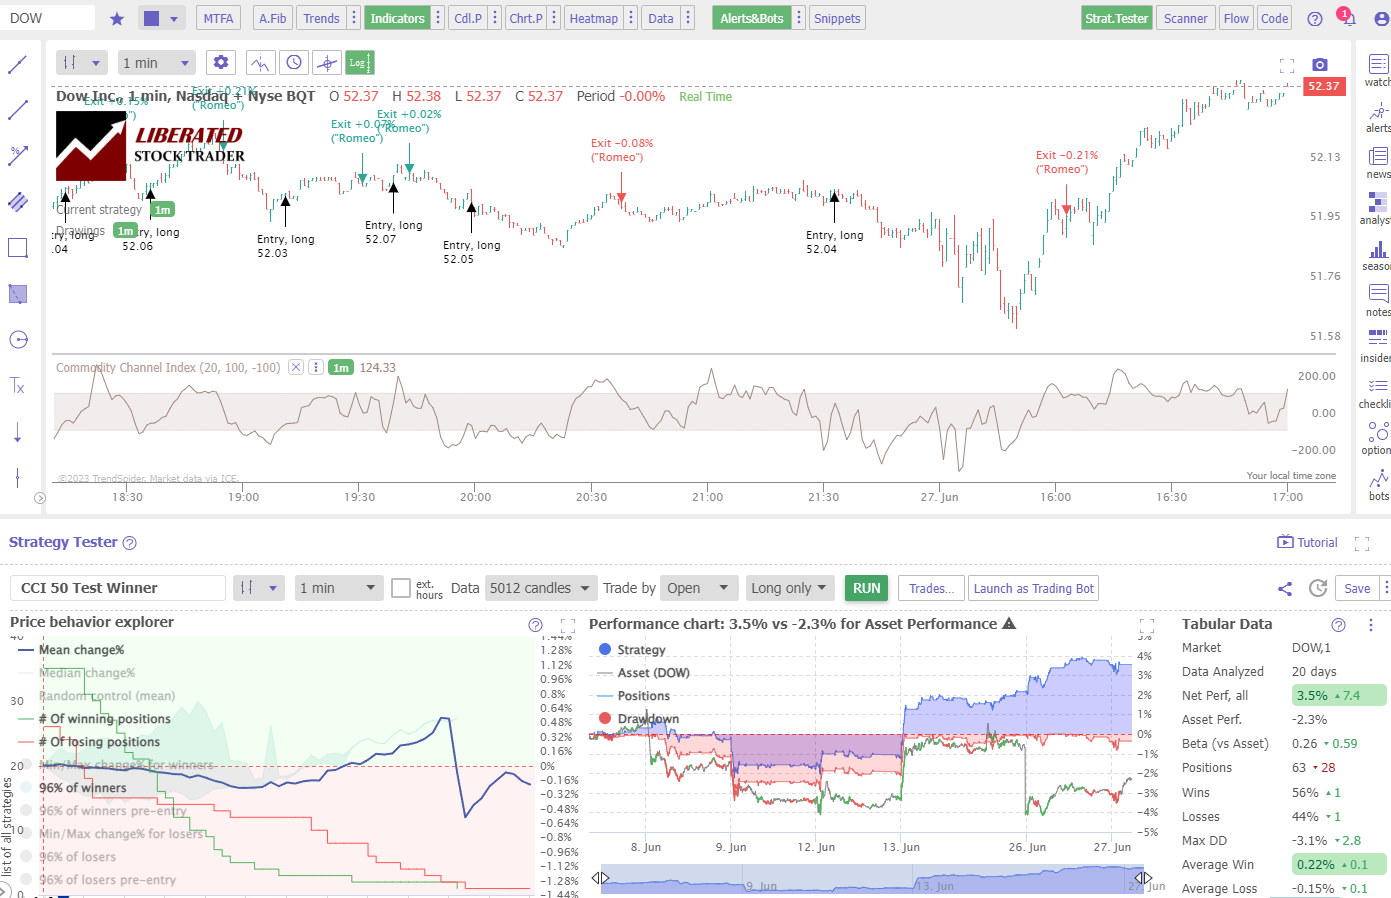
Test Results
I tested the standard configuration of the CCI indicator (20,100,-100) on the Dow Jones Industrial Average stocks on four timeframes: 1-minute, 5-minute, 1-hour, and daily charts, and the results were very poor. On a 1-minute chart, the Commodity Channel Index produced a 50% success rate, which is very high for a 60-second chart. On all other timeframes, the standard setting was unprofitable.
| CCI Setting | OHLC Chart | Index | Duration | % Winners | Avg # Trades |
| 20 | 1-min | DJ30 | 20 Days | 50% | 98 |
| 20 | 5-min | DJ30 | 2 Months | 13% | 64 |
| 30 | 5-min | DJ30 | 3 Months | 10% | 42 |
| 50 | 1-hour | DJ30 | 2 Years | 47% | 63 |
| 50 | Daily | DJ30 | 10 Years | 50% | 22 |
| 50 | Daily | S&P 500 | 20 Years | 53% | 21 |
The best results were discovered using the CCI with a 50 setting on daily charts; this produced a 50% win rate on the Dow Jones 30 stocks and a 53% success rate on the S&P 500.
This means that 53% of stocks beat a buy-and-hold strategy. But more importantly, overall, the strategy significantly beat the S&P 500 over 20 years because the profits of the winning trades outnumbered the losses of the losing trades.
8. Bollinger Bands – 47% Win Rate
Bollinger Bands are a technical analysis chart indicator designed to show when there is an oversold or overbought condition in the markets.
The bands resemble trendlines and consist of three lines; the middle line is a 20-day simple moving average, and the upper and lower lines are two standard deviations +/- the SMA.
Bollinger Bands can be used in various ways to identify trading opportunities. Traders often use the distance between the outer bands to measure volatility and look for potential trade entry points.
If prices move outside of the upper or lower limits of the indicator, it could signal that the price is either overbought or oversold, and a trader could take advantage of these situations. Additionally, Bollinger Bands can help you identify price action trends and potential support and resistance levels.
Bollinger Band Test on a 1-Minute Day Trading Chart
Our testing of Merck (Ticker: MRK) over 21 days shows the Bollinger Bands strategy returned a profit of +2.8% versus a buy-and-hold return of 0.1%. This is a good return, with 40 trades, 70% of which were profitable, and the average profit was 0.28%
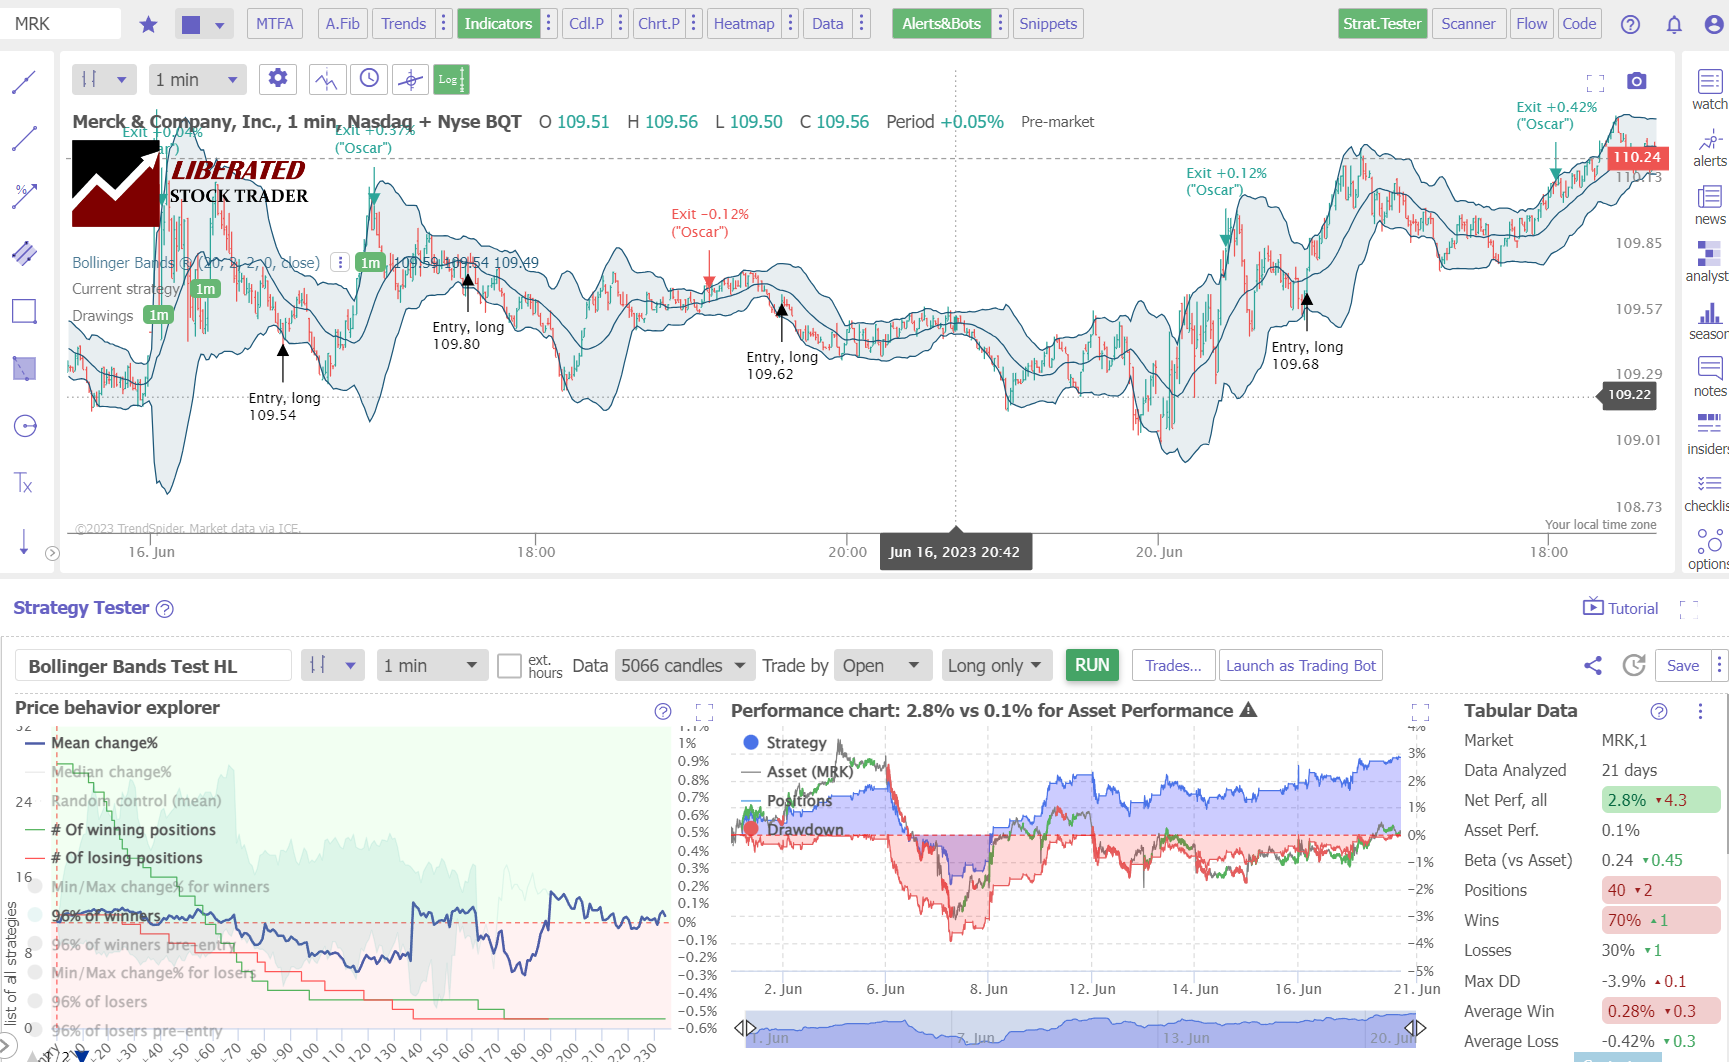
While this specific ticker was successful, Bollinger Bands’ overall performance was very poor on a 1-minute chart, with 77% of stocks on the DJ-30 resulting in a loss.
Test Results
Our 360 years of TrendSpider backtests conclusively revealed that the best setting for Bollinger Bands is SME 20, with two standard Deviations on a 60-minute chart. This produced a win rate of 47% versus a buy-and-hold strategy. That might not seem like more than a 50-50 chance of success, but the profitable stocks were incredibly successful, and overall, the strategy works.
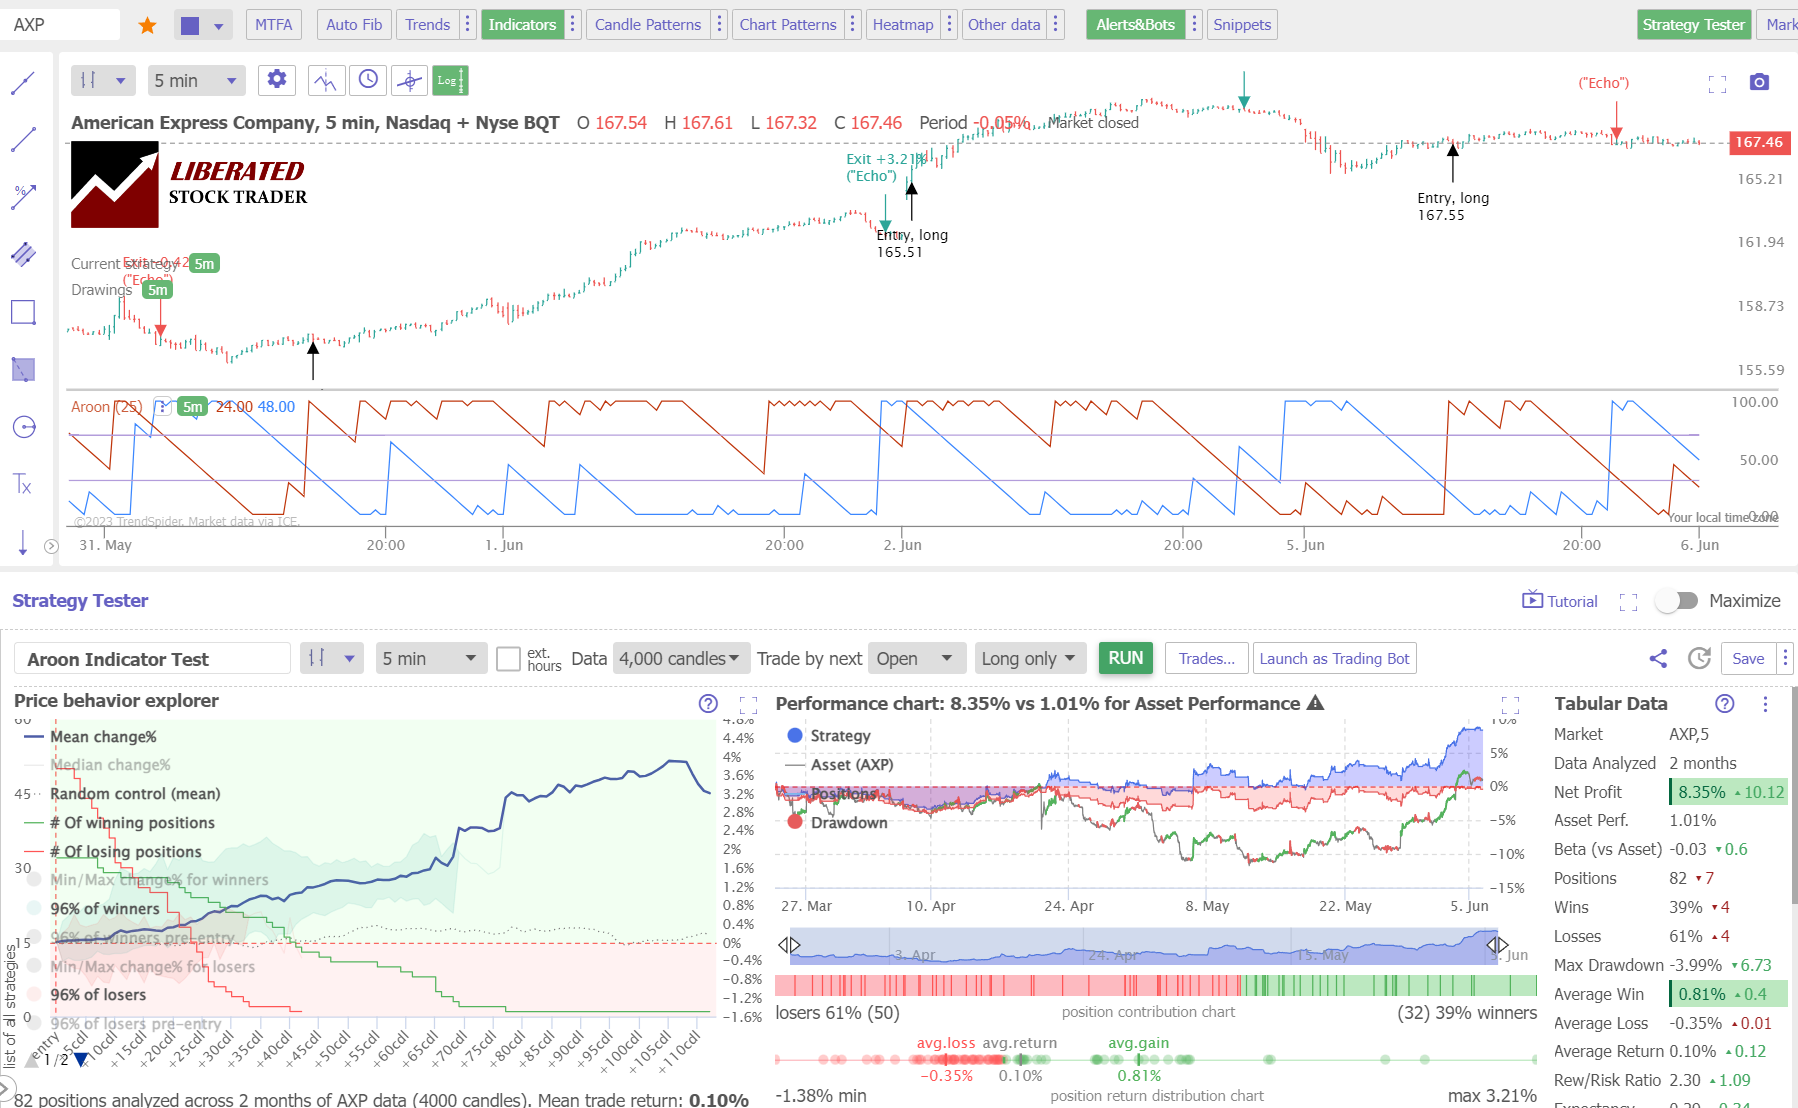
9. Aroon Indicator – 47% Win Rate
The Aroon indicator is best used to identify potential trend reversals and determine when a trend is strong or weakening. When both lines are close together, it can indicate that a trend is weakening and may be about to reverse.
A higher reading for either line indicates that the trend is strengthening.
Additionally, the indicator helps preemptively pinpoint support and resistance levels, enabling traders to execute entry and exit signals strategically. Furthermore, the Aroon indicator serves as a momentum gauge, helping traders detect potential breakouts and emerging trends. Proficiently timing trade entries and exits is paramount to successful trading; thus, incorporating the Aroon indicator can significantly enhance traders’ profitability.
By utilizing the Aroon indicator, traders can identify potential buy and sell signals based on line crossovers. A bullish signal arises when the Aroon Up line surpasses the Aroon Down line, signifying the possible commencement of an uptrend.
Conversely, a bearish signal emerges when the Aroon Down line exceeds the Aroon Up line, indicating a potential downtrend. Traders can use either of these signals to indicate entering or exiting a position.
Aroon Indicator Test: 5-Minute Chart
Our testing of American Express Company (Ticker: AXP) on a 5-minute chart over two months shows an Aroon-25 strategy returning a profit of +8.35% versus the buy-and-hold return of 1.01%. There were 82 trades with an average win of 0.81% versus a loss of -0.35%. However, only 39% of trades were winners.
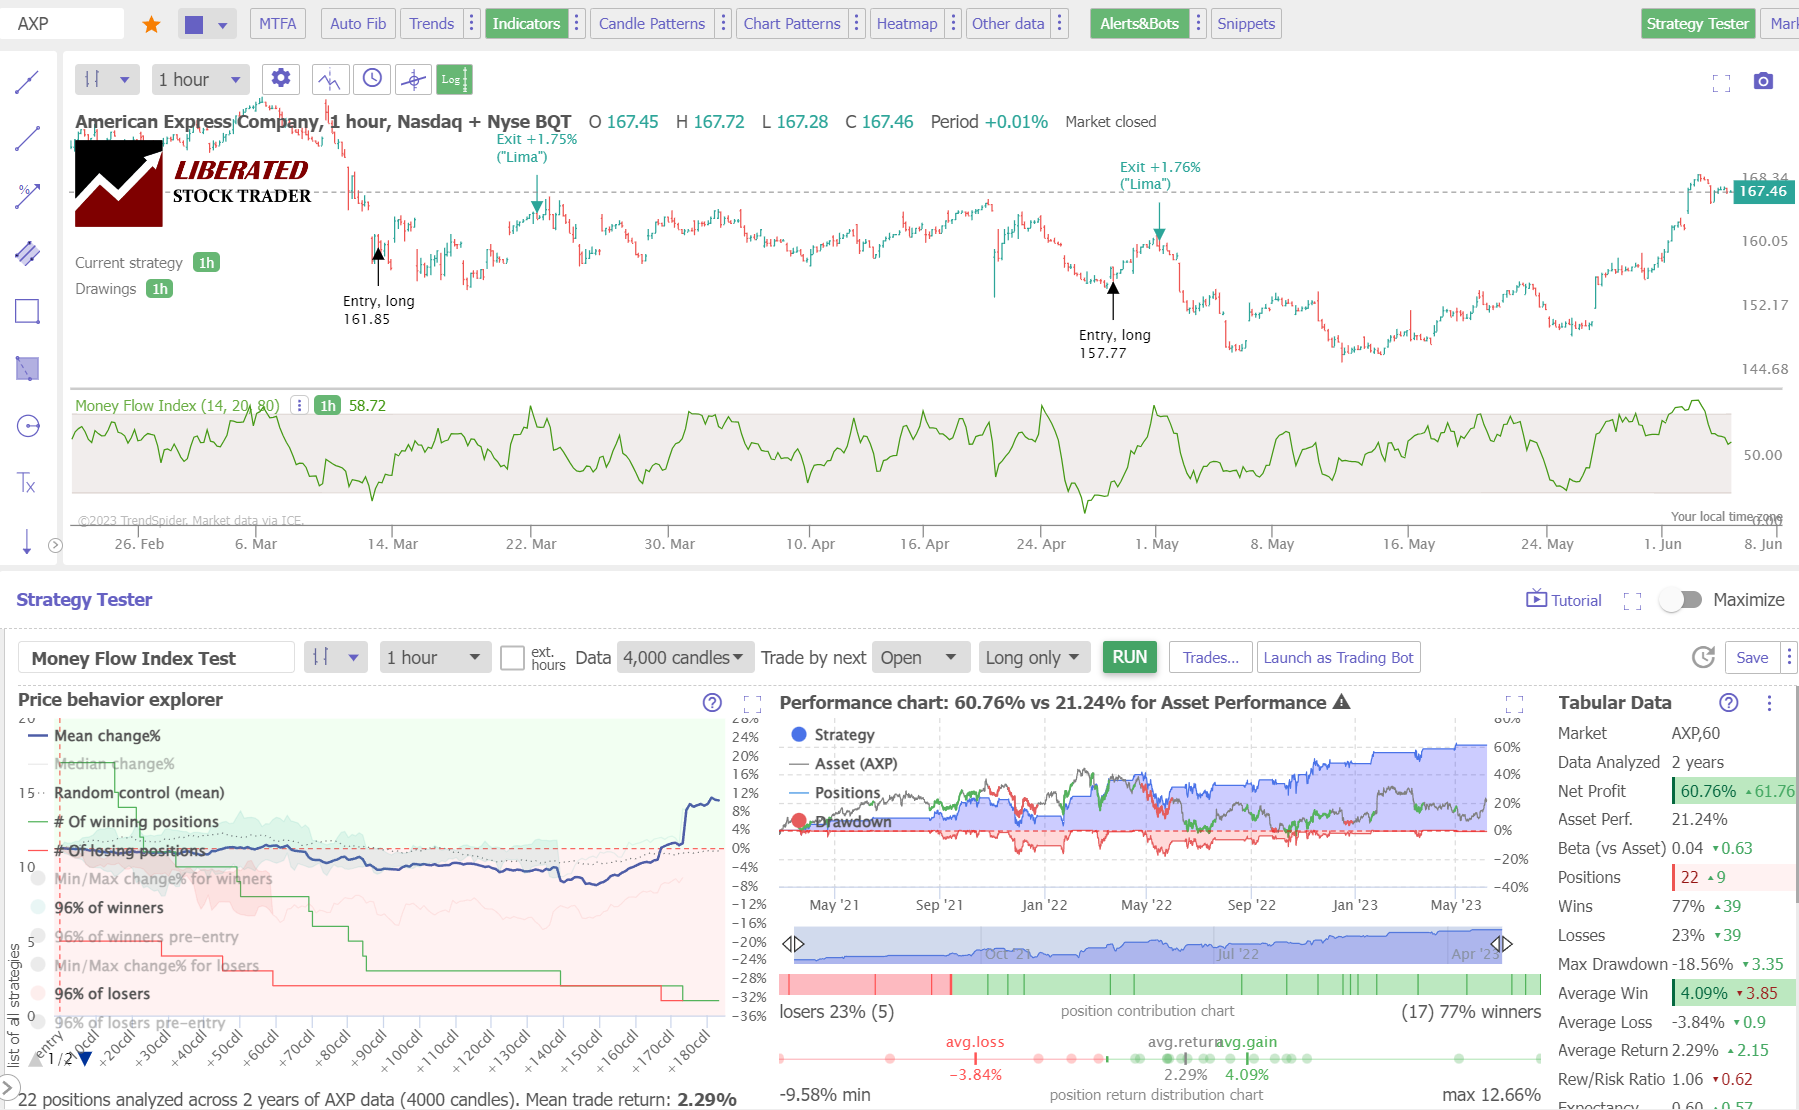
10. Money Flow Index – 43% Win Rate
The Money Flow Index (MFI) is a popular technical analysis indicator that measures the flow of funds into and out of an asset over a given period.
MFI is based on the relationship between the asset’s price movement and volume. The MFI scales between 0 and 100, with higher values signifying more buying pressure and lower values indicating more selling pressure.
The MFI is an oscillating indicator moving between 0 and 100; higher values indicate more buying pressure, while lower values indicate more selling pressure.
The MFI measures the amount of money flowing into and out of an asset over time. It uses price and volume data to determine whether an asset is bought or sold in large quantities, allowing traders to speculate on possible market trends. Combining these two data points gives the MFI a more comprehensive picture of market sentiment than any single data point.
Test Results
I tested the standard configuration of Money Flow Index 14 on the Dow Jones Industrial Average stocks on four timeframes: 1-minute, 5-minute, 1-hour, and daily charts, and the results were surprising. On a 1-minute chart, the Money Flow Index produced a 43% success rate, which is very high for a 60-second chart. MFI produced a 43% win rate on an hourly chart over two years versus a buy-and-hold strategy.
This means that 57% of stocks traded using this strategy did not beat a buy-and-hold strategy, but overall, combining all trades, this indicator produces outstanding results.
Interestingly, the standard setting of Money Flow Index 14 on a daily chart, widely recommended by supposed experts, produced an incredibly poor 10% win rate.
| Money Flow Index | OHLC Chart | Duration | % Winners | Avg # Trades |
| Setting 14 Best | 1-min | 20 Days | 43% | 30 |
| Setting 14 | 5-min | 3 Months | 23% | 26 |
| Setting 14 Best | 1-hour | 2 Years | 43% | 23 |
| Setting 14 | Daily | 12 Years | 10% | 16 |
| Average | 30% | 38 |
11. Stochastic Indicator – 43% Win Rate
The Stochastic oscillator measures momentum based on price action over a specified period. It is calculated from the security’s closing price and compares it with its price range over a user-defined number of periods.
The oscillator ranges between 0 and 100. Values above 80 indicate an overbought market, meaning that prices may soon come down, thus a possible sell signal.
Prices below 20 are considered oversold, meaning a possible buy signal. The oscillator can also form crossovers, which can be used as another indication of potential buying or selling signals.
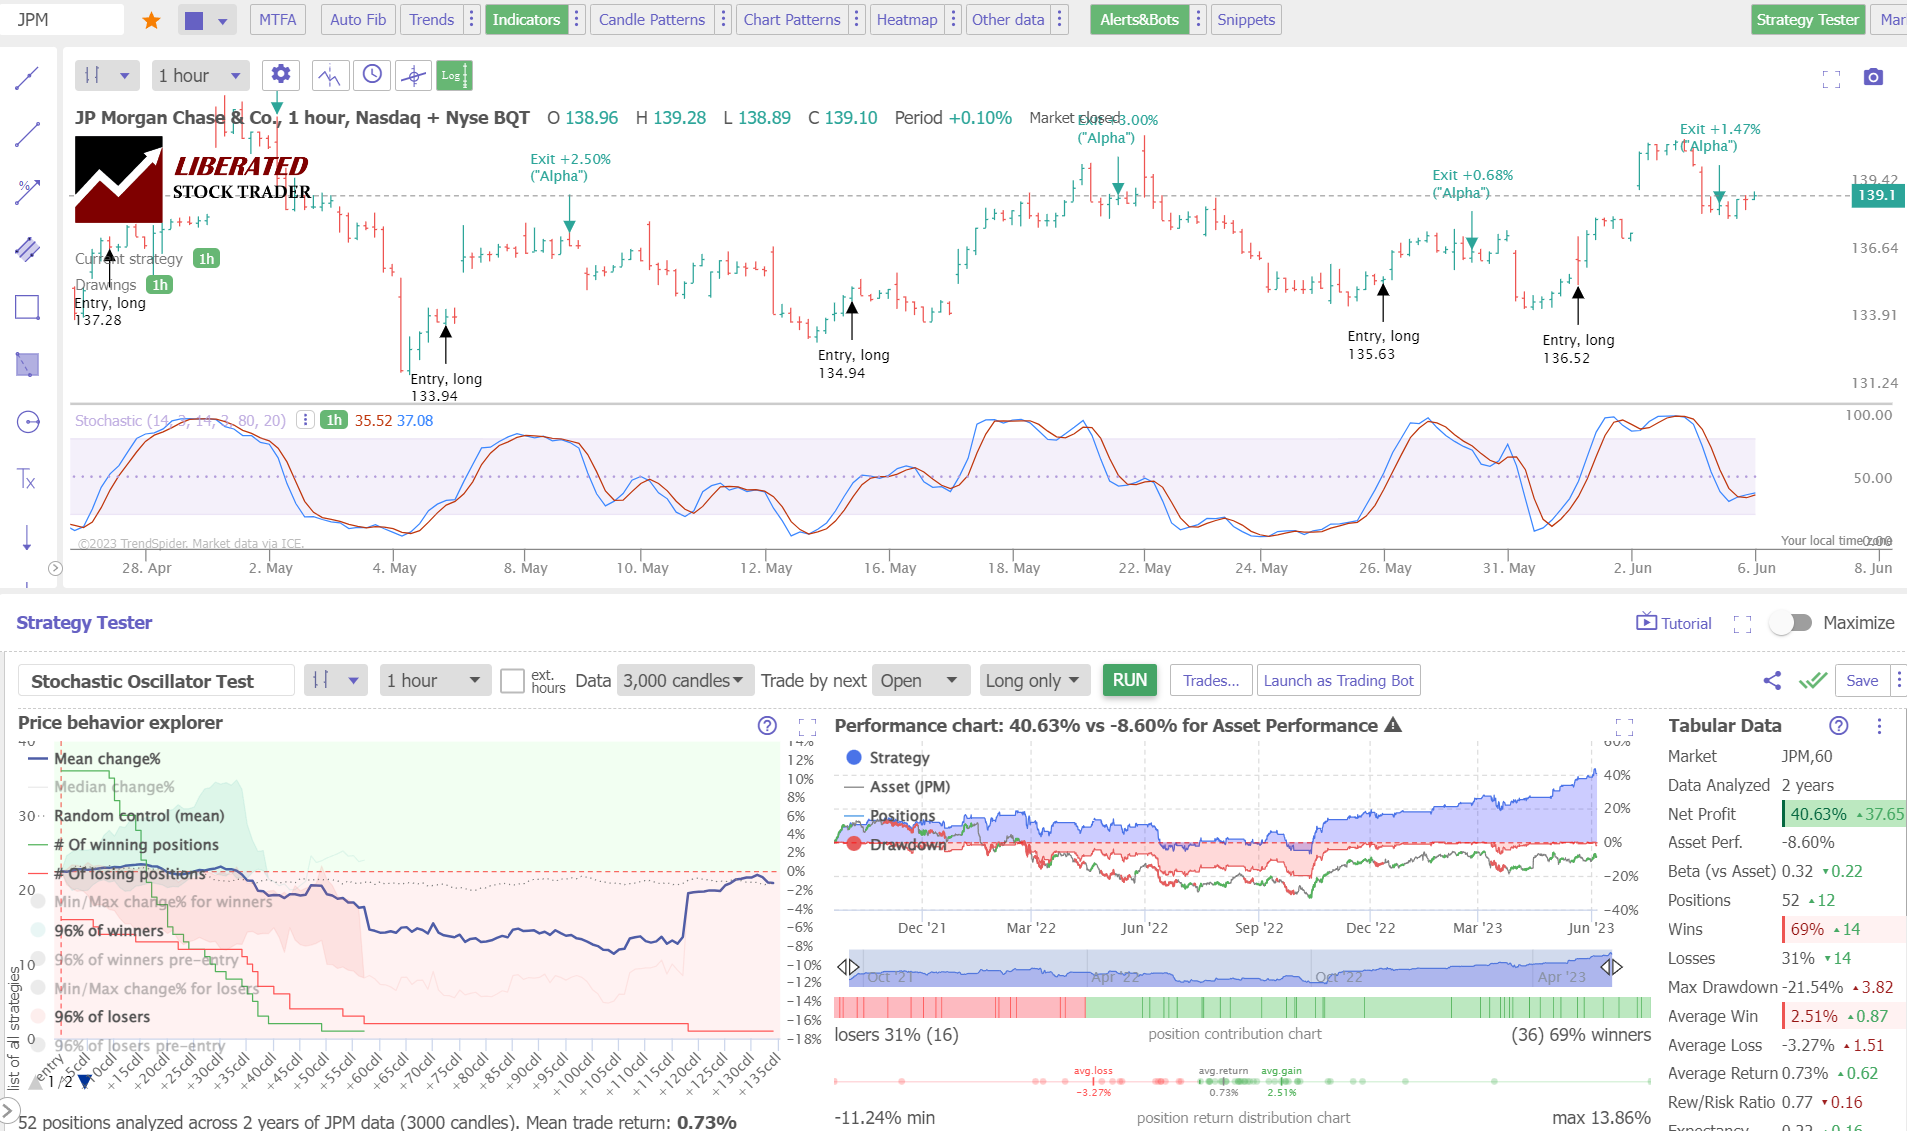
Test Results
Our testing of JP Morgan Chase & Co. over 12 years shows that a Stochastic Oscillator strategy returned a profit of +40% versus the buy-and-hold return of -8.6%. This is a vastly superior return versus the market, and this difference is due to Stochastics working well on hourly charts. There were 52 trades, with average winning trades at 69%.
Overall, the indicator configured on a 60-minute OHLC chart beats the market 43% of the time.
Why are Heikin Ashi Charts Better for Trading?
Why do Heikin Ashi charts perform better with many chart indicators, such as Moving Averages, Keltner Channels, and Price Rate of Change? I believe it is because price averaging removes the extreme volatility associated with traditional OHLC bars. This means fewer trades in consolidating markets and fewer small losses.
Professional traders may assume, as I did, that the Heikin Ashi chart distorts the pricing because it averages the OHLC of the candles. However, we can achieve realistic entry and exit criteria by using TrendSpider’s HL2 setting, meaning the average price of candles is high and low. I proof-checked individual trades, which were reasonable.
What is backtesting, and why is it important?
Backtesting tests a strategy or algorithm on historical data for accuracy and reliability. It’s important because it gives traders insights into how their strategies may perform in real-time trading conditions.
Backtesting can refine strategies and identify potential flaws before risking real money. It is also useful for assessing the effectiveness of different indicators, patterns, and charts. Backtesting is a crucial component of any effective trading strategy.
FAQ
Are indicators useful in trading?
Yes, indicators are useful in trading because they provide insight into supply, demand and trading signals. It is important to understand how each indicator works and what type of trading strategies they are best suited for. Backtesting indicators is key to developing a profitable trading strategy.
Do indicators work in trading?
Yes, indicators do work well in trading. According to our testing, about 50% of indicators can be profitable, but many also underperform. Our testing shows ROC and VWAP work approximately 93% versus a buy-and-hold strategy.
How many trading indicators are there?
There are over 300 trading indicators available, the most reliable and profitable ones being Relative Strength Index (RSI), Money Flow Index (MFI), Stochastic Oscillator, VWAP, and Commodity Channel Index.
What are the best indicators for day trading TradingView?
The best TradingView indicators are ROC and VWAP, each demonstrating a 93 percent win rate when combined with a Heikin Ashi chart.
What is the best indicator for 5-minute trading?
According to our testing, the best indicators for a 5-minute chart are the Price Rate of Change and the Volume Weighted Average Price, yielding a 93 percent win rate versus a buy-and-hold strategy on DJ-30 stocks.
What is a leading indicator in day trading?
A leading indicator in day trading is the Relative Strength Index (RSI). RSI compares recent gains to losses over a specified period and can predict short-term market moves. It usually ranges between 0 and 100, with values above 70 considered overbought and below 30 considered oversold.
How many indicators do you need to day trade?
It is recommended to use at least two indicators for day trading. This could include a trend, momentum, and volume indicator to give you an idea of where the market is heading.
Is TradingView good for day trading?
Yes, TradingView is good for day trading, but Trade Ideas and TrendSpider, provide additional benefits over TradingView for day traders. Trade-Ideas uses AI to pinpoint specific high-probability trades. TrendSpider has excellent backtesting and auto-trading, which greatly benefits day traders.
Which indicator is best for 1-minute charts?
According to our decades of tests, there is no best indicator for 1-minute charts, as the price volatility is random at this timeframe, leading to excessive repeated small losses. We would not recommend anyone trade 1-minute charts.
Hi JB, I used TrendSpider to perform the research on thousands of trades in this article. Take a look at my testing using this software. TrendSpider Test.
wow, these results are impressive, how did you get such accurate results for stock chart indicators? Thanks for the article.