For ambitious investors, beating the market feels like the ultimate challenge—almost an impossible feat! But fear not! With the right strategies and a winning mindset, you can turn this aspiration into reality.
Beating the stock market consistently may be tough, but it’s definitely not impossible! Legendary investors like O’Neill, Greenblatt, Buffett, and Klarman have mastered this art. I dive into their strategies and reveal the most effective ways for you to implement them.
With 20 years of experience crafting investment strategies, I’m excited to share this in-depth article featuring 12 powerful strategies from top investors, portfolio managers, and me. Dive in and discover how you can take control and outsmart the market on your own terms!
Legendary Ways to Try To Beat The Market
- The Motley Fool Growth Stock Strategy.
- Joel Greenblatt’s Magic Formula Investing.
- William O’Neil’s CANSLIM Investing Method.
- Warren Buffett’s Value Investing Method.
- Seth Klarman’s Margin of Safety.
- John Bogle’s Index Tracking Fund Investing.
What Does Beating the Market Mean?
To beat the market, your stock investments must outperform the underlying stock index. In the USA, the market to beat is generally the 8% annual return of the S&P500 index. Anyone could beat the market in a single year, but outperforming the market over the long term is the challenge.
Can You Beat the Stock Market?
Yes, according to some of the greatest investors, you can beat the market. You will need investing knowledge and the discipline to implement a specific investing strategy that can lead to market outperformance. There are different approaches to using value investing, growth investing, or simply excellent stock selection.
I will also show you how to implement all the strategies so that you can control your investments.
Can You Beat The Market Consistently?
You need to have a defined and actionable investment strategy to beat the market consistently. This means finding and investing in stocks with a significant chance of returning more than 8% annually. Most market-beating systems will have been backtested for many years to prove the validity of the system’s hypothesis.
The following list of famous strategies has beaten the market in the past, and many still do today. But they all have one thing in common: They do not beat the market 100% of the time; even Warren Buffett has an occasional bad year or two.
1. The Motley Fool Method
The Motley Fool team has a 20-year track record of beating the market with their first-class stock research and selection process.
One of the first books I read on investing was the Motley Fool Investment Guide in 1997. The investment team of Tom and David Gardner and I have not looked back since.
After four years of independent testing, I confirm Motley Fool Stock Advisor has an excellent performance track record of stock selection that outperforms the market. Motley Fool offers an impressive stock advisory service for long-term growth investors. However, it is not a full-stack trading service, as it lacks powerful charts, backtesting, and automation.
I subscribe to and invest in the Motley Fool Stock Advisor service using my own funds, as I genuinely believe it offers excellent value for money.
| Test | Tier | Score | Average |
|---|---|---|---|
| Lab Test Composite Score | 4.04 | 4.04 | 4.21 |
| Pricing Index | AAA | $1.37 | $2.74 |
| Value Score (VP) | C | 2.89 | 2.82 |
| Speed & Ease of Use | AAA | 5.00 | 4.50 |
| Chart Analysis Depth Index | C | 0.50 | 3.17 |
| Chart Pattern Depth & Accuracy | N/A | N/A | 2.73 |
| Scanning Performance | C | 1.34 | 3.38 |
| Backtesting Performance | N/A | N/A | 3.38 |
| Trading Bot & Auto-Trading Reliability | N/A | N/A | 2.50 |
| AI & Algo Index | B | 3.50 | 2.00 |
| Alert Speed | C | 2.67 | 3.67 |
| Trade Signal Quality | AAA | 5.00 | 0.00 |
| Broker Connectivity & Ecosystem Depth | C | 2.00 | 2.00 |
| Portfolio Tool Performance | B | 3.50 | 2.80 |
| Financial News Speed & Depth | B | 3.00 | 2.80 |
| Community Utility Index (CUI) | A | 4.25 | 3.25 |
| Support Infrastructure & SLA Audit | B | 3.00 | 3.75 |
Tested using rating system v3.
See the 2026 v3 58-point Motley Fool test and benchmarks.
Pros
✔ AAA Stock Selection
✔ Proven to beat the market consistently over 20 years
✔ Ability to build watchlists & entire portfolios
✔ Very Cost-effective service
✔ Fully transparent auditing of stock-picking performance
✔ A straightforward and intuitive website
✔ A passionate and loyal community of 700,000 people
Cons
✘ Stock Screener is basic.
✘ It can be tricky to find the original research reports.
✘ Charting is very basic.
✘ No Backtesting
✘ No Broker Integration

My independent Motley Fool tests confirm that Motley Fool Stock Advisor outperforms the S&P 500; they are a mature stock advisory service with a proven track record. Since the Motley Fool team reorganized its approach to stock investing advice in 2002, it claims an excellent record of beating the market with its Stock Advisor service.
While I love to perform my own research and not be influenced by others, I have found the Motley Fool Stock Advisor Service incredibly useful.
The team focuses on stocks that will significantly beat the S&P 500 over the long term. They then provide lightweight, easy-to-read research reports and recommend why they feel the stock will be a superior long-term investment.
Motley Fool does not try to perform research on every stock and fund in the USA. The team focuses on stocks that will significantly beat the S&P 500 over the long term.
You can manage your favorite stocks through their simple-to-use portfolio tracker, although, unlike Stock Rover, it cannot connect to your broker. Motley Fool is the first in this list to provide its audited track record of performance against the underlying benchmark. The service’s track record is unique; it tries to beat the market and help you succeed in the long term. You could give it a try and follow its advice.
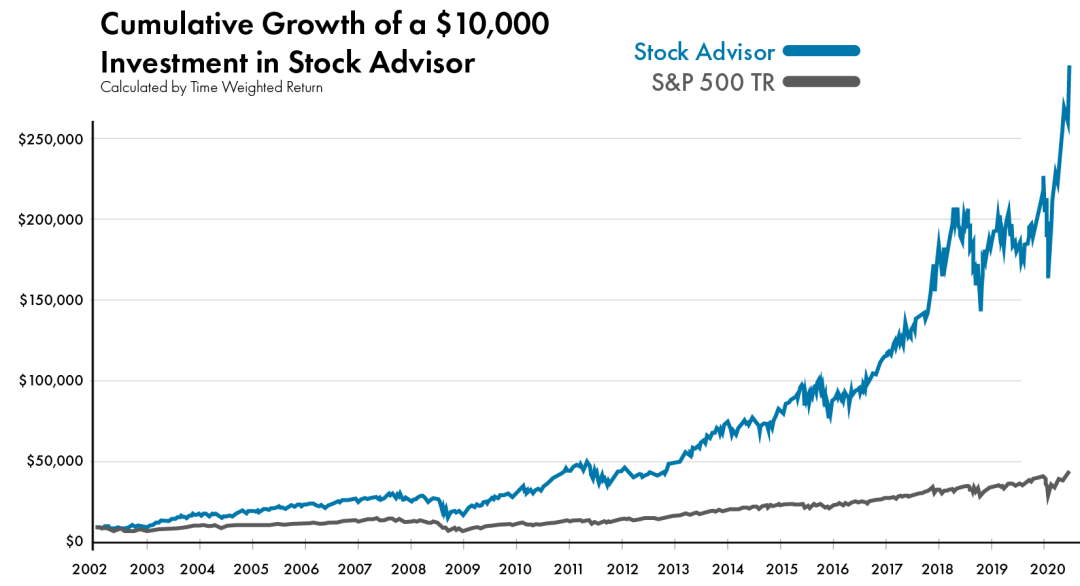
Motley Fool Stock Advisor Portfolio Performance 2002 to 2020
- Motley Fool Stock Advisor 421%
- S&P 500 85%
My independent analysis of the stock advisor service’s audited results reveals that since 2002, 48% of the stocks beat the S&P 500. The average winning stock outperformed the S&P 500 by 780%. 28% of the stocks recommended lost 42% on average, while 82% of the stocks made a profit averaging 640%.
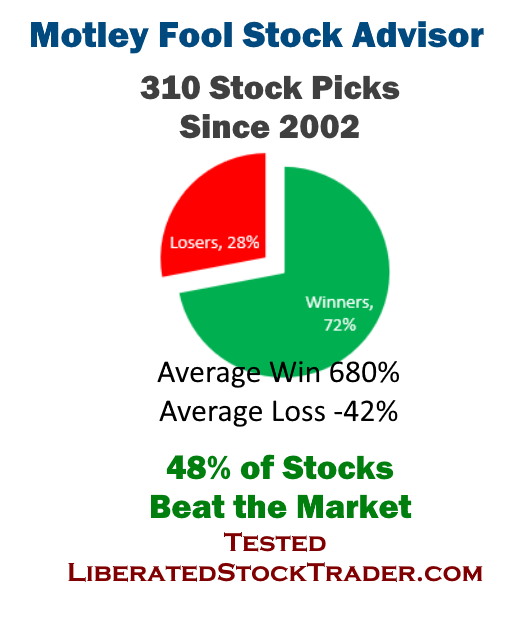
What does this mean? You still have a 28% chance of losing money on any single stock recommendation. However, at current performance levels, you have a 72% chance of investing in a company that will make you a profit.
Motley Fool Stock Advisor Summary
The Stock Advisor service is well-priced at only $99 for your first year and provides an audited track record of successful stock selection. The research reports are easy to read, act upon, and target long-term investors. They provide specific buy and sell signals on stocks they recommend, but the service does not include fund ratings.
I signed up for the service two years ago because I wanted to see what the competition was up to, but I found the service very simple and the research extremely compelling, insightful, and useful.
You could give them a try and follow their advice.
2. Joel Greenblatt’s Magic Formula
This market-beating system is provided by the investing legend Joel Greenblatt in his best-selling book “The Little Book that Still Beats the Market.“
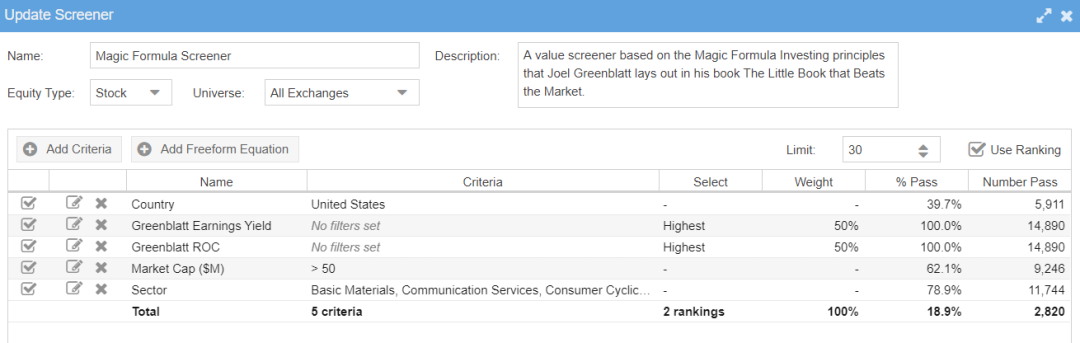
Greenblatt’s strategy is called the Magic Formula, and it is based on two specific formulas: the Greenblatt ROC and the Greenblatt Earnings Yield.

I have backtested this system personally, and it works very well. It is a little high maintenance, but the lessons in the book are vital.
Greenblatt Return on Capital Ratio
Good Companies Make Great Use of Assets!
This variation of Return on Capital takes Earnings before Interest and Taxation (EBIT) as a percent of Net Property, Plant, and Equipment (PPandE) plus Current Assets.
Greenblatt Earnings Yield
This variation of earnings yield compares Earnings Before Interest and Taxation (EBIT) to Enterprise Value. Joel Greenblatt uses it in his bestselling book The Little Book That Beats the Market.
Using the Magic Formula to Find Stocks
Register with https://www.magicformulainvesting.com/, the website accompanying the book, for free access to a basic stock screener that implements the magic formula.
The problem is that the site does not allow you to change screener parameters or specify your company filters. It also does not help you track which companies you want to invest in, show your past performance, or provide any real financial data.
Try Our Calculator: Magic Formula Calculator: Greenblatt Earnings Yield
How to Utilize the Magic Formula
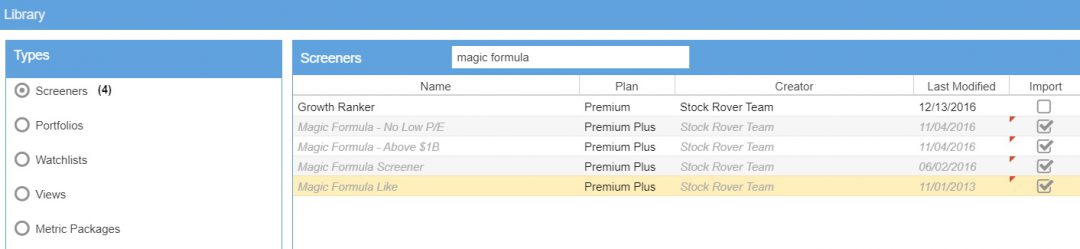
Stock Rover has the Magic Formula Screener built in and is available for Premium Plus Members.
You will need a Premium Plus Membership, which gives you access to all the criteria and the database with a unique 10-year history.
Importing the Magic Formula Strategy into Stock Rover
The Magic Formula Criteria
Joel Greenblatt specifically suggests selling all your “Magic Formula” stocks at the end of the year, re-running the screener, and buying the newly recommended shares on the first trading day of the new year to achieve market-beating results.
Stock Rover 4.7/5⭐ : My Top Pick for Smart Investors
Investing In Stocks Can Be Complicated. Stock Rover Makes It Easy.
★
Growth Investing - with industry-leading
Research Reports ★
★ Value Investing - using Warren Buffett's Fair Value and Margin-of-Safety ★
★ Income Investing - rank by yield, growth, quality, and safety using 650 metrics ★

"I have been researching and investing in stocks for 20 years! I now manage all my long-term investments using Stock Rover." — Barry D. Moore, Founder: LiberatedStockTrader.com
3. The CANSLIM Method
CANSLIM is a stock investing strategy designed by William J. O’Neil to produce market-beating profit performance. Using the CAN SLIM criteria in your investing should mean profitable returns. Current Earnings, Annual Earnings, New Products, Supply, Leaders, Institutional Sponsorship, and Market Direction are vital criteria.
It combines fundamental analysis and technical analysis into a cohesive strategy.

The CANSLIM Criteria
- C – Current Earnings
- A – Annual Earnings
- N – New Products or Management
- S – Supply and Demand
- L – Leaders
- I – Institutional Ownership
- M – Market Direction
The full breakdown of each element of this strategy, criteria, and how to implement this screener can be found here: A CANSLIM Stock Screener That Beats the Market.
You can also deep dive into CANSLIM in our What is CANSLIM Article.
Implement CANSLIM with the Best Stock Screener
Here are the 5 Steps to implement the Stock Rover CANSLIM stock screening strategy.
1 – Register with Stock Rover
You will need a Premium Plus Membership, which gives you access to all the criteria and the database with a unique 10-year history. It will also allow you to implement all our Warren Buffett screeners, our full list of stock screening strategies, and our Dividend growth and dividend yield strategies.
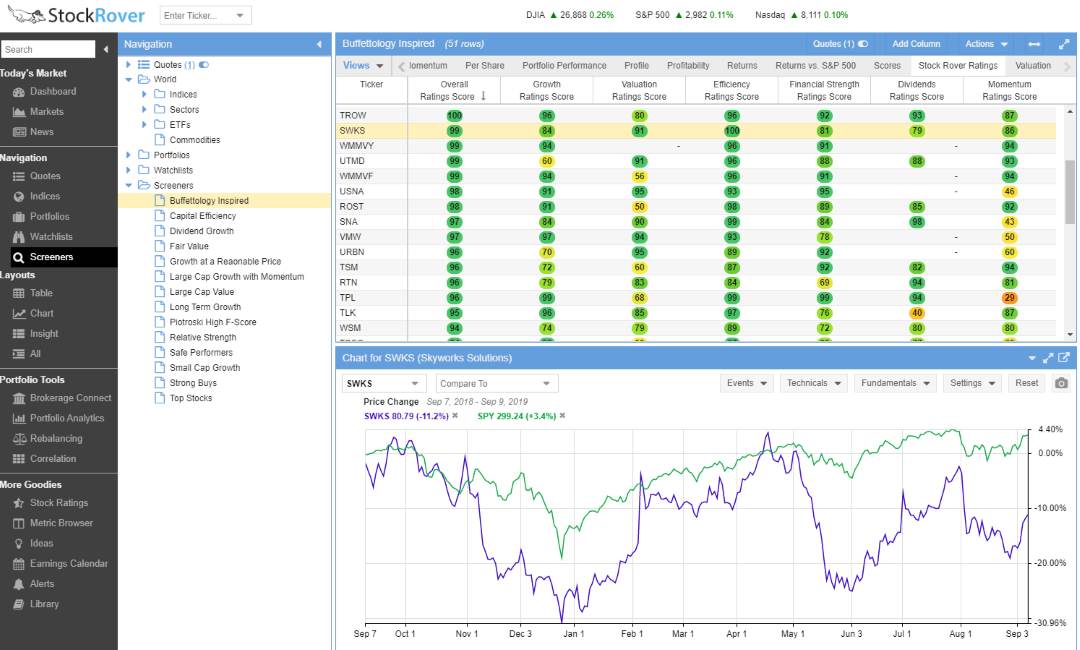
2 – Browse Screener Library
- See the image below.
- Launch Stock Rover and select:
- Screeners (Down Arrow)
- Browse Screener Library
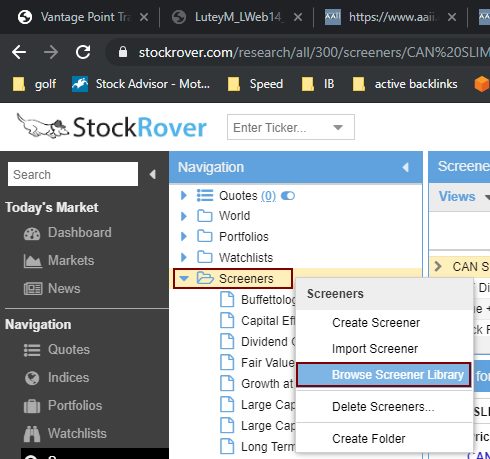
This takes you to the following screen.
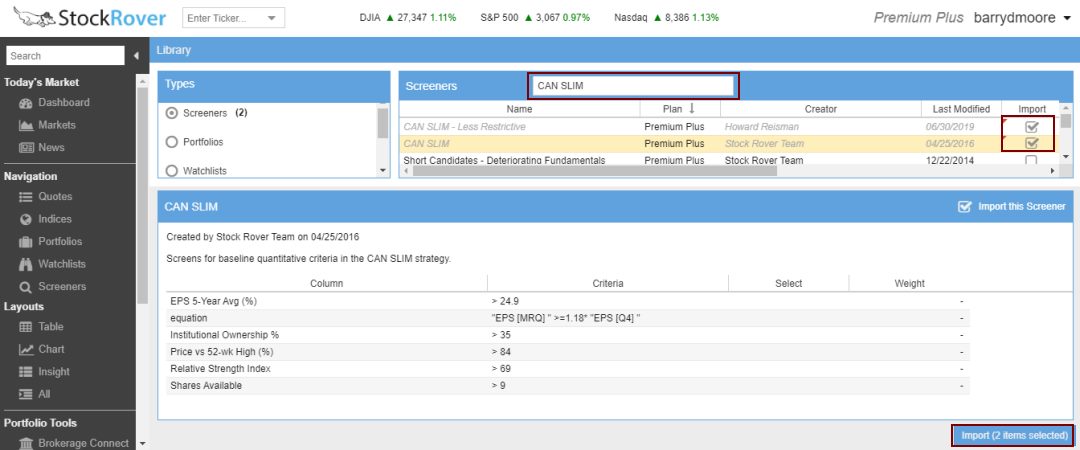
3 – Import CANSLIM Screeners
Stock Rover has a built-in screen for CANSLIM called “CAN SLIM—Less Restrictive,” which has a good performance record.
This is the screener we will be using.
- In the Screeners search box, type “CAN SLIM.”
- Select the two CANSLIM Screeners
- Click Button – Import (2 Items Selected)
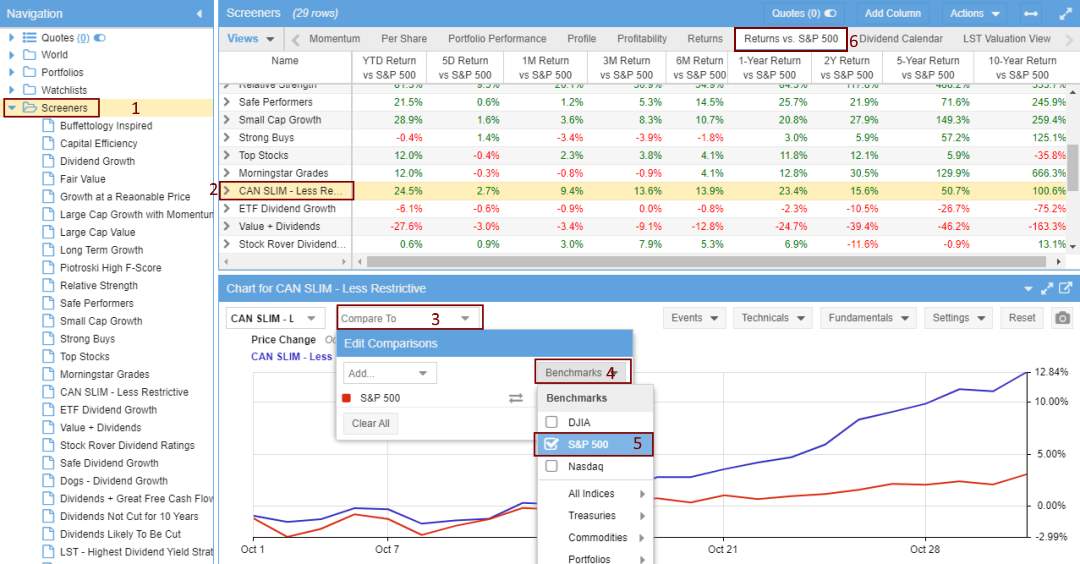
4 – View the Portfolio Performance
Now that you have imported the screener, here is how to set up the excellent comparison view vs. the S&P 500
- Select Screeners
- Select the CAN SLIM – Less Restrictive Screener
- In the Chart Below, Select “Compare To.”
- Select Benchmarks
- Select S&P 500 or NASDAQ
- Select Return vs. S&P 500 Column Views
4. Value Investing: Warren Buffett’s Method
Over the last 50 years, Warren Buffett has proven to be the most successful investor ever. With an average compound rate of return of 23.3% per year, he and his good friend Charlie Munger have a reputation that Wall Street can only dream of. His wise investing has grown his company, Berkshire Hathaway (BRK.A), into a behemoth worth over $500 billion.
But how did Buffett achieve these high investment returns? He analyses stocks better than anyone else and understands what makes a great company.
The most detailed analysis of Buffett’s investing methodology is outlined in the book The New Buffettology by his daughter, Mary Buffett. We will use the Buffettology book, plus the two most important criteria his mentor, the great Benjamin Graham, created: Fair Value (Intrinsic Value) and Margin of Safety.
The Warren Buffett Stock Screener
A Warren Buffett Stock Screener needs to filter on investing criteria such as earnings per share (EPS) growth, consistent return on equity (ROE), high return on invested capital (ROIC), and low debt using the solvency ratio. Finally, the screener needs to calculate the margin of safety using discounted cash flow (DCF).
How Does Buffett Screen for Stocks?
Buffett screens for stocks using specific criteria, such as whether the company is profitable and generating a healthy cash flow. He then predicts and discounts the cash flow ten years into the future. If the cash flow value is 30% higher than the company’s stock market valuation, it has a reasonable margin of safety and is a candidate for purchase.
Specific Rules for the Warren Buffett Investment Include:
- Look for a Fair Value Higher Than The Current Stock Price
- A High Margin Of Safety
- A Strong Earnings Per Share History & Growth Rate
- A Consistently High Return on Equity
- Does the Company Earn a High Return on Total Capital?
- Is the Company Conservatively Financed?
- Is the initial rate of return for the stock greater than the return on US treasury bonds?
5. Seth Klarman’s Margin of Safety
Buying stocks with a large margin of safety means reducing your risk in the trade and maximizing your potential gain. Elite investors Warren Buffett and Seth Klarman popularized the margin of safety method.
What Is The Margin of Safety?
If a company’s stock price is below the actual value of the cash flow (income) and assets of the company, the percentage difference is the Margin of Safety. This is the discounted price at which you buy a share in the company.
If a company is worth $5 per share on the stock market exchange but the value of its earnings, property, and brand is worth $10, then you have a 50% discount.
If you buy the stock at $5, then eventually, the price should rise 100% to $10 per share.
Simple really! Or is it? How about an infographic to help explain?
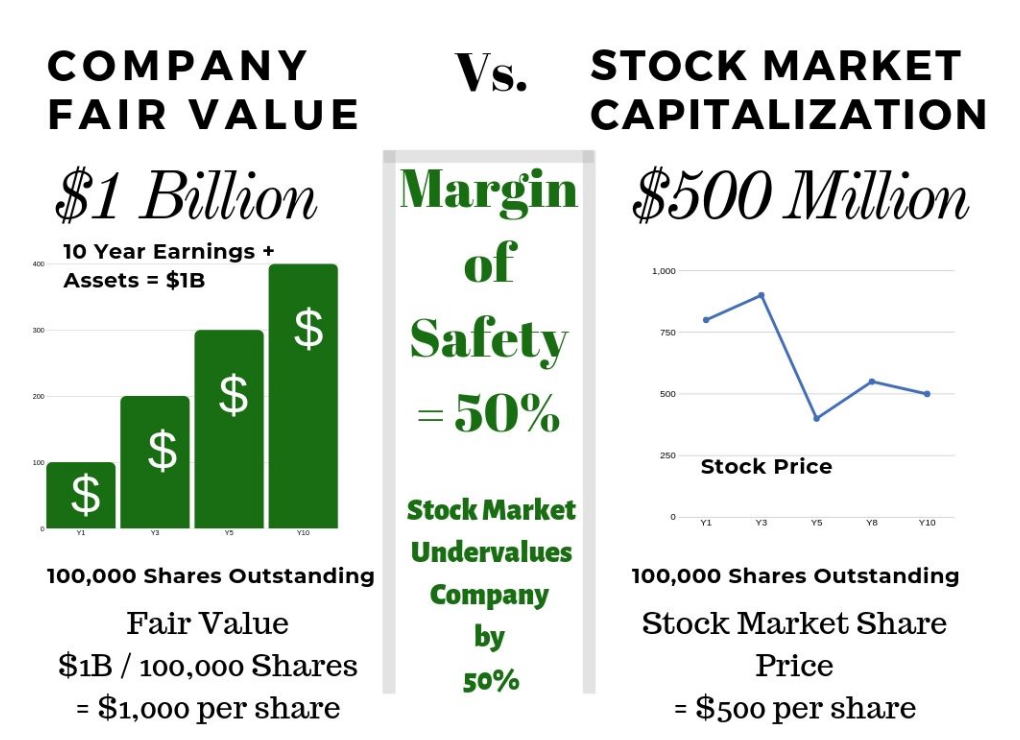
If a stock price is significantly below the company’s fair value, that percentage difference is known as the Margin of Safety. Essentially, the percentage by which the stock market undervalues a company.
In other words, the Margin of Safety is the percentage difference between a company’s Fair Value per share and its actual stock price. If a company’s profits and assets outweigh its stock market valuation, this represents a Margin of Safety for the investor. The higher the margin of safety, the better.
In classic value-investing theory, the margin of safety is the level of risk an investor can live with. The margin of safety estimates the risk a stock buyer takes.
Warren Buffett’s Explanation of Margin of Safety
If you understood a business perfectly and the future of the business, you would need very little in the way of a margin of safety. So, the more vulnerable the business is, assuming you still want to invest in it, the larger the margin of safety you’d need. If you’re driving a truck across a bridge that says it holds 10,000 pounds and you’ve got a 9,800 pound vehicle, if the bridge is 6 inches above the crevice it covers, you may feel okay; but if it’s over the Grand Canyon, you may feel you want a little larger margin of safety. Warren Buffett
Read a detailed explanation of using and applying the Margin of Safety in this article: Margin of Safety – The Key To Warren Buffett’s Wealth.
Calculating Fair Value and Margin of Safety is critical to the value investing strategy. If you want to make good long-term profits, you need to minimize your risk by purchasing companies that sell at a significant discount due to market irrationality. Still, you will need a great stock screener with these calculations built in to be effective and efficient. Stock Rover offers a full 14-day trial and a free service; try Stock Rover.
6. Bogle’s NASDAQ 100 ETF Strategy
If beating the market is defined as your portfolio making a profit higher than that of the S&P 500, then you are in luck. The simplest way to beat the S&P 500 is to invest in a NASDAQ 100 exchange-traded fund (ETF). I have approximately 50% of my investment capital in a NASDAQ ETF. The other 50% I use to invest in individual stocks.
An excellent reason to invest in the NASDAQ 100 is that it simply outperforms all other major developed world indices, including the UK FTSE 100, the German DAX, France, Japan, and the MSCI world index. All major indices lose to the NASDAQ 100.
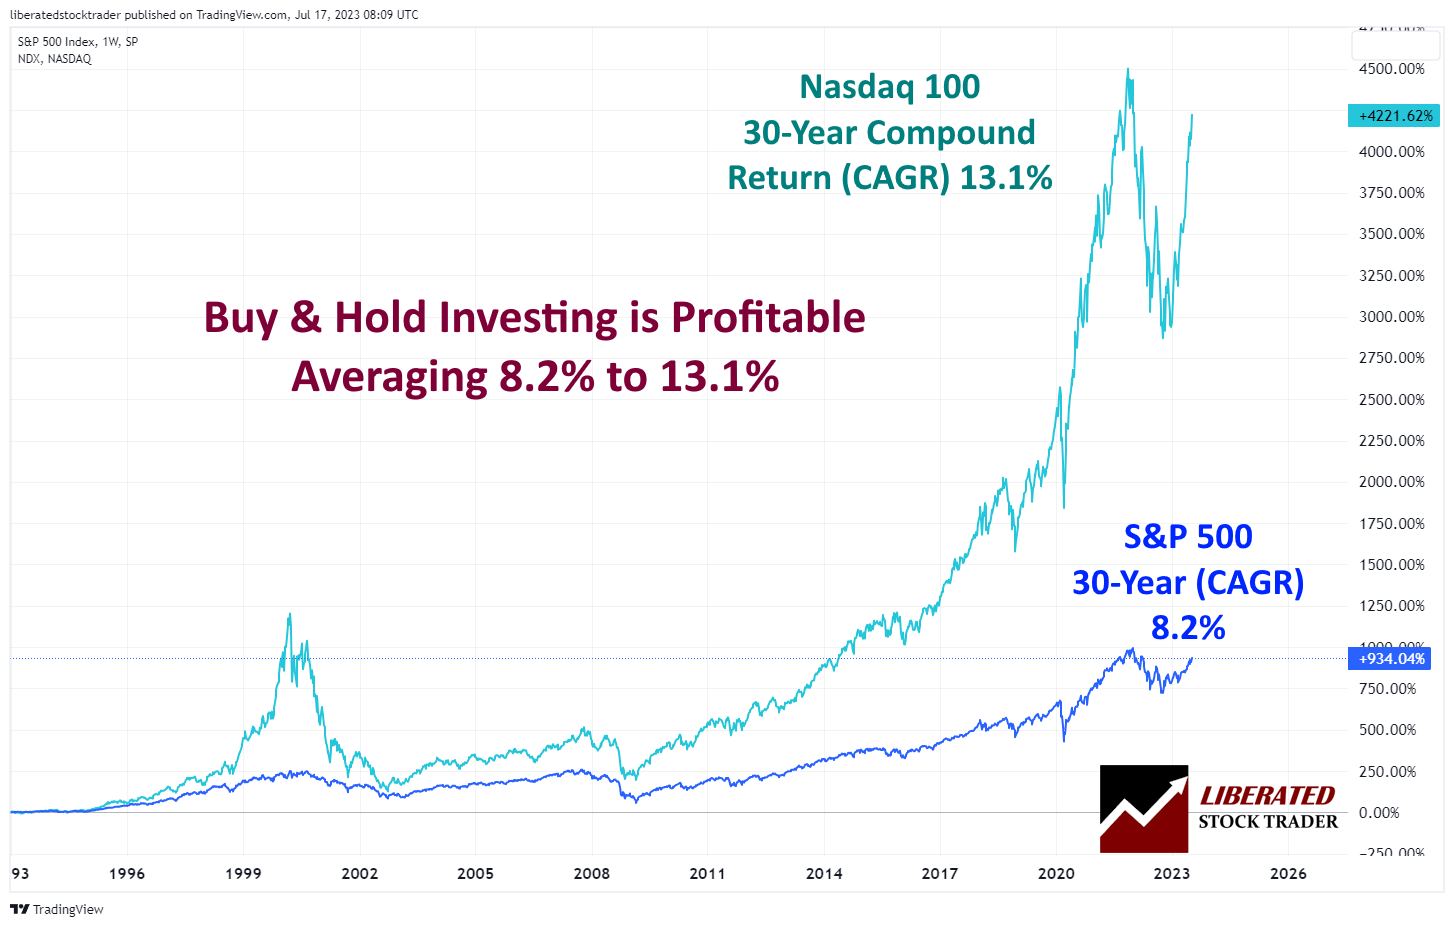
NASDAQ 100 30-Year Performance
As you can see in the above chart, the NASDAQ 100 has far outstripped that of other major G7 economy stock markets.
Table: 30-year returns of the Nasdaq 100
| Index | 30 Year Returns |
| Nasdaq 100 (NDX) | 4,122% |
| Dow Jones Industrial Average (DJIA) | 789% |
| Standard & Poors 500 (S&P 500) | 738% |
| German DAX | 526% |
| The UK. Financial Times Stock Exchange (FTSE 100) | 150% |
| Japan Nikkei | -47% |
7. Liberated Stock Trader Beat the Market System
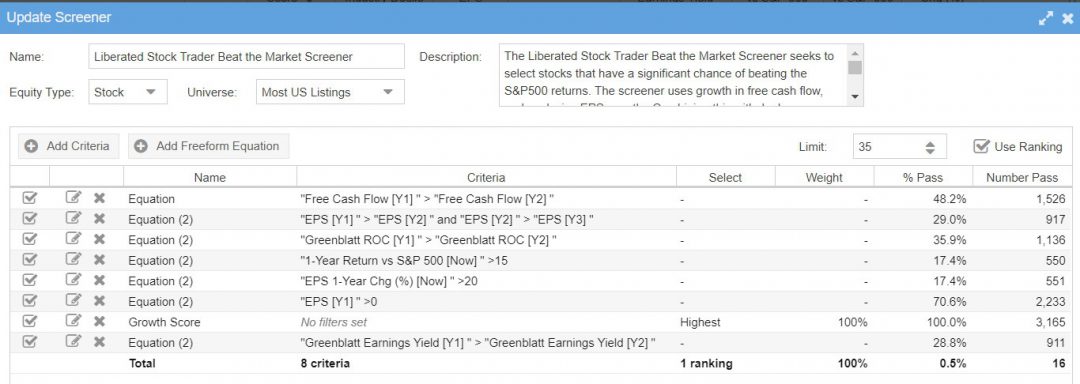
The Liberated Stock Trader Beat the Market Strategy seeks to select stocks with a significant chance of beating the S&P 500 returns. The screener uses growth in free cash flow and explosive EPS growth. Combining this with Joel Greenblatt’s ROC and Earnings Yield formulas, the “Magic Formula,” we have a selection of stocks that beat the market 5 in the last 7 years.
Ever Dreamed of Beating the Stock Market
Most people think that they can't beat the market, and stock picking is a game only Wall Street insiders can win. This simply isn't true. With the right strategy, anyone can beat the market.

The LST Beat the Market Growth Stock Strategy is a proven system that has outperformed the S&P500 in 8 of the last 9 years. We provide all of the research and data needed to make informed decisions, so you no longer have to spend hours trying to find good stocks yourself.
The LST Beat the Market System Selects 35 Growth Stocks and Averages a 25.6% Annual Return
★ 35 Stocks That Already Beat The Market ★
★ Buy The Stocks & Hold For 12 Months - Then Rotate ★
★ Fully Documented Performance Track Record ★
★ Full Strategy Videos & eBook ★
Take The Pain Out Of Stock Selection With a Proven Strategy
LST Beat the Market Screener Performance.
| 9 Year Performance | S&P500 % Gain Jan 1st to Dec 31st | LST Beat the Market Growth Strategy % Gain | Result |
| 2013 | 29.8% | 49.4% | Beat |
| 2014 | 11.4% | 16.9% | Beat |
| 2015 | -0.7% | 2.6% | Beat |
| 2016 | 9.5% | 23.2% | Beat |
| 2017 | 19.4% | 37.4% | Beat |
| 2018 | -6.2% | -24.9% | Lost |
| 2019 | 28.9% | 46.8% | Beat |
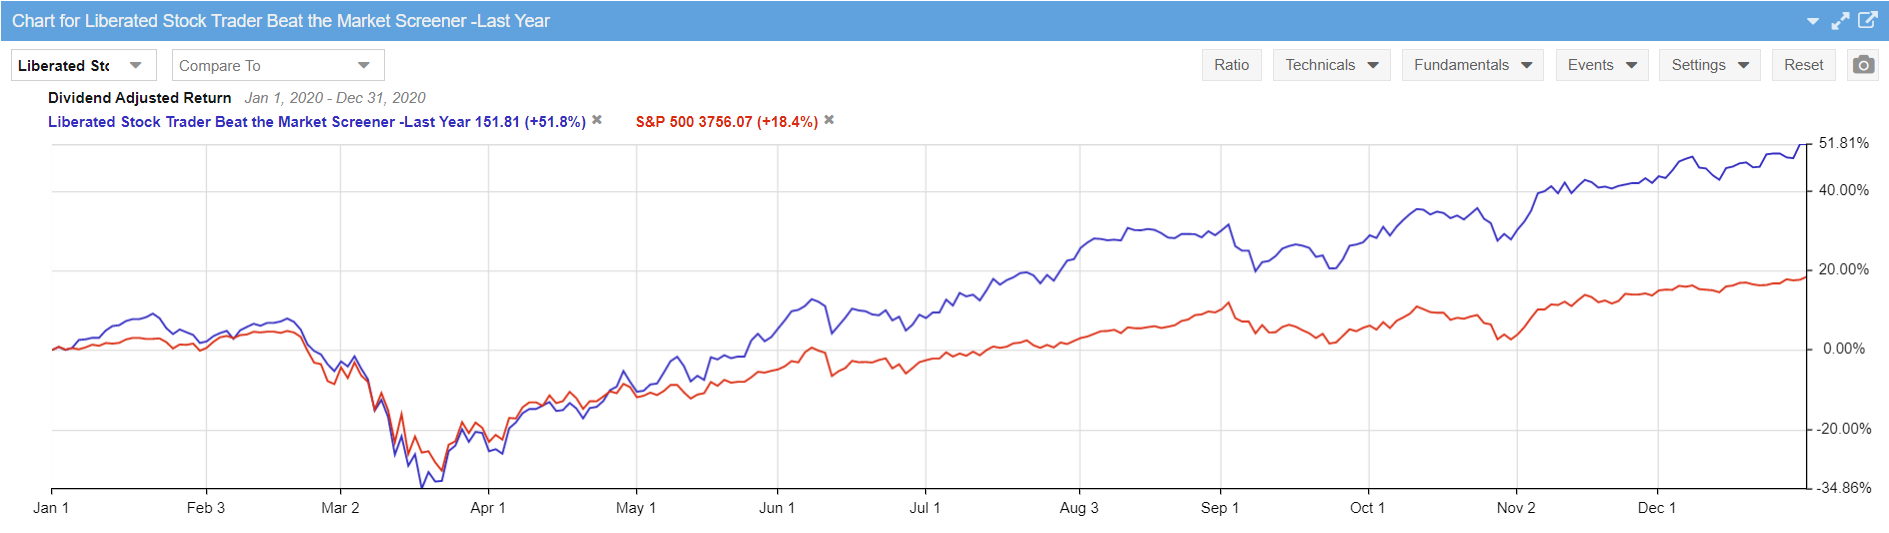
| 2020 | 18.4% | 51.8% | Beat |
| 2021 | 26.9% | 27.2% | Beat |
| Average Yearly Return | 15.27% | 25.6% | Beat |
9-Year Results Based on $100,000 Invested.
| Investment Performance | S&P500 Index Returns | LST Beat the Market Growth Strategy |
| Initial Investment | $100,000 | $100,000 |
| 2013 | $129,800 | $149,400 |
| 2014 | $144,597 | $174,648 |
| 2015 | $134,475 | $179,189 |
| 2016 | $147,250 | $220,761 |
| 2017 | $175,817 | $303,326 |
| 2018 | $164,916 | $227,797 |
| 2019 | $212,577 | $334,407 |
| 2020 | $251,961 | $507,630 |
| 2021 | 319,397 | $645,706 |
| Cumulative 9 Year % Gain | +219% | +546% |
| LST Beat The Market By: | 102% |
Performance vs. S&P500, 2020
- Read the full details of the Beat the Market Growth Stocks System with 8 years of backtested results.
The Criteria & Explanation of Logic
- Free Cash Flow – Healthy Companies Have Cash
- EPS Growth – Good Companies Grow Earnings
- Greenblatt Return on Capital – Good Companies Make Great Use of Assets
- 1-Year Return vs. the S&P500 – Great Companies Demonstrate They Can Beat the Market
- EPS Growth Now Greater Than 20% – A Surge in Earnings
- Previous Year EPS Greater Than Zero – They Made a Profit
- Demonstrating Growth Across the Board vs. Industry Competitors
- Greenblatt Earnings Yield
How to Beat the Stock Market With Stock Rover

I love Stock Rover so much that I spent 2 years creating a growth stock investing strategy that has outperformed the S&P 500 by 102% over the last eight years. I used Stock Rover's excellent backtesting, screening, and historical database to achieve this.
This Liberated Stock Trader Beat the Market Strategy (LST BTM) is built exclusively for Stock Rover Premium Plus subscribers.
Learn more about the LST Beat the Market Growth Stocks System
8. Buy the Stocks Warren Buffett Buys
On your path to beating the market, you could skip much of the stock screening or strategy development and buy the stocks that Warren Buffett buys. This would be a simple strategy to emulate the great investor and seek outperforming returns.
Here is a list of the companies Warren Buffett, specifically Berkshire Hathaway, owns.
| Ticker | Company | Stake |
| KHC | Kraft Heinz Co | 26.70% |
| DVA | Davita Inc | 24.10% |
| AXP | American Express Company | 18.30% |
| LSXMK | Liberty Sirius XM Group Series C | 15.20% |
| LSXMA | Liberty Sirius XM Group Series A | 14.40% |
| MCO | Moody’s Corporation | 13.00% |
| DAL | Delta Air Lines, Inc. | 11.00% |
| VRSN | Verisign, Inc. | 10.90% |
| AXTA | Axalta Coating Systems Ltd | 10.40% |
| BAC | Bank of America Corp | 10.20% |
| LUV | Southwest Airlines Co | 10.00% |
| AAL | American Airlines Group Inc | 9.80% |
| LBTYA | Liberty Global PLC Class A | 9.70% |
| KO. | Coca-Cola Co | 9.40% |
| WFC | Wells Fargo & Co | 9.30% |
| BK. | Bank of New York Mellon Corp | 8.60% |
| UAL | United Airlines Holdings Inc | 8.50% |
| USB | US Bancorp | 8.40% |
| STOR | Store Capital Corp | 8.10% |
| AAPL | Apple Inc. | 5.50% |
| LILA | Liberty Latin America Ltd Class A | 5.40% |
| GS | Goldman Sachs Group Inc | 5.10% |
| GM. | General Motors Company | 5.10% |
| STNE | StoneCo Ltd | 4.80% |
As the table above describes, you could seek to build a portfolio with the same size stakeholding as a percentage of your capital. Don’t forget that Berkshire Hathaway is regularly selling investments and buying others, so keep checking in on the Annual Reports and Buffett’s letters to investors.
9. Try the MOSES ETF Investing System
Whether you actively invest in the stock market or passively invest through mutual funds or exchange-traded funds, you need to reduce any losses you incur over the years of your investment.
The heart of the MOSES ETF Investing System is avoiding or minimizing the impact of major stock market crashes. The Moses strategy has three core indicators; you can use the best approach to eliminate most losses and compound your investments to beat the market.
Market Outperforming Stock ETF System
MOSES will alert you before the next crash happens, or at least before the significant downmove begins. It will also show you when the bear market is over.
- Market – The strategy is designed to be used on entire market indices
- Outperforming – The Moses strategies beat the majority of the USA & European Stock Markets
- Stock – Moses is designed to work on large, liquid stock market indices.
- ETF – Using Moses on broad market ETFs to trade an entire index is the ideal strategy.
- Strategies – 3 Strategies You Can Choose to Improve Your Decision-Making
Beat The Market, Avoid Crashes & Lower Your Risks
Nobody wants to see their hard-earned money disappear in a stock market crash.
Over the past century, the US stock market has had 6 major crashes that have caused investors to lose trillions of dollars.

The MOSES Index ETF Investing Strategy will help you minimize the impact of major stock market crashes. MOSES will alert you before the next crash happens so you can protect your portfolio. You will also know when the bear market is over and the new rally begins so you can start investing again.
MOSES Helps You Secure & Grow Your Biggest Investments
★ 3 Index ETF Strategies ★
★ Outperforms the NASDAQ 100, S&P500 & Russell 3000 ★
★ Beats the DAX, CAC40 & EURO STOXX Indices ★
★ Buy & Sell Signals Generated ★
MOSES Helps You Sleep Better At Night Knowing You Are Prepared For Future Disasters
MOSES Performance 1997 to 2025
Here are the exact results of the three MOSES strategies. The strategy started in 1997 to enable the system to act on three major stock market crashes: 2000, 2008, and 2020. The Buy and Hold strategy is the profit from staying invested during the entire period and not avoiding the crashes. The Winning MOSES strategy is highlighted in Green.
| MOSES Strategy Performance | Start Date Jan 03, 1997 | End Date Apr 4, 2025 |
|---|---|---|
| Initial Investment $100K | $100,000 | |
| Duration (Years) | 28 | |
| Portfolio Value | ||
| MOSES vs. NASDAQ 100 | Apr 4, 2025 | Percent Gain |
| NASDAQ 100 – Buy and Hold | $ 2,217,819.00 | 2118% |
| MOSES Buy Bull – Sell Bear | $ 3,742,186.00 | 3642% |
| MOSES Buy Bull – Sell Catastrophe | $ 2,625,555.00 | 2526% |
| MOSES Buy Recovery – Sell Catastrophe | $ 2,950,909.00 | 2851% |
| MOSES vs. S&P 500 | Apr 4, 2025 | Percent Gain |
| S&P 500 – Buy and Hold | $ 731,608.00 | 632% |
| MOSES Buy Bull – Sell Bear | $ 545,315.00 | 445% |
| MOSES Buy Bull – Sell Catastrophe | $ 667,647.00 | 568% |
| MOSES Buy Recovery – Sell Catastrophe | $ 787,748.00 | 688% |
| MOSES vs. Russell 3000 | Apr 4, 2025 | Percent Gain |
| Russell 3000 – Buy and Hold | $ 739,557.00 | 640% |
| MOSES Buy Bull – Sell Bear | $ 592,025.00 | 492% |
| MOSES Buy Bull – Sell Catastrophe | $ 715,577.00 | 616% |
| MOSES Buy Recovery – Sell Catastrophe | $ 822,097.00 | 722% |
| MOSES vs. NASDAQ Composite | Apr 4, 2025 | Percent Gain |
| NASDAQ Composite – Buy and Hold | $ 1,299,322.00 | 1199% |
| MOSES Buy Bull – Sell Bear | $ 1,568,175.00 | 1468% |
| MOSES Buy Bull – Sell Catastrophe | $ 1,306,720.00 | 1207% |
| MOSES Buy Recovery – Sell Catastrophe | $ 1,349,838.00 | 1250% |
| MOSES vs. CAC 40 France | Apr 4, 2025 | Percent Gain |
| CAC 40 – Buy and Hold | $ 333,524.00 | 234% |
| MOSES Buy Bull – Sell Bear | $ 247,699.00 | 148% |
| MOSES Buy Bull – Sell Catastrophe | $ 307,601.00 | 208% |
| MOSES Buy Recovery – Sell Catastrophe | $ 371,788.00 | 272% |
| MOSES vs. DAX Germany | Apr 4, 2025 | Percent Gain |
| DAX – Buy and Hold | $ 763,771.00 | 664% |
| MOSES Buy Bull – Sell Bear | $ 523,548.00 | 424% |
| MOSES Buy Bull – Sell Catastrophe | $ 797,344.00 | 697% |
| MOSES Buy Recovery – Sell Catastrophe | $ 1,195,465.00 | 1095% |
| MOSES vs. EURO STOXX 50 | Apr 4, 2025 | Percent Gain |
| EURO STOXX 50 – Buy and Hold | $ 279,258.00 | 179% |
| MOSES Buy Bull – Sell Bear | $ 218,992.00 | 119% |
| MOSES Buy Bull – Sell Catastrophe | $ 360,245.00 | 260% |
| MOSES Buy Recovery – Sell Catastrophe | $ 511,607.00 | 412% |
| ‘Annualized Compound Return (ACR) |
10. Find High-Growth Dividend Stocks
Do you want to find companies that are continually raising their dividends? It is a wise move, as businesses with significant dividend growth usually grow sales and market dominance.
What if you could find companies that have experienced dividend growth over the last ten years and are on sale by the stock market at bargain-basement prices? This is called Dividend Growth + High Margin of Safety.
10-Year Dividend Growth Strategy
The Dividend Kings or Dividend Aristocrats strategy essentially means investing in companies with a long history of continually paying and increasing dividends.
You will need a stock screener with a significantly sizeable historical database (at least ten years) of earnings and dividend payments, such as Stock Rover.
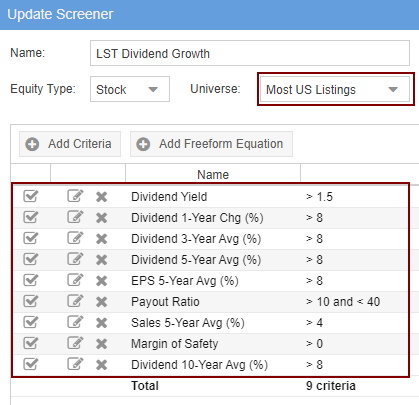
The criteria shown here are the calculations for ten years.
Dividend Growth Criteria Explanation:
- Dividend Yield > 1.5%. This is a simple filter designed to ensure only companies paying a dividend above 1.5% are listed—anything less than 1.5% will not even payout in line with inflation.
- Dividend 1 Year Change > 8%. We want only companies with increased dividends of over 8% in the last fiscal year.
- Dividend 3-Year Change > 8%. Next, we filter down to companies with at least an average increase of 8% over the last three years.
- Dividend 5-Year Change > 8%. Again, only those companies increased dividends by more than 8% over the last five years.
- Dividend 10 Year Change > 8%. You get the idea. :)
- Payout Ratio >10 < 40. The payout ratio ensures the company makes enough profits to continue paying the dividends and sustain the increases. You can reduce the “<10” to see more stocks in the scan. We do not want companies paying more than 40% of their profits in dividends; they must retain cash flow for future growth and capital investments.
- Sales 5-Year Average (%) > 4%. This is designed to ensure that the company increases sales, at least on average, to pay for the above dividend growth.
- The margin of Safety > 0. (Exclusive to Stock Rover) The most important criterion is the Margin of Safety, using Warren Buffett’s calculation of the forward discounted cash flow (see our article on Intrinsic Value). Essentially, the higher the margin of safety, the more of a discount you are buying a stock for.
These criteria would typically return a list of only 5% of the NYSE or NASDAQ listed stocks.
- Learn all the details and methodology behind the high dividend growth strategy.
- Our 7 Best Value & Dividend Investing Strategies & Scans
11. Implement the Bill Gates Portfolio
Bill Gates’s portfolio includes some very interesting stocks, including Microsoft, Apple, and his great friend Warren Buffett’s Berkshire Hathaway stocks.
But how is Mr. Gates’ portfolio performing? According to Stock Rover’s excellent portfolio backtesting and performance comparison charting, Bill has managed to beat the S&P 500 by 54% since 2007, which is impressive.
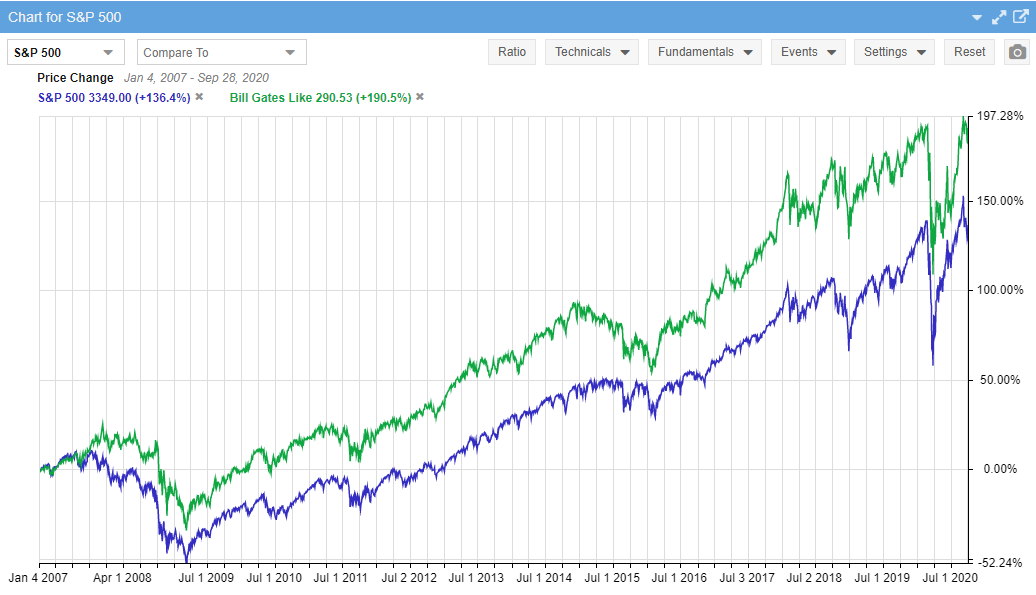
We do not know the origins of Bill Gates’s investing methodology, but we can be sure Warren Buffett and his history have influenced him as a technology mogul.
The Bill Gates Stock Portfolio
| Ticker | Company | Value Score | Growth Score | Price | 5Y Return vs. S&P 500 |
| AMZN | Amazon.com | 52 | 99 | $3,148.53 | 409.20% |
| BABA | Alibaba Group Holding | 63 | 98 | $275.15 | 274.40% |
| AAPL | Apple | 76 | 93 | $113.35 | 236.40% |
| CAT | Caterpillar | 74 | 69 | $149.71 | 77.40% |
| WM | Waste Management | 68 | 86 | $114.36 | 62.10% |
| CCI | Crown Castle Intl | 54 | 95 | $162.38 | 56.60% |
| WMT | Walmart | 89 | 87 | $137.37 | 51.10% |
| CNI | Canadian National Railway | 70 | 81 | $106.97 | 17.40% |
| UPS | United Parcel Service | 67 | 91 | $171.31 | 11.80% |
| ECL | Ecolab | 79 | 80 | $200.18 | 0.10% |
| FDX | FedEx | 73 | 92 | $257.49 | -2.80% |
| TWTR | 53 | 71 | $43.71 | -18.40% | |
| BRK.B | Berkshire Hathaway | 81 | 83 | $215.19 | -25.40% |
| ARCO | Arcos Dorados Holdings | 43 | 53 | $4.28 | -36.90% |
| Cash | Cash | – | – | $1.00 | -91.60% |
| KOF | Coca-Cola Femsa | 84 | 80 | $40.77 | -121.90% |
| LBTYK | Liberty Global | 78 | 58 | $20.78 | -139.10% |
| LBTYA | Liberty Global | 78 | 53 | $21.17 | -141.90% |
| LILA | Liberty Latin America | 69 | 72 | $8.35 | -166.50% |
| LILAK | Liberty Latin America | 69 | 69 | $8.30 | -166.60% |
| TV | Grupo Televisa | 88 | 66 | $6.20 | -168.10% |
12. Create Your Own System
Finally, if you love the chase and are willing to put the work in to develop your unique way of beating the market, then there are two things you must do.
Take a Serious Investing Course.
Many companies offer trading or investing courses to help you become a successful investor. We also provide a training course; in fact, this training course was the reason I established the Liberated Stock Trader business. To help you become a free-thinking investor who does not listen to others and forges your own path.
You want to be a successful stock investor but don't know where to start.
Learning stock market investing on your own can be overwhelming. There's so much information out there, and it's hard to know what's true and what's not.

Liberated Stock Trader Pro Investing Course
Our pro investing classes are the perfect way to learn stock investing. You will learn everything you need to know about financial analysis, charts, stock screening, and portfolio building so you can start building wealth today.
★ 16 Hours of Video Lessons + eBook ★
★ Complete Financial Analysis Lessons ★
★ 6 Proven Investing Strategies ★
★ Professional Grade Stock Chart Analysis Classes ★
Create Your Own Unique Market-Beating System
After you have built your own experience and knowledge, you will be ready to test your theories and hypotheses. There is, in effect, only one way to achieve this goal.
You need to learn how to backtest your ideas to establish if they provide a unique edge in the market that works repeatedly. I have done this with the Liberated Stock Trader Beat the Market System.
You can also learn to backtest with the best software around.
Backtest Your Strategy
TrendSpider offers a no-coding system for backtesting, enabling auto-trading through webhooks on alerts. This allows for seamless point-and-click backtesting of charts and indicators.
With TrendSpider, even selecting a one-minute timeframe for intraday backtesting is possible. The platform further provides fully automated AI-driven trendlines, Fibonacci tools, and multi-time frame analysis for stocks, forex, crypto, and futures. TrendSpider is an outstanding technical analysis platform with a robust backtesting engine.
TradingView 4.8/5⭐ : The Best Trading Platform I’ve Tested in 20+ Years
With lightning-fast charts, powerful pattern recognition, smart screening, backtesting, and a global community of 20+ million traders — it’s a powerful edge in today’s markets.

If you want one platform that gives you an edge, this is it.
Final Thoughts
Stock investing strategies designed to beat the market are sometimes successful, but not always. If there were a single strategy that always beat the market, the free market would cease to exist. That is why our selection of the best strategies is helpful. There is no single way to always outperform the S&P 500, but we can certainly try.
I hope this exhaustive roundup of the best stock market-beating systems was useful to you.
Disclaimer
As with any stock market investing system, nothing is guaranteed to work in the future as it did in the past. The more institutions that utilize a system, the more ineffective it becomes. So this beat the market screener, and LiberatedStockTrader.com accepts no liability for your use of this work. Liberated Stock Trader does not recommend the purchase of specific stocks and accepts no liability for any losses incurred. By using this or any other published article for investing purposes, you agree to our disclaimer.
Great post to help understand all the different formulas and stratergies that we can utilise to invest in the stock market. It is surely going to help in growing portfolios and beating the market.
Yes, Bini
Hello Barry, very nice article and I am a new lover of Stock Rover. I have one question. Is No.4 bought on 1/2 and sold on 12/31 just the same way as no. 2?