
If I could travel back in time to teach my younger slimmer self how to trade stocks, this is the advice I’d give.
I would say, Barry, don’t begin by searching for the perfect strategy. Do not load a chart with ten indicators, subscribe to expensive trading software, or spend weeks memorizing candlestick patterns. Those things can all have a place later, but they are not where I would start.
I am Barry, a certified financial technician, and if I were starting again today, I would build my knowledge in a specific order. I would begin with price, add volume to give that price movement context, learn how trends, support, and resistance develop, and then focus heavily on risk. Only after those foundations were in place would I build a trading strategy, backtest it, and finally choose the software needed to support the process.
That order matters. Each step gives me something I need to understand the next one.
Price → Volume → Trend → Support & Resistance → Risk → One Strategy → Backtesting → Software.
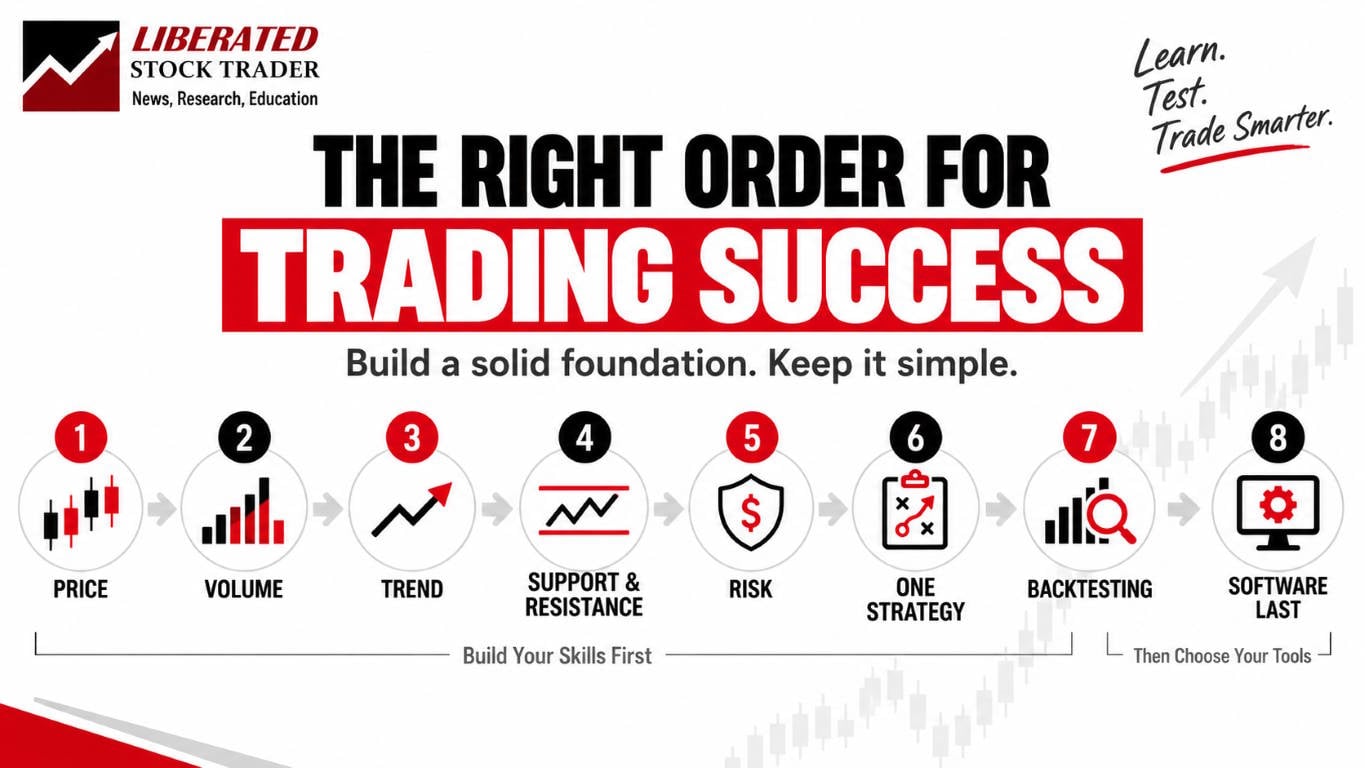
The important idea running through this entire process is simple: I want to understand what I am doing before I add another layer of complexity.
1. Start by Learning What Price Is Telling You
If I had to choose only one thing for a beginner to study first, it would be price.
A stock chart is ultimately a visual record of transactions between buyers and sellers. Every indicator I might eventually add is either calculated from price or is being used to provide additional context around it. If I do not understand what the underlying price is doing, adding more indicators will not solve that problem.
I would therefore begin with a clean candlestick chart.
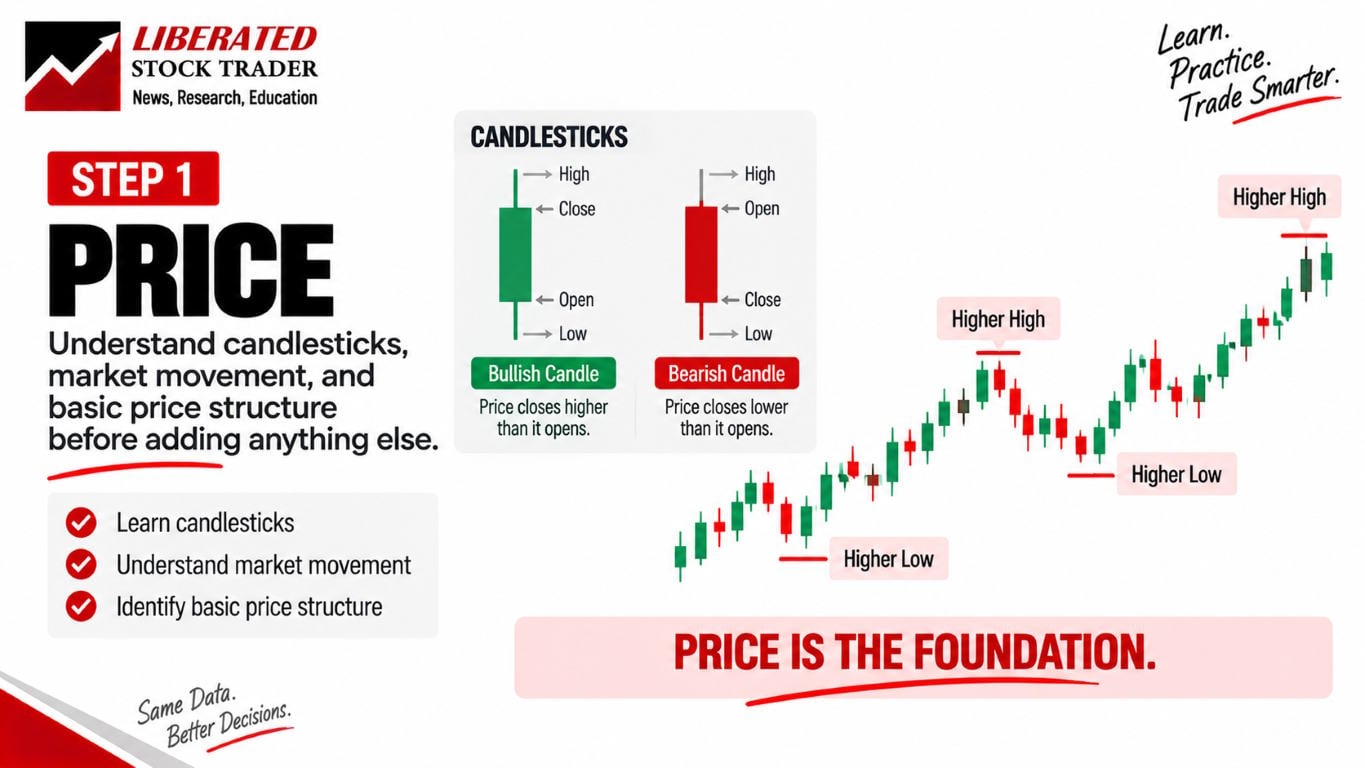
A candlestick looks complicated at first, but it is simply summarizing four pieces of information over a particular period: where the price opened, the highest price reached, the lowest price reached, and where it closed.
A green candle tells me that the closing price was above the opening price. A red candle tells me the opposite. The wick tells me where the price traveled during that period before settling at the close.
I would make sure I could look at those candles and understand what happened without needing software to interpret them for me.
My full stock-chart tutorial goes deeper into chart construction, timeframes, trendlines, and indicators if you want to continue from here.
Read my guide to understanding stock charts
I Would Learn Candles, Not Memorize Hundreds of Candle Names
This distinction is important. Beginners can easily become obsessed with names such as Doji, Hammer, Morning Star, Shooting Star, Engulfing Pattern, Hanging Man, and dozens of others.
Those patterns can be useful, and I have tested many of them extensively. But I would not begin by trying to memorize a dictionary of candlestick formations.
I would ask a simpler question:
What is this candle actually showing me, and where did it occur?
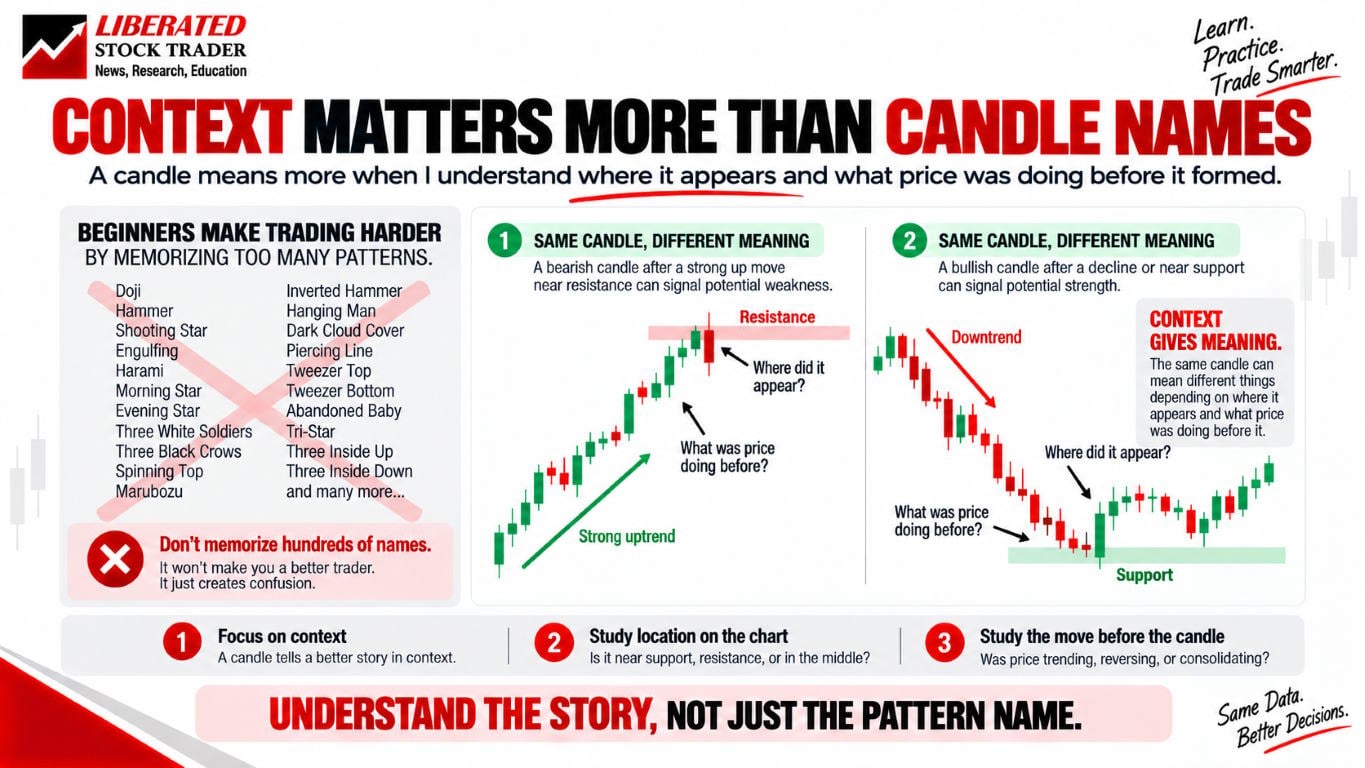
A bearish-looking candle appearing after a powerful rally into a major resistance area can mean something very different from a similar candle appearing after a long decline.
The candle itself is only part of the information.
I also want to know what price was doing before the candle appeared, where it appeared in the wider structure, and what happened afterward.
That is why context matters more than simply recognizing a shape.
If you want to explore the actual data behind commonly cited candle formations, I maintain a large library of tested patterns rather than relying only on traditional textbook claims.
Explore my candlestick-pattern research
Then I Would Watch Price Move
Once I understood individual candles, I would zoom out and simply watch what the chart was doing.
Sometimes price moves gradually. Candles remain relatively small and progress is slow.
Then something changes.
The candles become larger. Price starts covering more distance in less time. A stock that had barely moved suddenly begins accelerating.
That change in behavior tells me that something has changed in the balance between buyers and sellers.
The opposite is equally interesting.
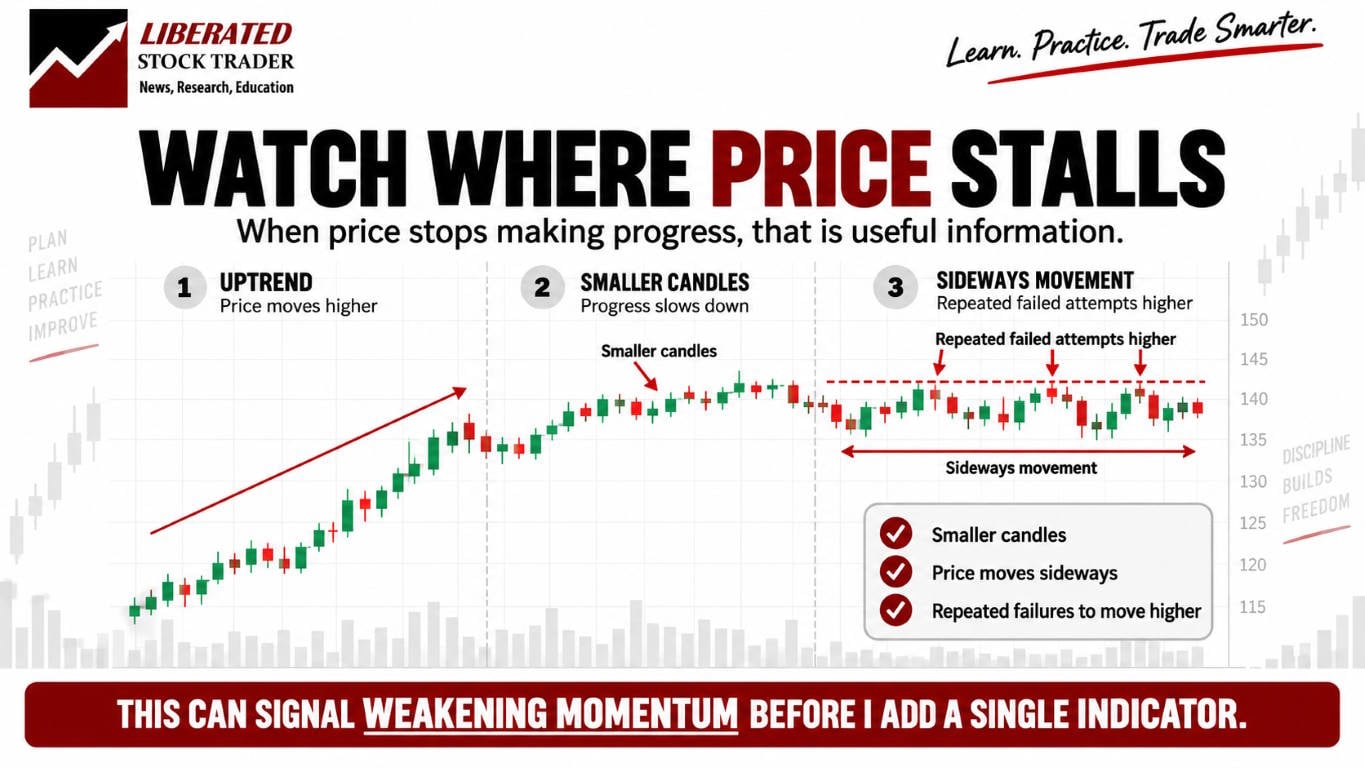
A stock may have been moving strongly upward, but then each advance becomes smaller. Candles contract. Price starts moving sideways. Several attempts to make another high fail.
Before I add a momentum indicator, oscillator, or moving average, price has already given me valuable information.
I am learning to recognize when movement is strengthening, weakening, or simply going nowhere.
Price Structure Gives Me the Bigger Picture
From there I would begin identifying basic market structure.
If price repeatedly makes a new high, pulls back without breaking the previous significant low, and then pushes to another high, I am looking at the basic structure of an uptrend.
Those are higher highs and higher lows.
In a downtrend, the opposite occurs. Recoveries fail below previous highs, and the subsequent decline creates another new low. That gives me lower highs and lower lows.
If neither side is making meaningful progress, price may simply be trading sideways.
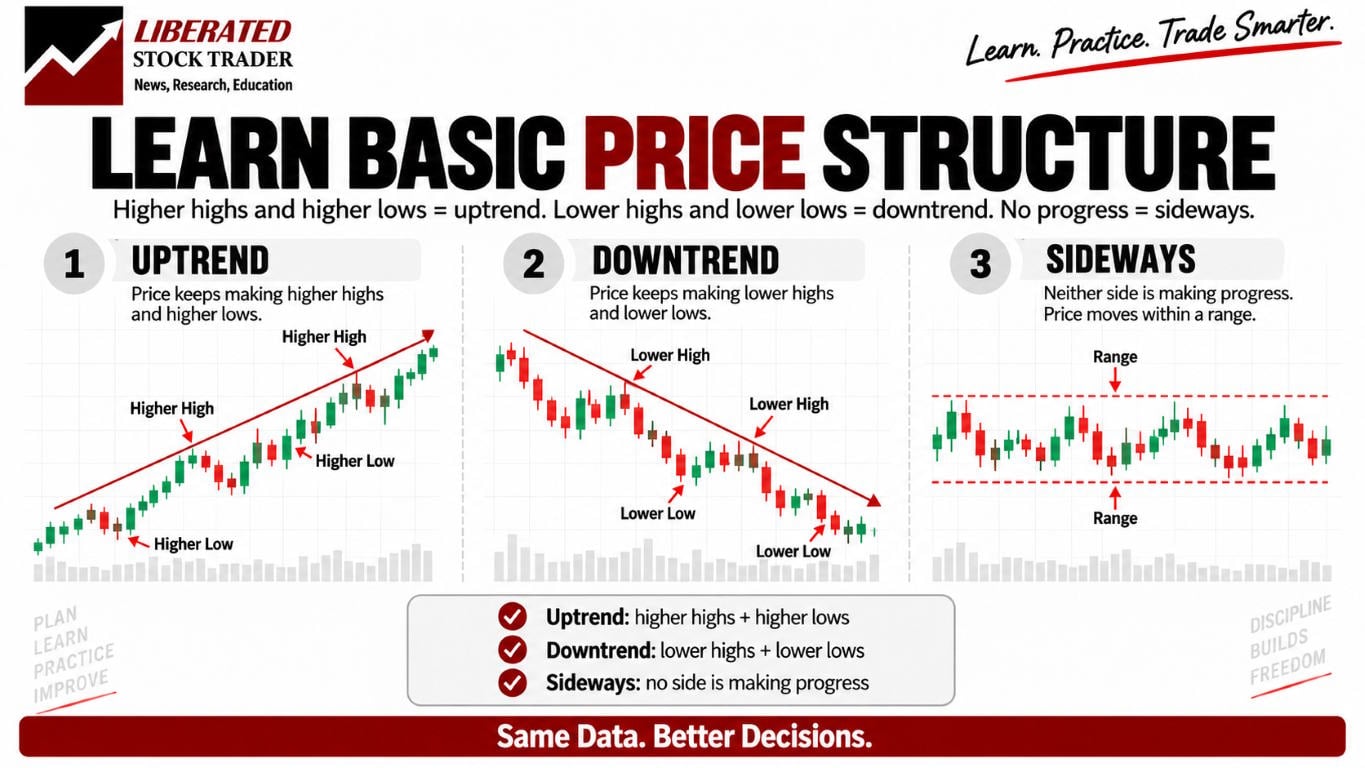
This is one of the most important skills I can build because it allows me to describe the market without immediately reaching for an indicator.
I can look at the chart and say, “This is trending higher,” “This trend is weakening,” or “There is currently no clear trend.”
That observation comes directly from price.
I Would Pay Particular Attention to Breakouts
Breakouts are also worth studying early.
Imagine a stock repeatedly reaching approximately the same resistance area and failing to move higher. Eventually, price pushes through that area.
The instinct is to focus entirely on the moment of the breakout.
I would focus just as much on what happens afterward.
Does price accelerate away from the old resistance area? Does it break out and then stall? Does it move above resistance briefly and immediately collapse back below it?
Those outcomes tell very different stories.
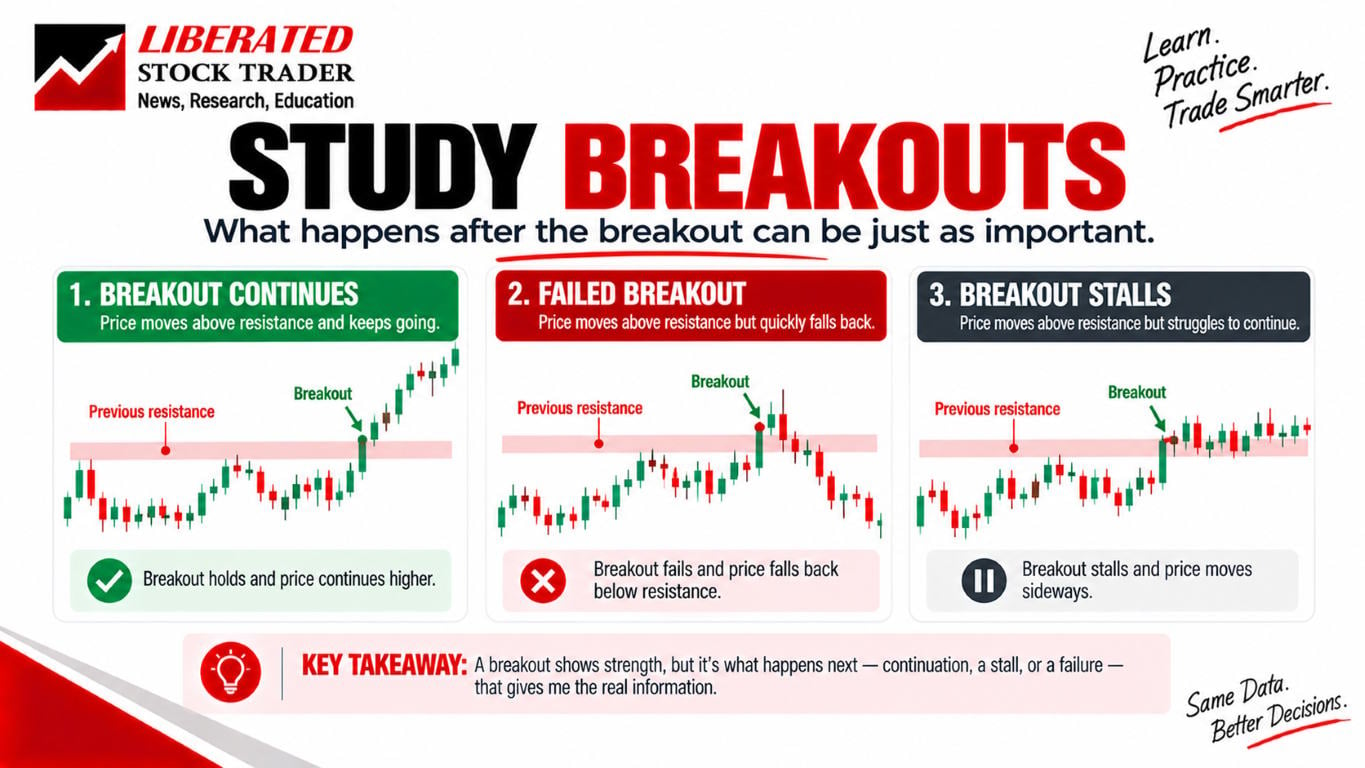
A successful breakout is not simply a candle crossing a line. I want to observe how price behaves once it has crossed that line.
A failed breakout is particularly interesting because price has temporarily moved beyond an area that attracted traders, only to reverse.
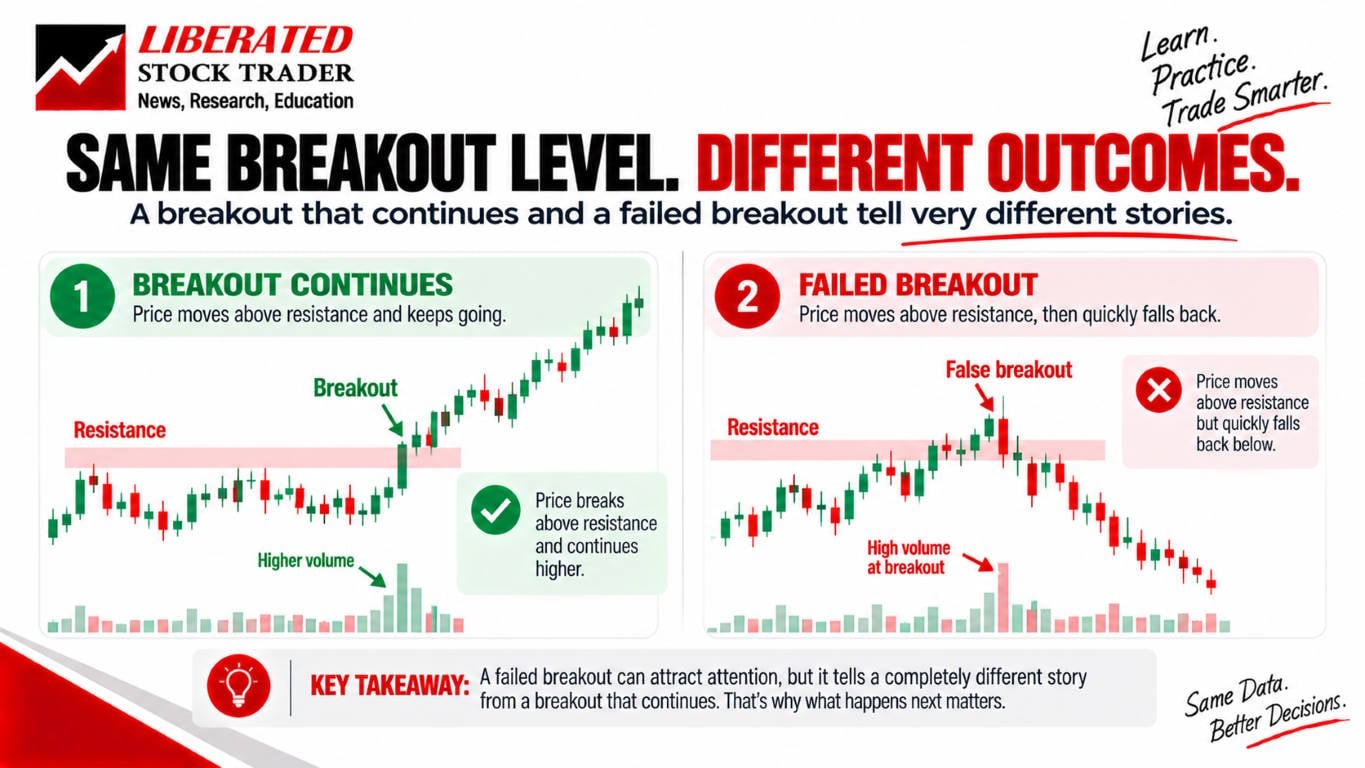
This is the kind of price behavior I would study repeatedly.
I am not trying to predict every move. I am training myself to look at a chart and describe what is actually happening.
That is the foundation.
Jump To Step 1 Lesson: How to Read Price Action: A Beginner’s Guide to Trading
2. Add Volume to Understand the Participation Behind Price
Once I had become comfortable reading price, I would add volume.
Price tells me what happened.
Volume gives me another piece of information: how much market participation accompanied the move.
Trading volume measures how many shares changed hands during a particular period. A large volume bar means considerably more activity occurred than during a low-volume period.
But I would not treat high volume as automatically bullish or low volume as automatically bearish.
The useful information comes from comparing volume with price.
Read my complete guide to stock volume
Consider two almost identical breakouts.
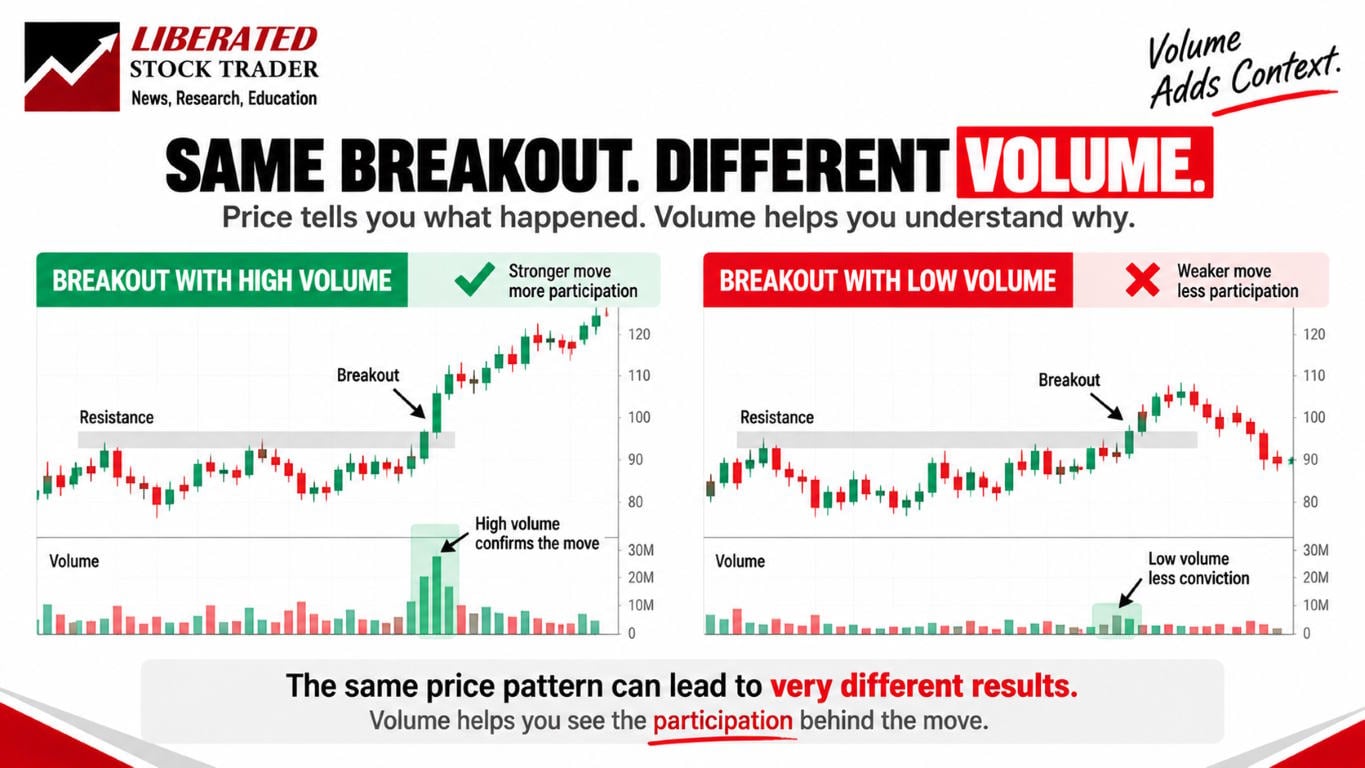
In both cases, price moves through resistance.
In the first example, volume expands sharply as the breakout occurs. In the second, the move occurs with relatively little participation.
Neither example guarantees what happens next, but I now have more information.
The first breakout tells me that substantially more trading activity accompanied the move. The second tells me that participation was weaker.
This is why I think of volume as context, not a standalone prediction system.
As a beginner, I would simply observe how volume behaves when price accelerates, breaks out, reverses, or begins to stall. Over time, I start seeing the relationship between the movement itself and the level of participation behind it.
I would not rush to add OBV, VWAP, Volume Profile, Money Flow, and five other volume indicators at once.
Basic volume bars are enough to start learning.
3. Learn to Recognize Trend Before Relying on Trend Indicators
After price and volume, I would focus on trend.
The first question is not complicated:
Is price generally moving higher, lower, or sideways?
I can already answer much of that using the price structure I learned in Step 1.
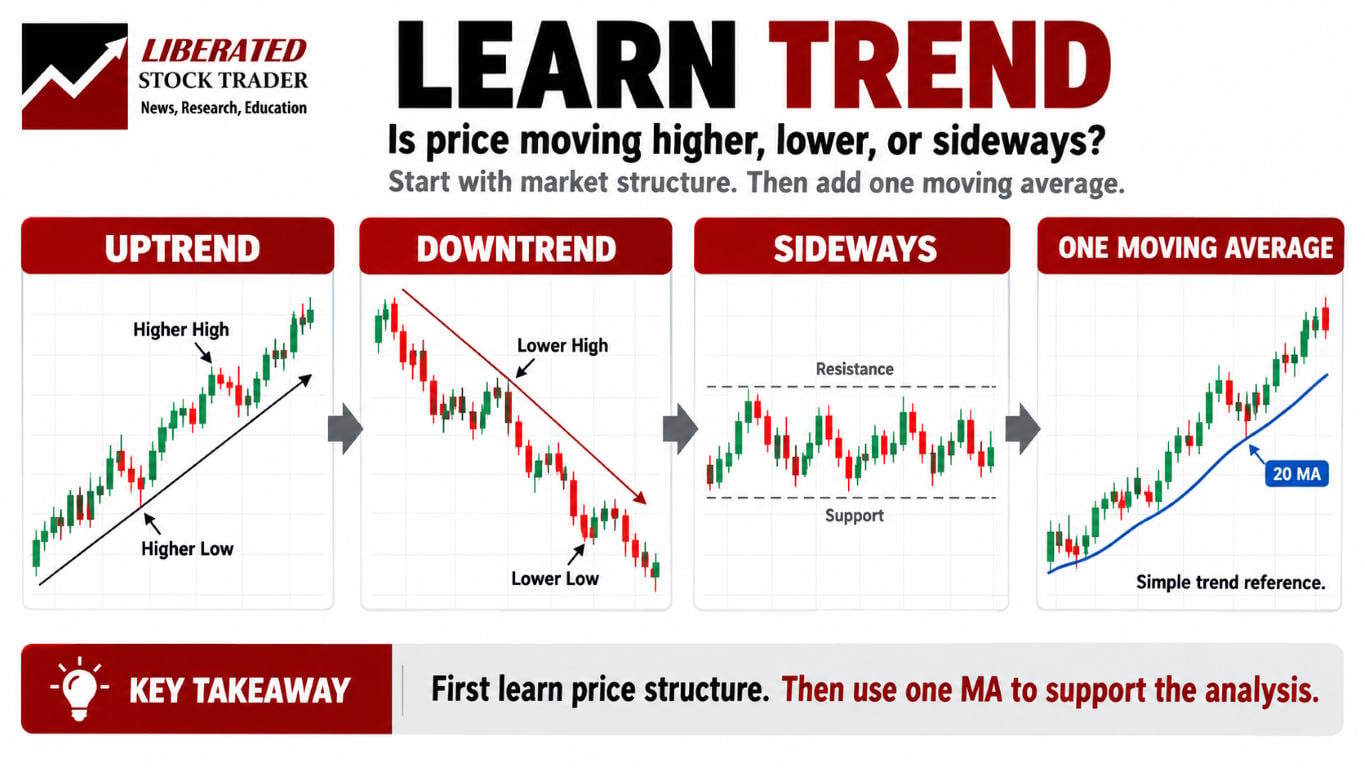
An uptrend contains a sequence of higher highs and higher lows. A downtrend produces lower highs and lower lows. A sideways market does neither consistently.
See my tested moving-average research
This matters because different market environments behave differently.
A trend-following strategy may perform well while the market is moving consistently upward and perform badly once that market begins moving sideways. A breakout strategy may repeatedly get trapped if price is oscillating inside a range.
Recognizing the environment comes before choosing the strategy.
Only after I could see the trend directly from the chart would I consider adding something such as a moving average.
A moving average can be useful because it smooths price and makes the broader direction easier to see. But importantly, it is summarizing price that has already occurred.
I would therefore use a moving average as a reference rather than allowing it to replace my understanding of the chart.
The sequence matters again.
First I learn the trend.
Then I use indicators to help visualize or measure something I already understand.
4. Treat Support and Resistance as Areas, Not Magical Lines
Once I understood basic trend structure, I would begin studying support and resistance.
Support is an area where declining prices have previously attracted enough demand to stop or reverse the fall. Resistance is an area where rising prices have encountered enough selling pressure to slow or reverse the advance.
These areas give the chart structure.
But I would avoid one common beginner mistake: believing support and resistance are precise prices that the market must obey.
They are not.
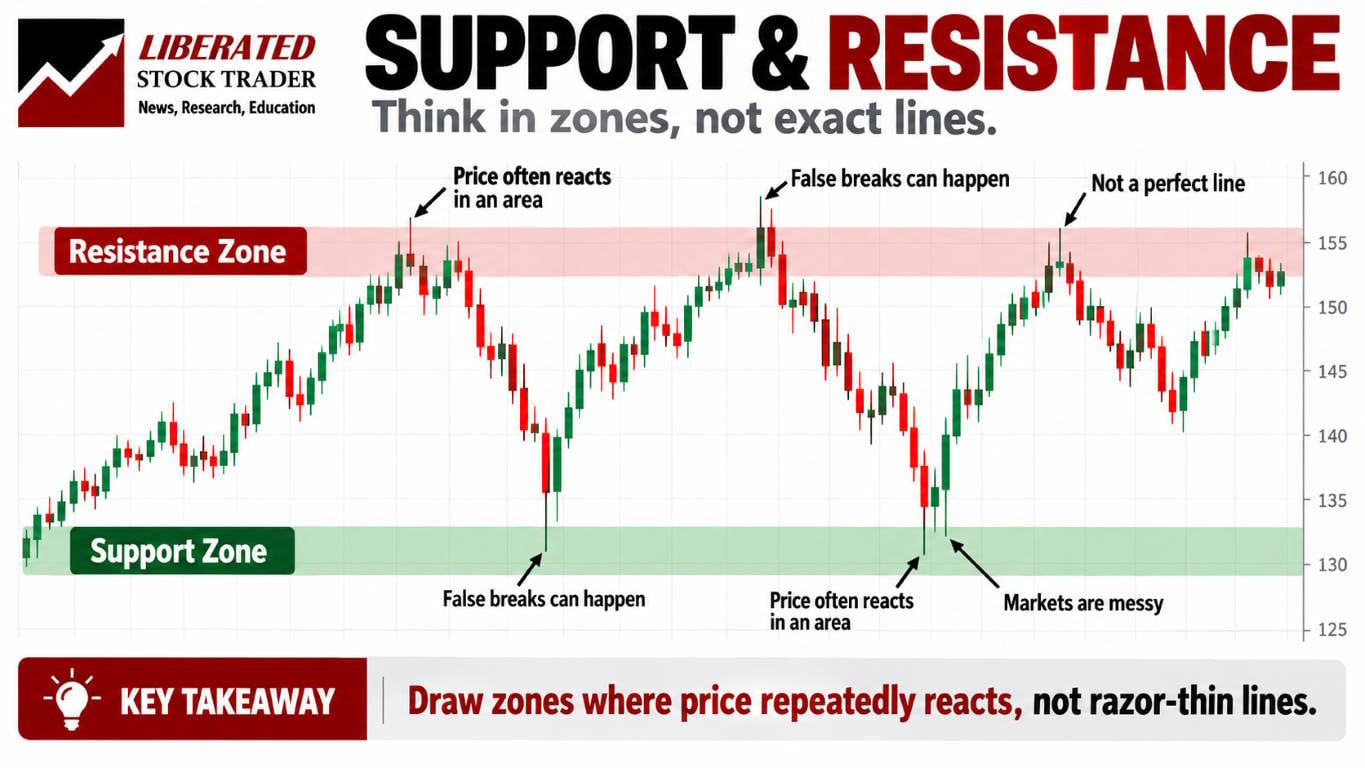
If I identify resistance around $100, price might reverse at $99.40.
It might briefly trade to $100.80.
It might consolidate around $100 for three days.
Or it might break through and never look back.
That is why I prefer to think in zones rather than razor-thin lines.
I am looking for areas where buyers or sellers have repeatedly become active.
The more often price reacts around an area, the more interesting that area becomes.
Support and resistance also help me answer a much more useful trading question:
What would prove my idea wrong?
Suppose I expect a particular support zone to hold. I enter a trade because the price begins recovering from that area.
If price subsequently breaks decisively below that support zone, the original reason for my trade may no longer be valid.
That gives me an invalidation point.
This becomes extremely important in the next step.
Learn more about price action, support and resistance
5. Learn Risk Before Becoming Obsessed With Profit
This is probably the biggest change I would make if I were learning trading again.
Beginners naturally want to know:
How much money can I make?
I would train myself to ask something else first:
How much am I prepared to lose if I am wrong?

That question changes the entire structure of a trade.
Before entering, I want to know where I am buying, where the setup becomes invalid, and where I might take profits if the trade works.
Those three levels give me an entry, stop, and target.
I can now measure the risk before deciding whether the trade is worth taking.
A Simple Position-Sizing Example
Suppose I have a $10,000 trading account and decide that the maximum planned loss on a particular trade should be $100.
I identify an entry at $100 and a stop at $95.
That means I am risking $5 per share.
If my maximum planned loss is $100, I can divide $100 by $5 and arrive at a position size of 20 shares.
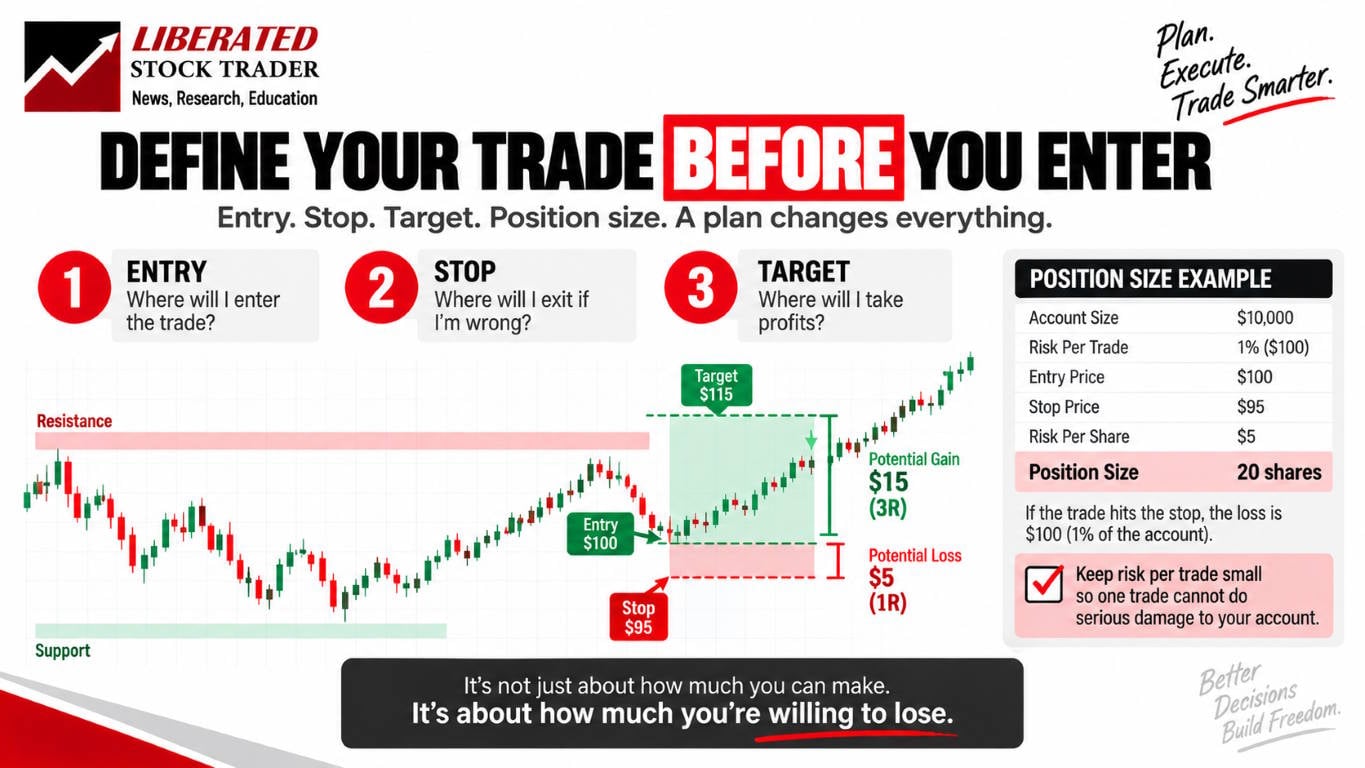
The position size was not chosen because I “felt confident” about the trade.
It came directly from the amount I was prepared to lose and the distance between my entry and stop.
The core relationship is:
Position Size = Maximum Dollar Risk ÷ Risk Per Share
This is one of the most practical lessons a new trader can learn. Even a good trading idea can become a serious problem if the position is too large.
My Position Size Calculator lets you work through the same relationship with account size, entry, stop, target, fees, and risk per trade.
Use the Position Size Calculator
Position Size Calculator
Calculate how many shares or units to buy based on account size, risk per trade, entry price, and stop loss distance.
Inputs
Results
Formula Used
I would also learn the relationship between win rate and reward-to-risk because neither number tells the whole story by itself.
A strategy that wins only 40% of the time can still work if the winners are sufficiently larger than the losers. A strategy with a very high win rate can still lose money if occasional losses are enormous.
Risk Reward Calculator
Calculate trade risk, reward, risk-reward ratio, break-even win rate, expectancy, and position sizing to plan better trades and improve long-term profitability.
Inputs
Results
Formula Used
Walkthrough: Web’s Best Risk-Reward/Win Rate Calculator for Trade Analysis
Learn how win rate and risk/reward work together
The objective is not to avoid losing trades.
That is impossible.
The objective is to prevent an ordinary losing trade from becoming financially destructive.
6. Build One Simple Strategy You Can Actually Explain
Only after learning price, volume, trend, support and resistance, and risk would I begin building a strategy.
And I would deliberately keep it simple.
One of the easiest ways for a new trader to become confused is to collect strategies.
One day it is candlestick reversals. The next it is moving-average crossovers. Then breakouts, mean reversion, AI signals, Fibonacci levels, momentum, options flow, and whatever happened to appear in the latest video.
Soon there is no coherent process.
I would choose one idea and turn it into explicit rules.
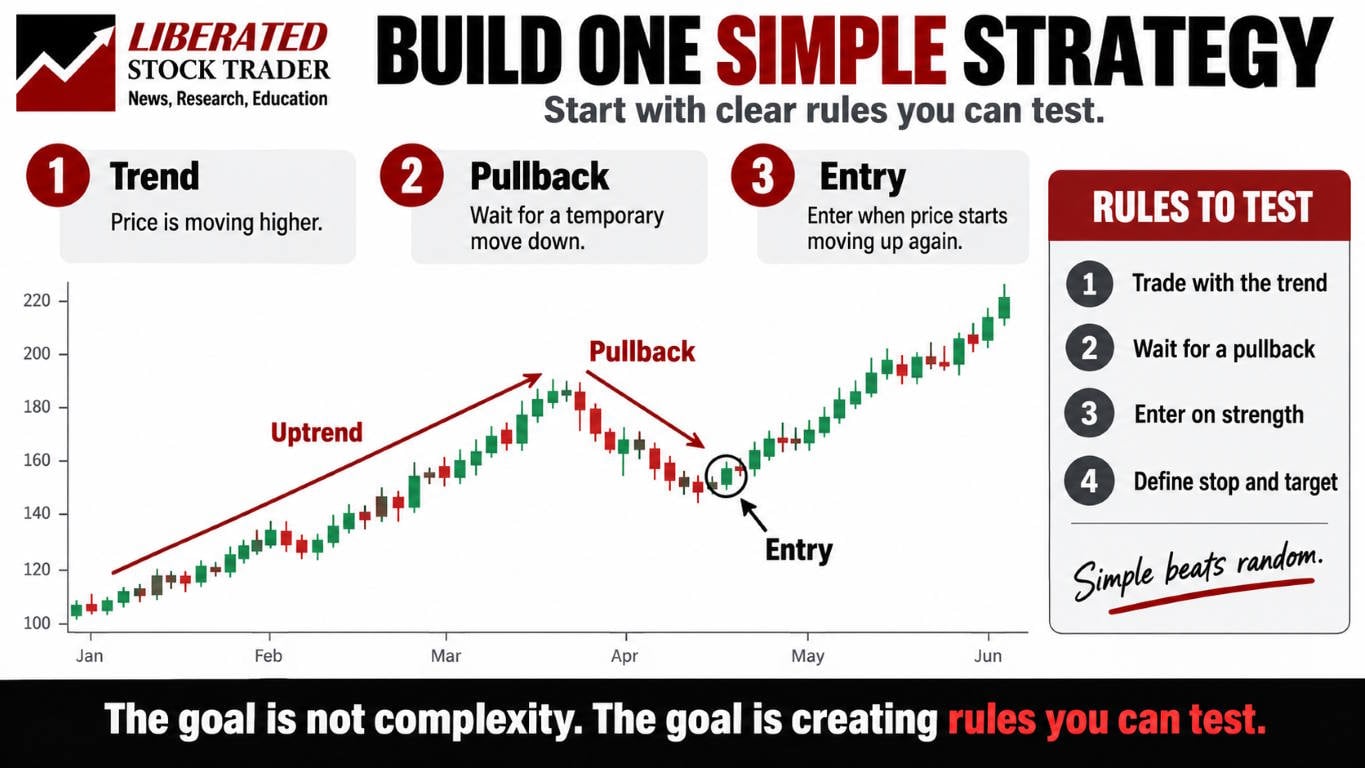
For example, imagine I decide to investigate a simple trend-pullback strategy.
I might require the broader price structure to be trending upward. Instead of chasing a stock after it has already accelerated, I wait for a pullback. I then define exactly what must happen before I enter, where the trade becomes invalid, and how I will exit.
The important part is not whether that specific strategy turns out to be profitable.
The important part is that I have converted an idea into something measurable.
“Buy when the chart looks good” cannot be meaningfully tested.
“Enter when conditions A, B, and C occur; exit when X or Y occurs” can.
That is the transition from trading ideas to trading rules.
I want every strategy to answer the same basic questions before money is involved: what qualifies as a setup, what triggers the entry, where the risk is controlled, and how the position will eventually be closed.
The fewer decisions I have to invent while a trade is already moving, the less opportunity I give myself to change the rules emotionally.
7. Backtest the Rules Before Trusting Them
Once I have a clearly defined strategy, I finally have something worth testing.
This is where backtesting becomes useful.
Backtesting applies those rules to historical data so that I can examine how the strategy would have behaved across a much larger sample than the few attractive charts that originally caught my attention.

This is important because almost any trading idea can be made to look convincing with a handful of carefully chosen examples.
Three profitable trades prove almost nothing.
I want to know what happens over dozens, hundreds, or, where appropriate, thousands of historical setups.
I would start with total return, but I would never stop there.
I want to know the win rate and how large the average winner was compared with the average loser. I want to know the maximum drawdown because a profitable strategy can still contain losing periods that are psychologically or financially unacceptable.
I also need to know how many trades were included. A 75% win rate based on eight trades tells me considerably less than a result based on hundreds of comparable observations.
Most importantly, I would look at different market environments.
Did the strategy work mainly during a powerful bull market?
What happened during declining markets?
What happened when volatility increased?
Did the results disappear when the market became sideways?
A strategy does not necessarily need to work in every environment. But I need to understand where it works and where it struggles.
Backtesting also has an important limitation.
It does not predict the future.
A beautiful historical equity curve is not a promise about what happens tomorrow. What backtesting can do is expose weaknesses before I put meaningful capital at risk.
That alone makes it valuable.
Read my complete guide to backtesting trading strategies
8. Choose Trading Software Only After You Know What You Need
Only now would I seriously think about buying trading software.
This is deliberately the final step.
A common mistake is to buy a sophisticated platform first and then allow its feature list to determine the trading process.
I would reverse that completely.

By this point, I should already know how I intend to trade.
If I am a long-term investor, my needs may revolve around screening, financial analysis, portfolio management, and valuation.
If I am a swing trader, charting, screening, alerts, and backtesting may matter more.
If I trade intraday, real-time data, execution, scanning, news, and broker integration may become critical.
I should also know which markets I intend to trade. A platform that is excellent for U.S. equities may not be the right choice if I need international stocks, forex, futures, crypto, or options.
Only after answering those questions can I decide whether I genuinely need advanced charting, automated pattern recognition, AI tools, fundamental research, real-time news, backtesting, trading automation, or some combination of them.
This is why I built the Smart Trading Tools Finder.
Rather than starting with a list of software and asking, “Which one has the most features?”, the Finder starts with the trader: how you trade, what markets you follow, what capabilities you need, and what you want to spend. It then narrows the available platforms around those requirements.
Find Your Dream Trading Tool
Find your perfect trading tool match based on budget, functionality, workflow, and trading style, in under 1 minute.
What do you primarily want to do?
Choose the option that best describes your main goal. Tools rated below 3/5 for that trading style are removed.
What do you most need the software for?
Select as many as you need. Tools rated below 3/5 for any selected requirement are removed.
Which markets do you need?
Select every market the software must support. Tools rated below 3/5 for any selected market are removed.
What is your monthly software budget?
Tools with a budget-fit rating below 3/5 are removed from the results.
Which advanced capabilities matter?
Select any advanced features that are important to your final choice. Tools rated below 3/5 for any selected capability are removed.
Our independent comparisons relevant to what you're looking for.
Try my Smart Trading Tools Finder
The best trading platform is not automatically the one with the largest feature list or highest monthly price.
It is the platform that provides the capabilities my process actually requires.
Process first. Tools second.
The Order Is More Important Than the Complexity
If I had to learn stock trading from scratch again, I would resist the temptation to make it sophisticated too quickly.
I would spend much more time learning to observe.
I would begin with a clean price chart and make sure I understood candles, movement, structure, acceleration, consolidation, breakouts, and failed breakouts. Then I would add volume to see how participation changes alongside price.
Once I understood those foundations, trend and support and resistance would make far more sense because I would understand where those concepts come from rather than seeing them as lines drawn by software.
Risk would come before strategy because a strategy is not particularly useful if I cannot survive its losing trades.
Then I would take one simple idea, convert it into rules, and test those rules against historical data.
Only after doing all of that would I pay for advanced software.
That sequence is the central lesson.
Learn first. Build the process second. Choose the tools last.
Trading becomes much easier to understand when every new concept has a reason for being there rather than simply being another feature on the chart.
And if you are at the very beginning, there is a simple exercise I would recommend today: open a chart, remove the indicators, and spend some time describing what price is actually doing.
Do not try to predict the next candle.
Just learn to read the story already on the chart.
Once you can do that, you have something solid to build on.
Move To Step 1: How to Read Price Action: A Beginner’s Guide to Trading

Thank you Barry for this beautiful article. I enjoy reading this. I appreciate your thoughts and ideas. The videos are very helpful to make them easy to understand to the viewers. Great job.
the best stock thing ever ,, i even took a stilo and start writing someowhere something ,, everything perfect and i appreciate it
Hi Fred, the process is above, just hover over the big image at the top and you will see hints and tips pop up. Most of it is free, yes.
thanks
Please am interested in learning stock trading, kindly walk me through the processes to get started. Is it all free learning?
I hope you won’t take this as too harsh but I think if you’re planning on trading then you’re likely to lose money. Most people should not be trading at all. You’re competing against people who know what they’re doing because they do it day in and day out for a job. You’re much safer to buy a global equities index fund instead.
Hi Barry, lots of good info here. IMO the best step a beginner can take is to just take the leap and get involved with real money. There’s only so much books and articles and coaches can teach you, real life has a funny way or imparting lessons fast
Stock trading is a risky investment and it is only wise to learn all the ropes before starting out to avoid making mistakes that might cause you your investment. Thanks for the step by step guide.
Hi Longinus, I have no idea of the background here, but it seems an insanely high amount of money for a training course. I would suggest you try our PRO training, and then decide if you need further training. 20 to 40K$ is too much.
PRO Training
Help me out please. I went to a 3 day free online trading workshop. At the end of that workshop they suggested us to sign up for 9 months intensive online trading course. The tuition ranges $20,000 to 40,000 . Does it really worth it?
Thanks Bobby, I like the picture of the little dude. I will make the next one a lady
Thanks Chris, I hope it helps
Wow this is great, it gives me so much structure to learn trading, and I love the picture.
Thanks so much Barry. I really appreciate the stuff you have compiled for me. Please allow me a day or two to go through it and perhaps come out with a plan. Thanks again.
Chris