I first discovered Finviz over 14 years ago, so when I began testing the platform again, I was eager to see if it held any exciting surprises.
Finviz has significantly enhanced its tools with major upgrades in charting, pattern recognition, and backtesting capabilities for its Elite service.
It continues to provide an outstanding free stock screening service, but it struggles to keep pace in an era of AI-driven trading.
Composite Lab Performance Score
Finviz scores 3.84, below the median all-in-one tool (4.21). That gap is expected: Finviz deliberately avoids heavy features (scripting, broker routing) and focuses on fast screening + lightweight analysis. If your workflow is screening-first, Finviz can still be a high-impact daily tool.
| Test | Calculation | Finviz | High | Median | Low |
|---|---|---|---|---|---|
| Composite Lab Performance Score (CLPS) | Average for all ratings + 5× Superpower Boost for Top 5 killer features | 3.84 | 4.75 | 4.21 | 2.93 |
| Composite Lab Performance Score (CLPS) Overall Test Winners | TradingView 4.75 | TrendSpider 4.72 | Trade Ideas 4.52 |
Finviz can feel “better than the score” for a specific workflow. If you’re a discretionary trader or investor who starts with a question like “Show me breakouts,” “Show me leadership by sector,” or “Show me unusual conditions quickly,” Finviz excels as the front-end discovery engine. You scan, shortlist, and then you move the candidates into a charting/execution environment that matches your trading style (broker platform, TradingView, etc.).
Finviz Ratings
After hands-on testing, I found Finviz to be a powerful free stock screener, with swift market heatmaps and impressive stock chart pattern recognition.
Thanks to ongoing enhancements to its charting capabilities, Finviz remains a relevant and powerful tool in stock analysis. Through my testing, I found Finviz to be an exceptional free resource, offering intuitive heatmaps, speedy stock screening, and seamless chart pattern recognition.
| Test | Tier | Score | Average |
|---|---|---|---|
| Lab Test Composite Score | B | 3.84 | 4.21 |
| Value Score (VP) | C | 1.74 | 2.82 |
| Speed & Ease of Use | AAA | 4.83 | 3.75 |
| Chart Analysis Depth Index | C | 1.54 | 3.17 |
| Chart Pattern Depth & Accuracy | C | 2.73 | 2.73 |
| Scanning Performance | C | 2.26 | 3.38 |
| Backtesting Performance | C | 2.75 | 3.38 |
| Trading Bot & Auto-Trading Reliability | C | 2.00 | 2.50 |
| AI & Algo Index | C | 2.00 | 2.00 |
| Alert Speed | B | 3.67 | 3.67 |
| Trade Signal Quality | C | 0.00 | 0.00 |
| Broker Connectivity & Ecosystem Depth | C | 0.67 | 2.00 |
| Portfolio Tool Performance | C | 2.50 | 2.80 |
| Financial News Speed & Depth | C | 1.50 | 2.30 |
| Community Utility Index (CUI) | C | 1.75 | 3.25 |
| Support Infrastructure & SLA Audit | C | 1.25 | 3.75 |
Tested using rating system v3.
See the 2026 v3 58-point Finviz test and benchmarks.
Pros
✔ 67 stock screening metrics
✔ 33 Chart Patterns Recognized
✔ Intraday (1-minute) data with Finviz Elite
✔ One of the best free stock screeners
✔ Good insider trading/news service
✔ Fast heatmaps for sector & industry visualizations
✔ Integrated news aggregation
✔ Backtesting recognizes 102 chart patterns
Cons
✘ Elite Backtesting Could Be More Flexible
✘ 21 chart indicators
✘ No app for Android or iPhone
✘ No Community
✘ Support & SLA

For those seeking more advanced features, Finviz Elite delivers value at $299 per year, providing real-time data and robust backtesting tools.
Finviz’s elite service provides real-time market data and enables up to 24 years of backtesting across multiple combinations of 102 technical indicators. Finviz is designed for individual investors, enabling them to screen for stocks, see which are on the move, and track their performance in real time.
Verdict
Finviz is a high-speed, low-friction idea discovery machine. It’s one of the easiest ways to scan the market, spot themes, and build a daily watchlist—especially at its low cost-per-day. But it is not a complete trading platform. Treat it as the front-end of your workflow, and pair it with a real charting/backtesting/execution tool if you want to turn candidates into fully tested trades.
Key Features
| ⚡ Finviz Features ? | Screening, Heatmaps, Charts |
| 🏆 Exceptional Features ? | Patterns, Signals, Auto-Trendlines |
| 🎯 Best for | Beginner Investors/Traders |
| ♲ Subscription | Monthly, Yearly |
| 💰 Price | $0 | $25 |
| 🆓 Free Plan | ✔★ |
| 💻 OS | Web Browser |
| 🎮 Trial | 30-Day Money-Back |
| ✂ Discount | 37% Discount on Yearly Plan |
| 🌎 Region | US |
Finviz Benchmarked vs. the Competition
Comparing Finviz to TradingView, Stock Rover, and TrendSpider, my tests indicate that TrendSpider is my top pick for automated AI-powered stock chart analysis, backtesting, and automated bot trading. TradingView is better for a global trading community. Stock Rover is better than Finviz for long-term growth, income, and value investors. For AI-driven robotic day trading, Trade Ideas beats Finviz.
| Features? | TrendSpider | Stock Rover | TradingView | Trade Ideas | Finviz |
|---|---|---|---|---|---|
| Rating ? | 4.72 | 4.37 | 4.75 | 4.52 | 3.84 |
| Best for: | Traders | Investors | Traders | Traders | Investors |
| Free Plan | ✘ | ✔ | ✔ | ✘ | ✔ |
| Financial Screening? | ✔ | ✔ | ✔ | ✘ | ✔ |
| 10-Year Financials | ✘ | ✔ | ✘ | ✘ | ✘ |
| Portfolio Management? | ✘ | ✔ | ✘ | ✘ | ✘ |
| Research Reports | ✘ | ✔ | ✘ | ✘ | ✘ |
| Chart Pattern Scanning? | ✔ | ✘ | ✔ | ✔ | ✔ |
| AI Stock Screening? | ✔ | ✘ | ✘ | ✘ | ✘ |
| Candle Pattern Scanning | ✔ | ✘ | ✔ | ✘ | ✔ |
| Indicator Scanning | ✔ | ✘ | ✔ | ✘ | ✔ |
| Financial News? | ✔ | ✔ | ✔ | ✔ | ✔ |
| News Scanning | ✔ | ✘ | ✘ | ✔ | ✘ |
| Stocks & ETFs | ✔ | ✔ | ✔ | ✔ | ✔ |
| FX/Commodity | ✔ | ✘ | ✔ | ✘ | ✘ |
| USA & Canada | ✔ | ✔ | ✔ | ✔ | ✔ |
| Global Market Data | ✘ | ✘ | ✔ | ✘ | ✘ |
| Features? | TradingView | TrendSpider | Trade Ideas | MetaStock |
| Rating | 4.75 | 4.72 | 4.52 | 4.42 |
| Pricing | $0 | $15 | $35 | $70 | $54 | $214 | $89 | $178 | $100 | $265 |
| Global Market Data | ✔ | USA | USA | ✔ |
| Powerful Charts | ✔ | ✔ | ✘ | ✔ |
| Stocks | ✔ | ✔ | ✔ | ✔ |
| Futures | ✔ | ✔ | ✘ | ✔ |
| Forex | ✔ | ✔ | ✘ | ✘ |
| Cryptocurrency | ✔ | ✔ | ✘ | ✘ |
| Social Community | ✔ | ✘ | ✔ | ✘ |
| Real-time News | ✘ | ✘ | ✘ | ✔ |
| Screeners | ✔ | ✔ | ✔ | ✔ |
| Backtesting | ✔ | ✔ | ✔ | ✔ |
| Code-Free Backtesting | ✘ | ✔ | ✘ | ✘ |
| Automated Analysis | ✔ | ✔ | ✔ | ✔ |
Pricing Index
Finviz’s Cost-per-day is $0.82, which is far better than the market median of $2.74 and close to the low anchor ($0.74). That’s the core reason Finviz is so commonly used as a beginner/intermediate tool: it provides meaningful screening and alerting without demanding a full workstation budget.
| Metric | Calculation | Finviz | High | Median | Low |
|---|---|---|---|---|---|
| Cost-per-day | $/day annual plan, minimum viable plan + real-time | $0.82 | $9.99 | $2.74 | $0.74 |
| $ per feature | Effective Monthly Cost / Total Features | $2.27 | $28.92 | $4.29 | $0.00 |
| Effective Monthly Cost (EMC) | Plan + required add-ons/month | $25.00 | $376.00 | $60.00 | $0.00 |
The critical nuance is that Finviz’s value proposition is split cleanly between Free and Elite. The free plan is positioned as ad-supported and still usable for screening and market visualization, which is why Finviz remains a default recommendation for newer traders building the “market scanning habit” without paying for a full platform.
Finviz’s Free Plan is ad-supported but provides great value for beginner investors. You can scan and screen over 10,000 stocks and utilize delayed charts, heatmaps, and a news stream. The free plan is ideal for beginner investors who want to explore the markets without any fuss.
The real power of Finviz is unleashed with the Elite Plan. It adds real-time data, flexible charts, alerts, excellent backtesting, and correlation charts. You can also export your screener results and access eight years of company financial statements. Elite is extremely cost-effective at $39.99/m or $24.96/m on an annual plan, saving you 37%.
Finviz Coupon Code Discount
Finviz does not offer coupon codes for its stock research software. However, Finviz offers a 37% Discount on Yearly Plan to new customers who start an Elite subscription.
Value Score (VP)
The Value Score measures product value, weighted by Feature Quality (60%), Feature Depth (30%), and Device Support Depth (10%). This isn’t pricing—it’s capability density and how “complete” the platform is.
Finviz scores 1.74, below the median competitor (2.82). That does not mean Finviz isn’t worth using—it means it’s not deep. It’s a specialist. If you want one platform to do everything, VP highlights why Finviz won’t be that.
| Metric | Calculation | Finviz | High | Median | Low |
|---|---|---|---|---|---|
| Value Score (VP) | 60% Quality + 30% Depth + 10% Device | 1.74 | 4.37 | 2.82 | 1.73 |
| Value Rank | Percentile ranking | 1.00 | 5.00 | 2.50 | 1.00 |
| Feature Quality | Avg of all feature quality ratings | 2.07 | 4.16 | 2.97 | 2.00 |
| Feature Breadth | Core feature richness count | 11 | 17 | 12 | 9 |
| Feature Depth | Percentile ranking | 1.00 | 4.75 | 3.00 | 1.00 |
| Device Support Depth | Web=2, PC/iOS/Android=1 each | 2.00 | 5.00 | 2.00 | 1.00 |
| Value Score Test Winners | TradingView 4.37 | TrendSpider 4.20 | Trade Ideas 4.05 |
Finviz’s VP score warns you not to overreach. If your identity is “active trader who needs deep charts + automation + execution,” Finviz is not the one-tool answer. If your identity is “I need a fast market lens and a discovery engine,” then VP understates the lived value—because it’s grading Finviz on categories it intentionally de-prioritizes.
Finviz runs on PCs, Macs, Tablets, and Smartphones through a browser and requires zero installation; it simply works. When you register with Finviz and log in, you are greeted with the home screen dashboard, which gives you an instant view of market performance for the current trading day, plus the top moving stocks, news, and big insider trades.
There is no Android Play Store or Apple Store App for Finviz. People might mistakenly install the FINWIZ app, but it is not the same company. Finviz is best accessed via a PC, Mac, or tablet browser.
Speed & Ease of Use
Finviz scores very high on speed and ease (4.83) compared to the median (3.75), and this is where Finviz earns its reputation. The platform is designed for rapid scanning and rapid visual parsing: heatmaps, sector tiles, and the screener workflow all reduce cognitive friction.
My dataset reflects that with a fast time-to-chart and a low click burden, but the bigger point is behavioral: Finviz encourages daily repetition—open → scan → shortlist → act.
| Metric | Calculation | Finviz | High | Median | Low |
|---|---|---|---|---|---|
| Speed & Use Index Rating | Avg of time-to-chart, multimonitor speed, 3-click | 4.83 | 5.00 | 3.75 | 2.50 |
| Time to Chart Speed (Seconds) | Click → loaded chart + 2 indicators | 1.66 | 17.03 | 4.70 | 1.55 |
| Time to Chart Performance | Points from time thresholds | 5.00 | 5.00 | 4.50 | 3.00 |
| Multi-Chart Latency (ms) | Sync delay across 4 charts | 70 | 667 | 209 | 10 |
| Multimonitor Chart Speed | Points from latency thresholds | 4.50 | 5.00 | 3.50 | 0.00 |
| 3-Click Rule Test | Clicks to place a trade or launch a scan | 2 | 6 | 3 | 2 |
| 3 Click Rule: Ease of Use | Points from click penalty | 5.00 | 5.00 | 3.25 | 0.30 |
| Speed & Ease of Use Test Winners | TradingView 5.00 | Stock Rover 5.00 | Seeking Alpha 5.00 |
In Context: My audit notes call out the downside too: it’s fast partly because it’s not doing heavy lifting (no deep multi-chart sync logic, no large indicator engines, no backtesting compute layer).
This category measures how quickly you can get to a decision-ready chart, how smoothly multi-chart layouts behave, and whether key actions stay within a low-friction click path.
Is Finviz Easy to Use?
Yes, Finviz is incredibly easy to use, especially when you become more experienced with the software. However, there are some user experience limitations: you cannot easily save chart annotations, you cannot have interactive charts and watchlists together, and you lose your work if you do not save it on every page.
Is Finviz Worth It?
Yes, the free Finviz service is worth using. It has excellent heat maps, a free stock screening service, good news aggregation, and insider trading information. What more do you expect for free?
Is Finviz Elite Worth it?
Yes, Finviz Elite is worth it, as the real-time stock market visualizations and pattern recognition help you quickly identify trading opportunities. If you expect a world-beating backtesting platform and excellent real-time charting, look at TradingView instead.
Alternatively, Finviz Elite may not be worth it, as the backtesting service does not provide sufficient data for system reporting. The real-time chart data is accurate only to the minute, not tick-by-tick. Finally, the Elite interactive charting does not allow you to add indicators or save annotations.
Chart Analysis Depth Index
This measures chart types, indicator depth, and whether you can build/extend custom indicators. It matters because charting depth determines whether you can evolve from basic visual checks into advanced technical workflows.
Finviz’s chart analysis depth score (1.54) is far below the median (3.17), and readers should treat this as a boundary marker: Finviz charts are “good enough to confirm,” not “deep enough to build.”
Even with Elite improvements, the charting ecosystem isn’t built around indicator research, custom scripting, or saving complex annotated workspaces.
| Metric | Calculation | Finviz | High | Median | Low |
|---|---|---|---|---|---|
| Chart Analysis Depth Index | Avg of chart depth, indicator depth, custom coding | 1.54 | 5.00 | 3.17 | 0.50 |
| Chart Types | Total count | 5 | 38 | 10 | 1 |
| Chart Depth | 0.3 points per chart | 1.50 | 5.00 | 3.00 | 0.30 |
| Indicators | Total count | 125 | 400 | 116 | 0 |
| Indicator Depth | 0.025 points per indicator | 3.13 | 5.00 | 2.90 | 0.00 |
| Custom Indicator Coding | Available = 5 points | 0.00 | 5.00 | 2.50 | 0.00 |
| Chart Analysis Depth Index Test Winners | TradingView 5.00 | MetaStock 5.00 | Optuma 5.00 |
Here’s what the metric is capturing. Chart Depth is driven by the variety of chart types and the extent to which charts support technical workflows. Finviz has a low chart type count (5 in my dataset) and no custom indicator coding (0.00). That matters because modern technical traders don’t just look at charts—they operate inside them: custom studies, alerts tied to indicators, multi-timeframe templates, and repeatable layouts.
Heat Maps
The Finviz heatmaps visualize the US and world stock market performance, which is great for finding trading opportunities. Finviz manages to cram the entire world’s moving stocks onto a single-page heatmap at lightning speed, which is very impressive. Hovering your mouse over a ticker symbol shows the stock’s current performance, a mini line chart, and the company’s direct competitors.
Charting Test
Using Finviz to look at stock charts is different from using other stock software products. Whereas MetaStock and TradingView charts provide hundreds of fundamental technical analysis indicators, Finviz provides basic pattern recognition on daily charts and a small but growing handful of overlays and indicators.
I like Finviz’s automatic trendline recognition and its ability to identify price patterns like wedges, triangles, double bottoms, and rectangles; this is a big advantage for pattern traders.
Finviz has 13 chart overlays, including Bollinger Bands, VWAP, and 21 chart indicators. Finviz now auto-saves interactive charts, and your trendlines and annotations are replicated throughout the platform; this recent improvement benefits the users immensely.
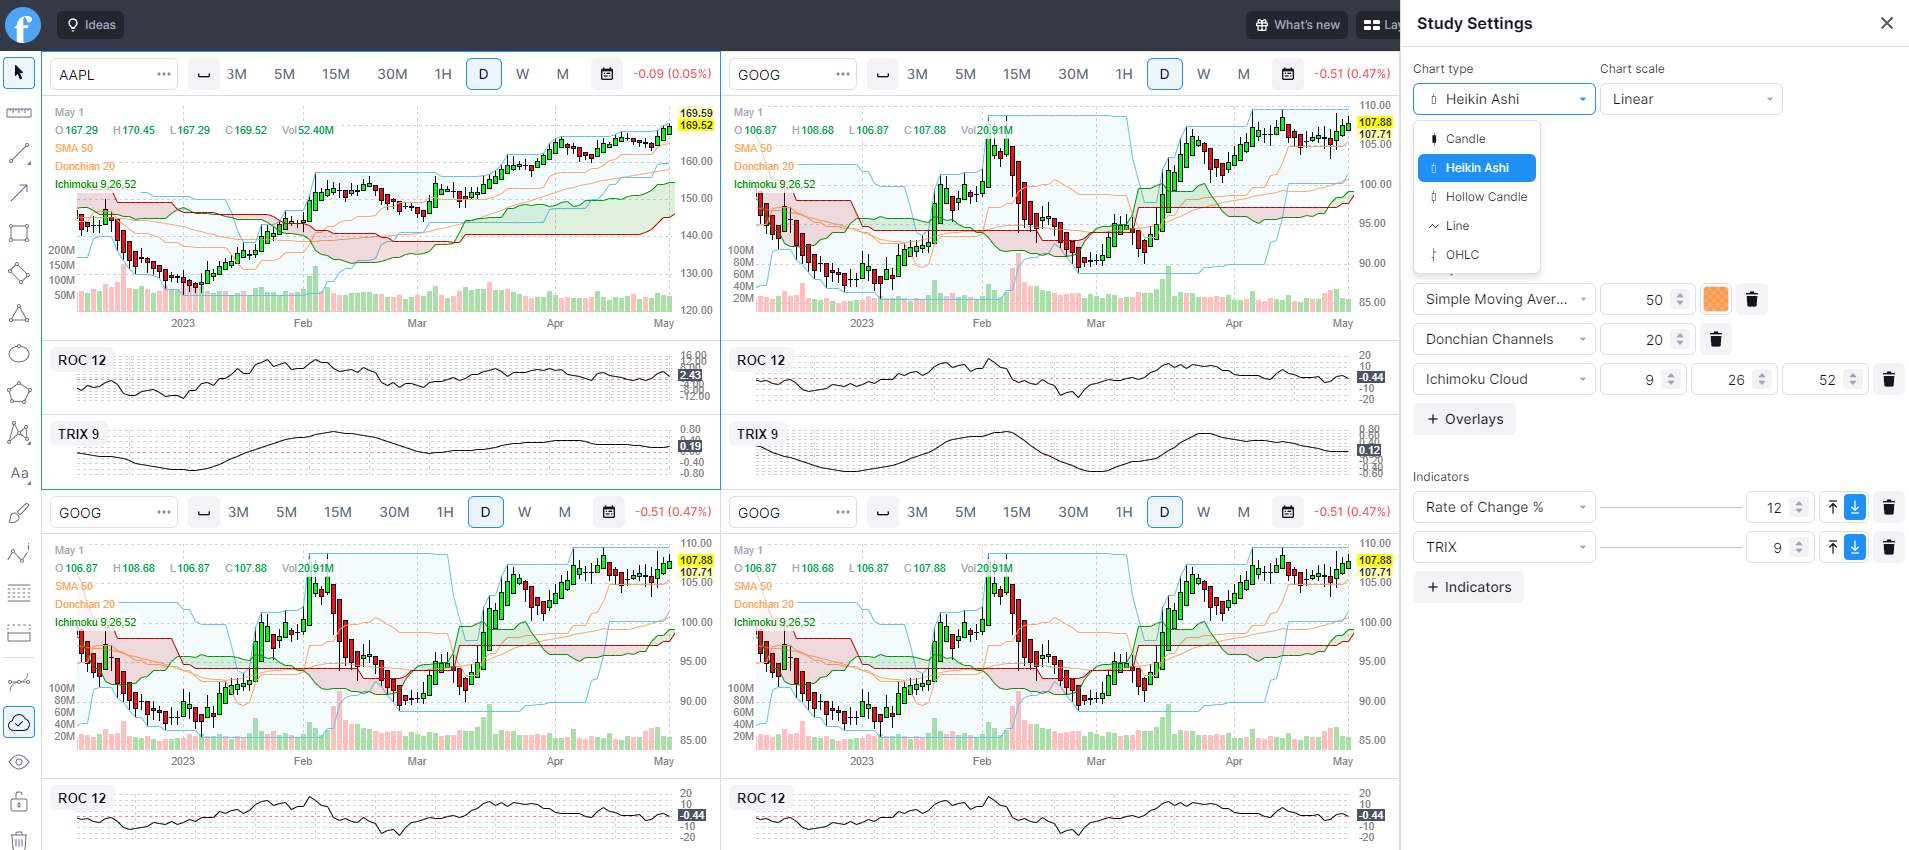
Finviz Elite Stock Charts
The Finviz Elite interactive charting is being continuously developed, and now the charts are very good. Integration of Heiken Ashi charts is a welcome improvement. Additionally, more overlays and indicators are being added. Charts now auto-save, and your annotations are available throughout Finviz’s platform.
At the time of writing, there is no watchlist, so you cannot flick through your portfolio of stocks and analyze the chart; you need to enter the tickers manually.
Alerts (Elite Plan)
Finviz can alert you about any individual stock or portfolio. Alerts can be triggered by financial news, price changes, analyst rating changes, or insider trading. These alerts are interesting because I do not know any other stock software that provides such alerts on the news or insider trading, except for Benzinga Pro.
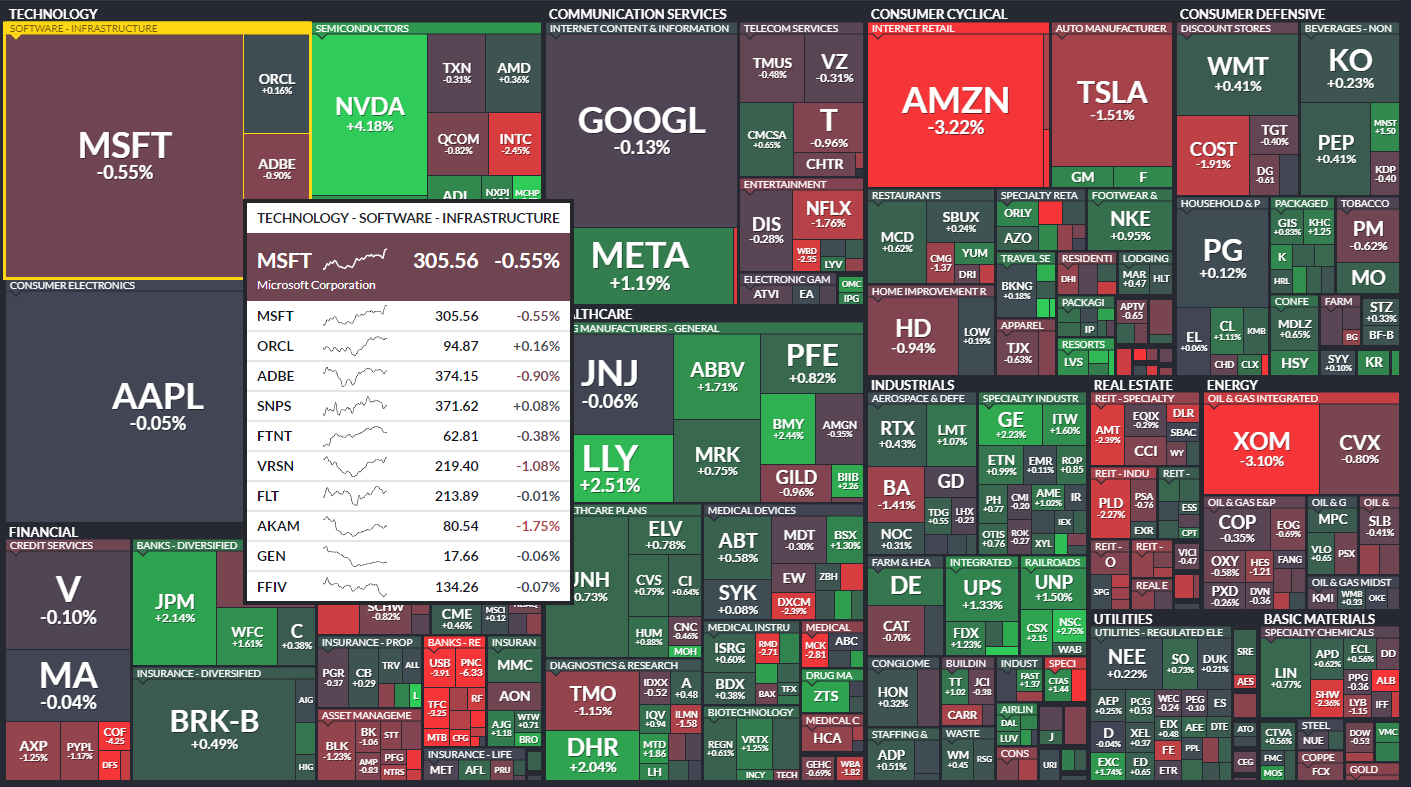
Viewing the Finviz stocks heatmaps based on analyst recommendations shows how biased institutional analysts are, as 70% of stocks are flagged as positive.
Finviz allows you to visualize markets based on stock price performance, volume, P/E, PEG, Dividend Yield, Float, EPS, and even analyst recommendations. You can click on a stock and jump directly to the individual company data and chart. The whole process is extremely fast and efficient.
Chart Pattern Depth & Accuracy
Finviz’s pattern score (2.73) lands essentially right on the median (2.73), and that’s meaningful because pattern recognition is one of the few “analysis” capabilities Finviz emphasizes beyond classic screening.
This category assesses whether pattern recognition is both broad and accurate enough to be actionable.
Pattern recognition is treated as a modern advantage—especially when it helps traders compress time: you’re not manually hunting for shapes across hundreds of charts; you’re filtering for patterns and confirming the best candidates.
| Metric | Calculation | Finviz | High | Median | Low |
|---|---|---|---|---|---|
| Pattern Recognition Efficacy & Accuracy | Avg depth + accuracy points | 2.73 | 4.88 | 2.73 | 0.00 |
| Total Patterns | Count recognized | 44 | 226 | 57.5 | 0 |
| Pattern Recognition Depth | 0.33 points per pattern | 1.45 | 5.00 | 1.90 | 0.00 |
| Accuracy | Percent accurate | 80 | 95 | 89 | 0 |
| Pattern Recognition Accuracy | 0.05 points per accuracy % | 4.00 | 4.75 | 4.48 | 0.00 |
| Chart Pattern Recognition & Accuracy Test Winners | TrendSpider 4.88 | Trade Ideas 4.62 | TradingView 3.98 |
Scanning Performance
Finviz’s scanning score (2.26) is below the median (3.38), which surprises people because Finviz feels like a great screener. The metric explains why: scanning performance here is not just “Can I filter stocks?”
It’s a combination of speed, criteria depth, and whether you can do custom code scanning. Finviz is strong at rapid filtering using built-in criteria, but it’s not a programmable scan engine—and it’s not trying to be.
| Metric | Calculation | Finviz | High | Median | Low |
|---|---|---|---|---|---|
| Market Scanning Latency & Depth | Avg speed + criteria + code | 2.26 | 5.00 | 3.50 | 0.75 |
| Scanner Performance (ms) | S&P 500 across 5 criteria | 144 | 2500 | 300 | 7 |
| Scanning Speed (ms) | Points from thresholds | 4.50 | 5.00 | 4.00 | 1.00 |
| Scanner Auto-Refresh Rate (seconds) | Not scored | 10 | 60 | 1 | 0 |
| Scanning Criteria & Depth (count) | Total criteria count | 182 | 675 | 200 | 30 |
| Scanning Criteria & Depth (points) | 0.0125 per criterion | 2.28 | 5.00 | 2.50 | 0.75 |
| Custom Code Scanning | Exists = 5 points | 0.00 | 5.00 | 5.00 | 0.00 |
| Scanning Performance Test Winners | Stock Rover 5.00 | TradingView 4.83 | TrendSpider 4.67 |
Scanning is where Finviz should shine, so this category is important. It measures speed, criteria depth, and custom-code scanning.
The limitations are equally practical. Premarket and extended-hours scanning is Elite-only, affecting momentum traders who rely on premarket gappers. And because Finviz doesn’t support custom code scanning, advanced traders who want fully bespoke logic (factor models, conditional regimes, custom indicators) will quickly outgrow it. That’s the difference between “screening as a product feature” and “scanning as an engineering system.”
The Finviz screener allows for rapid filtering of 8,500+ major stocks and ETFs. However, this is not all the stocks in the world; it is just the major stocks, as there are over 10,000 stocks in the USA alone.
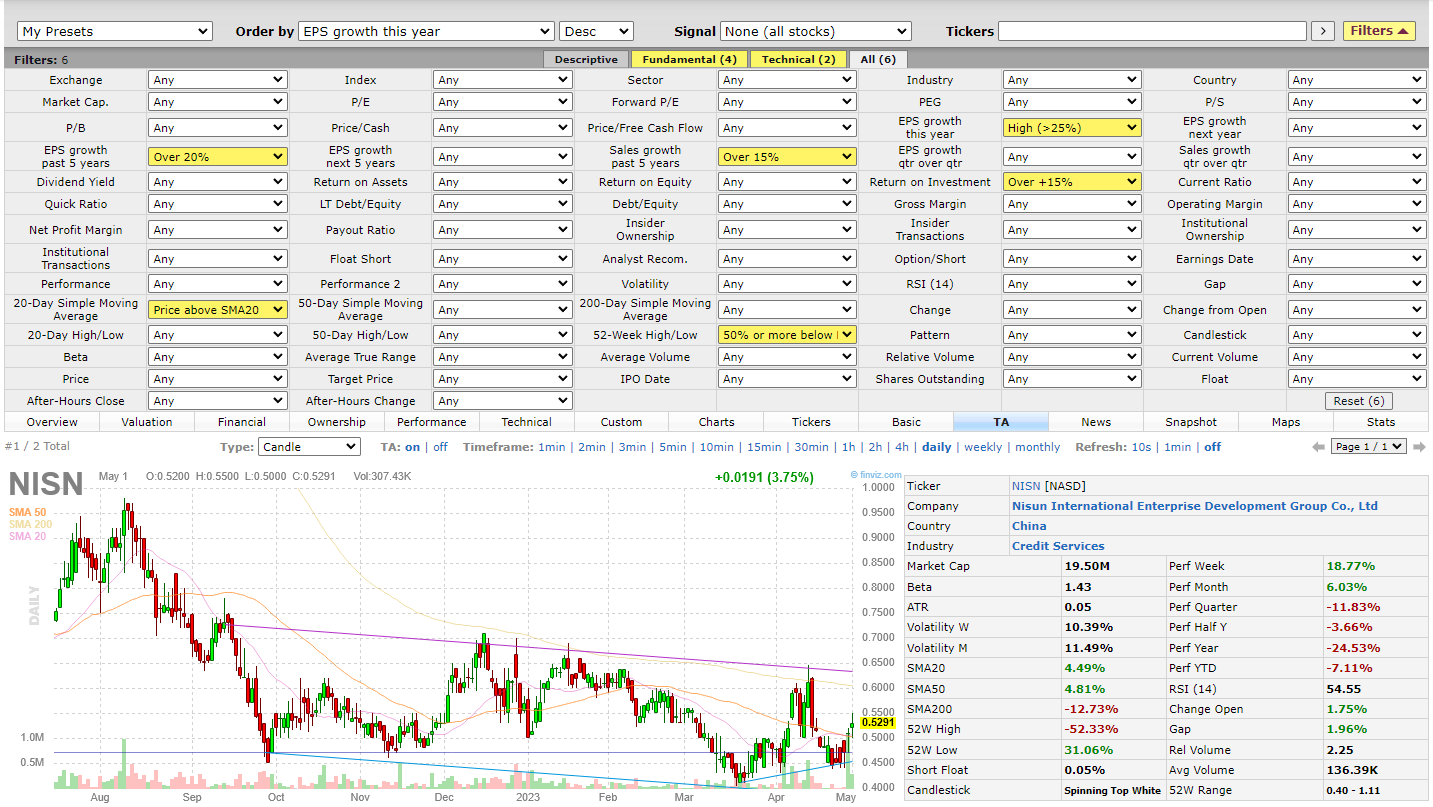
The Finviz stock screener is extremely fast and allows you to filter on 182 fundamental and technical criteria. You can filter the stocks on specific chart-based signals such as new highs, lows, oversold, analyst upgrades, insider buying, or even chart patterns like double tops and head-and-shoulders.
Finviz allows you to scan for a mix of 67 fundamental criteria and combine them with 30 different trading signals. That may seem like a huge choice, but TradingView and Stock Rover provide over 650 options.
Finviz also shines where the others do not, because you can also screen on ten major candlestick patterns and 30 stock chart patterns. This mix of fundamental screening criteria for investors, technical charts, and candlestick pattern recognition for traders makes Finviz a good match for short-term and medium-term investors.
In the screenshot below, I have highlighted the key fields in the Finviz stock screener in red. To test the Finviz screener, I built a growth stocks screening strategy to demonstrate using high EPS growth, sales growth, ROI, and price above the 20-day moving average.
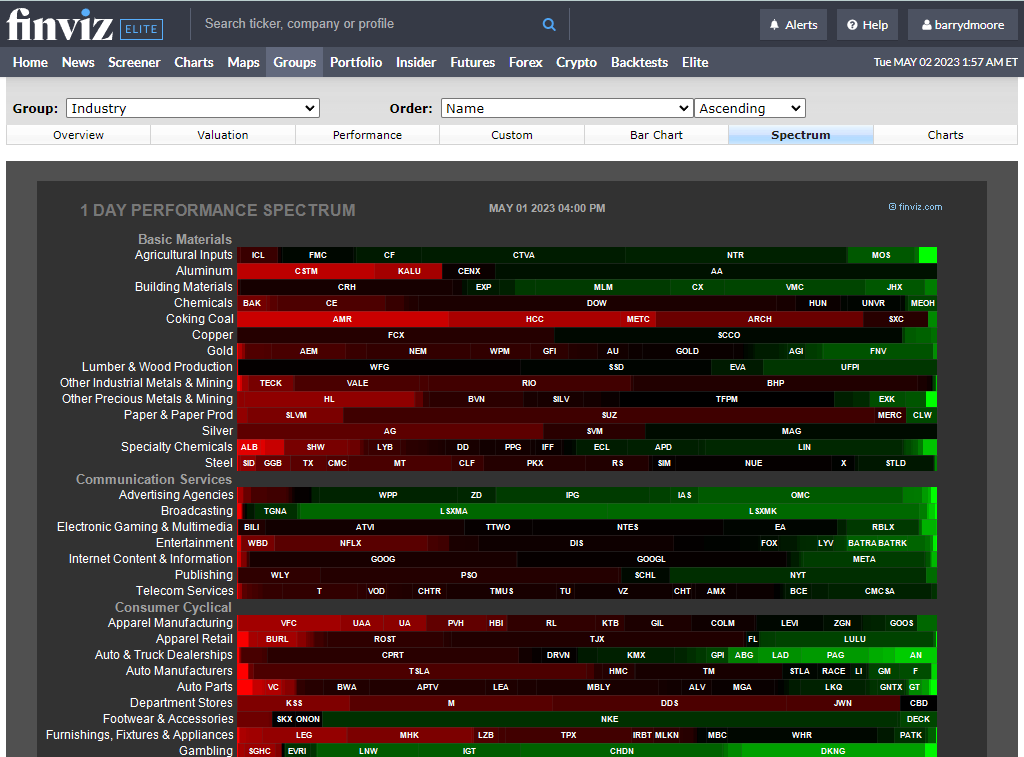
Groups, Industry & Sector Analysis
The Finviz Groups tab allows you to visualize the price performance of US stock sectors or industries based on daily, weekly, quarterly, or yearly performance. This lets you see which sectors are performing well and drill down to individual stocks to look for trading opportunities.
Are there Pre-Built Screeners Integrated into Finviz?
No, with nearly all of the best stock screening software, the companies endeavor to pre-build stock screeners as examples or inspiration; this is not the case with Finviz. Stock Rover provides over 150 pre-built, curated screening strategies to import and use immediately.
Backtesting Performance
Finviz’s backtesting performance (2.75) is below the median (3.38), yet it’s one of the most misunderstood parts of Finviz. The review positions Elite backtesting as a key reason to upgrade, emphasizing that it’s fast, no-code, and based on decades of data, which is exactly what many retail traders need to stop “vibing” strategies and start validating them.
| Metric | Calculation | Finviz | High | Median | Low |
|---|---|---|---|---|---|
| Quantitative Backtesting Fidelity | Avg of speed, no-code, coding, report, basket | 2.75 | 4.90 | 3.38 | 0.00 |
| Backtesting Speed (ms) | 10y daily or 2m 5-min | 413 | 6000 | 302 | 7 |
| Backtesting Speed | Points from thresholds | 4.00 | 5.00 | 4.25 | 0.00 |
| No Coding Required | Zero-code backtesting | 5.00 | 5.00 | 5.00 | 0.00 |
| Flexible Coding Backtesting | Exists = 5 points | 0.00 | 5.00 | 5.00 | 0.00 |
| Backtesting Report Quality | % reporting criteria | 40 | 100 | 70 | 0 |
| Backtesting Report Quality | 0.05 per 1% | 2.00 | 5.00 | 2.25 | 0.00 |
| Multi-Stock Basket Backtesting | Exists = 5 points | 5.00 | 5.00 | 5.00 | 0.00 |
| Backtesting Performance Test Winners | Optuma 4.94 | TrendSpider 4.88 | MetaStock 4.81 |
Where Finviz shines is the “time-to-first-backtest.” If you’re not a coder, most platforms force you into a technical barrier: scripting languages, strategy templates, or limited “checkbox backtests.” Finviz’s backtester is built to be approachable: you can combine indicators and detected patterns without writing code, and iterate quickly. That makes it exceptionally useful for traders who want to test ideas like “momentum + trend filter” or “pattern-triggered entries” without building infrastructure.
The Finviz Backtester offers over 100 unique indicators and automatically detects stock chart patterns to help build a truly unique system. Backtesting requires no coding skills, which is a huge benefit.
As an experienced author of successful backtested strategies, including the Liberated Stock Trader, Beat the Market System on Stock Rover, the MOSES Market Outperforming Stock ETF System on TradingView, and the Stock Market Crash Detector, I know what I am doing. So, I was very excited to try the Finviz backtesting service.
How to Build a Successful Backtest In Finviz
I was impressed after one hour of working on strategies with the Finviz backtester. The backtester offers over 100 unique indicators and automatically detects stock chart patterns to help you build a truly unique system.
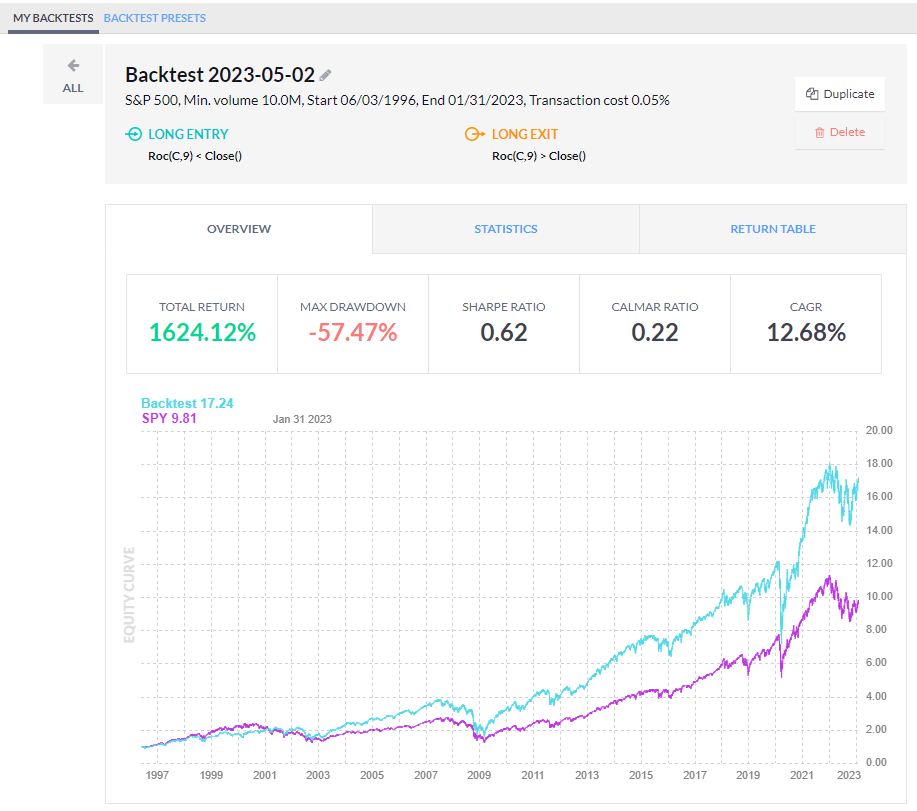
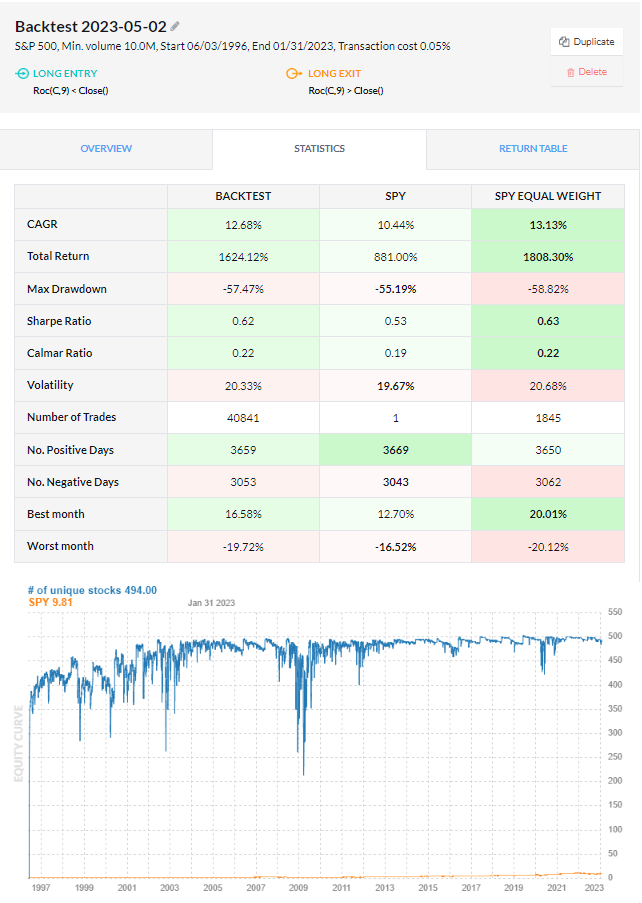
After all this work, I created a system based on the Price Rate of Change that has handsomely outperformed the S&P 500 index over the last 25 years.
The system returned a profit of 1,624%, with a compounded annual return (CAGR) of 12.68% versus the S&P 500’s 10.44% (See the proof below).
Try Super Fast Entire Market Backtesting with Finviz
Trading Bot & Auto-Trading Reliability
Finviz scores 2.00 against a median 2.50, which is essentially a “do not confuse screening with automation” warning. This category measures whether a tool can reliably move from analysis → signal → execution. Finviz can help you identify opportunities, and Elite adds alerts (including some unusually useful trigger types), but it does not function as a bot platform or broker-linked automation framework.
| Metric | Calculation | Finviz | High | Median | Low |
|---|---|---|---|---|---|
| Automated Execution & Bot Reliability | Sum of path + sophistication + assurance | 2.00 | 4.50 | 2.50 | 0.00 |
| Bot & Auto-Trading Reliability Test Winners | TrendSpider 4.50 | Trade Ideas 4.00 | Tickeron 4.00 |
If you’re an automated trader, you need a clean automation path (webhooks/APIs, native order routing, or broker-linked execution rules). Finviz’s strength is upstream: it’s the sensor array that spots candidates. Once you need deterministic execution, risk rules, order types, and monitoring, you move to your broker platform or an automation-capable tool.
That said, Finviz remains relevant to automation-minded traders as a signal input, not as an execution engine. Alerts can be tied to meaningful events (news/insider/analyst changes), which can feed a discretionary workflow or a semi-automated routine where you review alerts and execute elsewhere. In my audit language: Finviz is better at “prompting action” than “taking action.”
AI & Algo Index
Finviz sits at 2.00, right on the median. In practice, it’s a filtering engine, not an AI-native tool. That’s fine, don’t buy it expecting AI strategy synthesis or ML-driven signals.
This category is easy to misread. “AI” isn’t the same as “useful.” Many traders gain more from simple, explainable filtering than from black-box predictions. Finviz’s value tends to come from clarity and visual compression of the market.
| Metric | Calculation | Finviz | High | Median | Low |
|---|---|---|---|---|---|
| Algorithmic Intelligence & AI Tier Index | Algo + AI layer + transparency | 2.00 | 5.00 | 2.00 | 1.00 |
| AI & Algo Index Test Winners | TrendSpider 5.00 | Trade Ideas 4.50 | Tickeron 4.50 |
Pattern recognition can be machine-learning-assisted in a broad sense, but it’s not the same as an AI agent that synthesizes strategies, forecasts regimes, or generates order logic. Finviz is still largely “you define the criteria, it shows you the list.” That’s algorithmic, but it’s not AI-forward.
Alert Speed
Finviz scores 3.67, right at the median. It supports unlimited alerts and multiple delivery methods, but it doesn’t have the richer bot/webhook execution pathways that make alerting feel like automation.
Elite alerts aren’t only “price crossed X.” Note alerts can trigger on financial news, analyst rating changes, and insider trading, which is relatively rare in consumer-grade tools and directly aligned with catalyst-based trading workflows.
| Metric | Calculation | Finviz | High | Median | Low |
|---|---|---|---|---|---|
| Alert Trigger Latency & Delivery Speed | Avg of concurrency, streams, speed | 3.67 | 4.67 | 3.67 | 2.33 |
| Alert Speed Test Winners | TradingView 4.67 | TrendSpider 4.33 | Benzinga Pro 4.33 |
This matters because “alert speed” isn’t purely latency; it’s also relevance. A fast alert that fires constantly is noise. Finviz’s advantage is that it can alert on events that often precede volatility or narrative shifts, which can be extremely useful for swing and event-driven traders who don’t want to babysit news feeds all day.
Broker Connectivity & Ecosystem Depth
Finviz’s broker/ecosystem score is low (0.67 vs median 2.00), and the reader implication is direct: Finviz is not where trades happen. It’s where ideas are found and monitored. That’s consistent with how the platform is described and used: screening, heatmaps, news aggregation, alerts, and basic portfolio/watchlist monitoring—not execution.
| Metric | Calculation | Finviz | High | Median | Low |
|---|---|---|---|---|---|
| Asset & Data Coverage Index | Avg live trading, broker integration, coverage | 0.67 | 5.00 | 2.00 | 0.67 |
| Broker Connectivity & Ecosystem Test Winners | TradingView 5.00 | MetaTrader 5.00 | TrendSpider 4.43 |
Asset coverage also matters here. Finviz is heavily equities-centric; crypto/FX coverage exists but is light and lacks context. If you’re a multi-asset trader, you’ll likely use Finviz for equities discovery and rely on other tools for FX/crypto execution, data depth, and research.
My audit guidance: Finviz is strongest as a specialist module in your stack. If you already have a broker platform you trust, the lack of broker connectivity is almost irrelevant—because Finviz improves the front end of your process. If you’re searching for a single platform to analyze + execute + manage everything, this category is warning you that Finviz won’t meet that requirement.
When I upgraded to FinViz Elite, I expected the heatmaps to flicker and glow to show stock prices moving visually. I expected the industry sectors to show me the ebb and flow of entire industries being bought and sold. I expected the interactive stock charts to be buzzing with real-time tick-by-tick data. I got none of that.
You cannot set a refresh rate on the heatmaps or the industry grouping visualizations, so there was no dynamic element. Additionally, the interactive stock charts do not provide tick-by-tick real-time data; the lowest level of granularity is 1 minute. As I mentioned before, you cannot add indicators or save your settings on the Finviz Elite charts, which makes them a disappointment.
But there are many good reasons to upgrade to Finviz Elite, especially the simple yet incredibly powerful backtesting tool with 24 years of data.
Portfolio Tool Performance
Finviz’s portfolio score (2.50) sits just below the median (2.80), and the reason is straightforward: Finviz portfolios are not “portfolio analytics,” they’re closer to watchlist monitoring. My audit explicitly describes the portfolio functionality as basic and “more like a simple watchlist,” even though it’s useful for tracking aggregated news and monitoring screener outputs.
| Metric | Calculation | Finviz | High | Median | Low |
|---|---|---|---|---|---|
| Portfolio Health & Risk Analytics | Category score | 2.50 | 4.80 | 2.80 | 2.00 |
| Portfolio Tool Performance Test Winners | Stock Rover 4.80 | Portfolio 123 4.80 | Seeking Alpha 4.30 |
That distinction matters because “portfolio tools” can mean wildly different things. A true portfolio analytics suite helps you manage allocation, factor exposure, correlation clusters, dividend projections, rebalancing rules, and risk decomposition.
Finviz is not built for that. But many traders don’t actually need that level of tooling day to day. They need a place to store a shortlist and stay informed about what’s happening—price movements, news catalysts, and notable changes.
The Finviz portfolio management functionality is basic. While you can easily export the results of a screener directly into a portfolio for monitoring and see any aggregated news on that portfolio, calling it a portfolio is a stretch. The portfolio functionality is more like a simple watchlist.
Financial News Speed & Depth
Finviz’s news score (1.50) is below the median (2.30), and the reason is not that Finviz lacks news—it’s that Finviz is an aggregator, not a low-latency terminal. My audit describes it as a headline aggregation service pulling from many major outlets, which is useful for context but not ideal for “breaking news trading,” especially when many premium sources are paywalled.
| Metric | Calculation | Finviz | High | Median | Low |
|---|---|---|---|---|---|
| Financial News Speed & Quality Rating | Weighted rubric | 1.50 | 5.00 | 2.30 | 0.00 |
| Financial News Speed & Depth Test Winners | MetaStock 5.00 | Benzinga Pro 5.00 | Scanz 5.00 |
News “depth” has two layers: (1) how many sources are included and how filterable they are, and (2) how actionable the feed is in real time. Finviz can be very good for the first layer—getting a broad view of what’s moving and why. But if your trading edge depends on being first to a catalyst (FDA headline, earnings leak, filing spike), you want a purpose-built newsroom product.
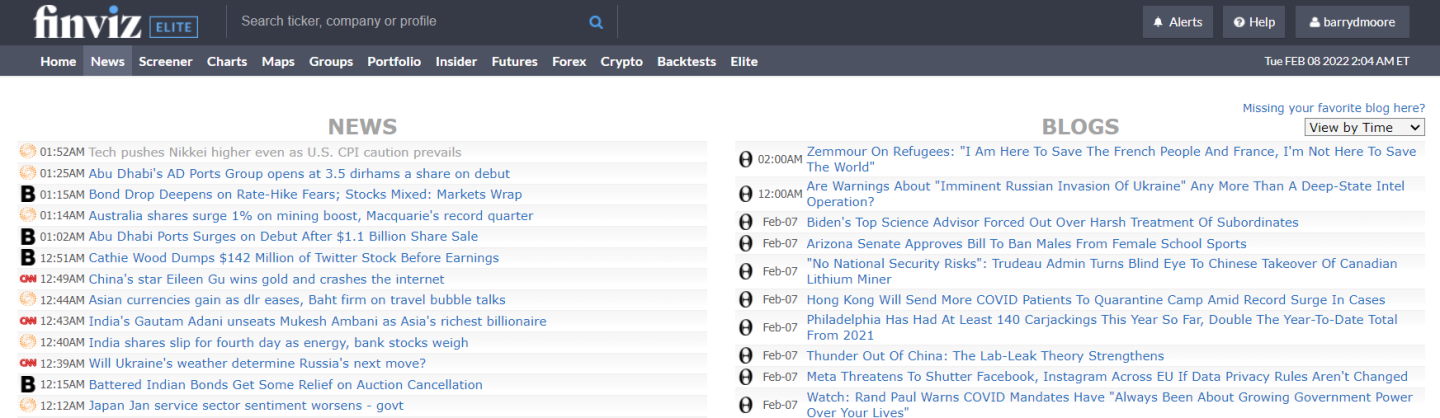
Finviz aggregates news from many outlets, including MarketWatch, Bloomberg, WSJ, CNBC, Fox, and the New York Times. If you only want to read the headlines, this is a good service to get an idea of the latest market action. But of course, the NYT and Bloomberg articles are all behind a paywall, so you cannot get into too much detail. On the upside, Finviz will alert you if there is news on a stock in your portfolio, which is very useful.
If you want to trade real-time news, I recommend Benzinga Pro. Alternatively, read my test of the 13 Best Financial Stock Market News Sources and Feeds.
Unlike TradingView, Finviz does not have social trading, chat, or a community of traders.
Community Utility Index (CUI)
Finviz scores low on community (1.75 vs median 3.25), and the reader interpretation is clean: Finviz is not a social platform. There’s no meaningful chat, social trading, or strategy-sharing ecosystem inside the product. Contrast this with TradingView, and note that Finviz lacks a trader community layer.
| Metric | Calculation | Finviz | High | Median | Low |
|---|---|---|---|---|---|
| Community Utility Index | Avg size + contribution | 1.75 | 5.00 | 3.25 | 1.75 |
| Community Utility Index Test Winners | TradingView 5.00 | MetaTrader 5.00 | Trade Ideas 4.75 |
That’s a disadvantage if you learn best by observing others—shared indicators, public watchlists, published trade ideas, or community-contributed scripts. In those environments, the community becomes a force multiplier: you don’t just use the tool; you inherit thousands of workflows created by power users. Finviz doesn’t offer that type of “alpha library.”
Support Infrastructure & SLA Audit
Finviz scores 1.25, well below median 3.75. This aligns with its positioning: it’s not a mission-critical, enterprise-style platform with time-to-human expectations.
| Metric | Calculation | Finviz | High | Median | Low |
|---|---|---|---|---|---|
| Support SLA Audit: Time-to-Human Benchmarks | Avg channels + response time | 1.25 | 5.00 | 3.75 | 1.00 |
| Support Infrastructure & SLA Audit Winners | TrendSpider 5.00 | TC2000 5.00 | ThinkorSwim 4.75 |
Finviz’s support score (1.25) is far below the median (3.75), and this category exists because platform reliability matters once you pay. When you’re running daily scans and relying on alerts, “support responsiveness” becomes part of your trading risk management—especially if something breaks during market hours.
In the audit I flag trust and transparency signals (e.g., limited corporate visibility and mixed external trust indicators), which should prompt readers to be more cautious about relying on Finviz as a mission-critical system.
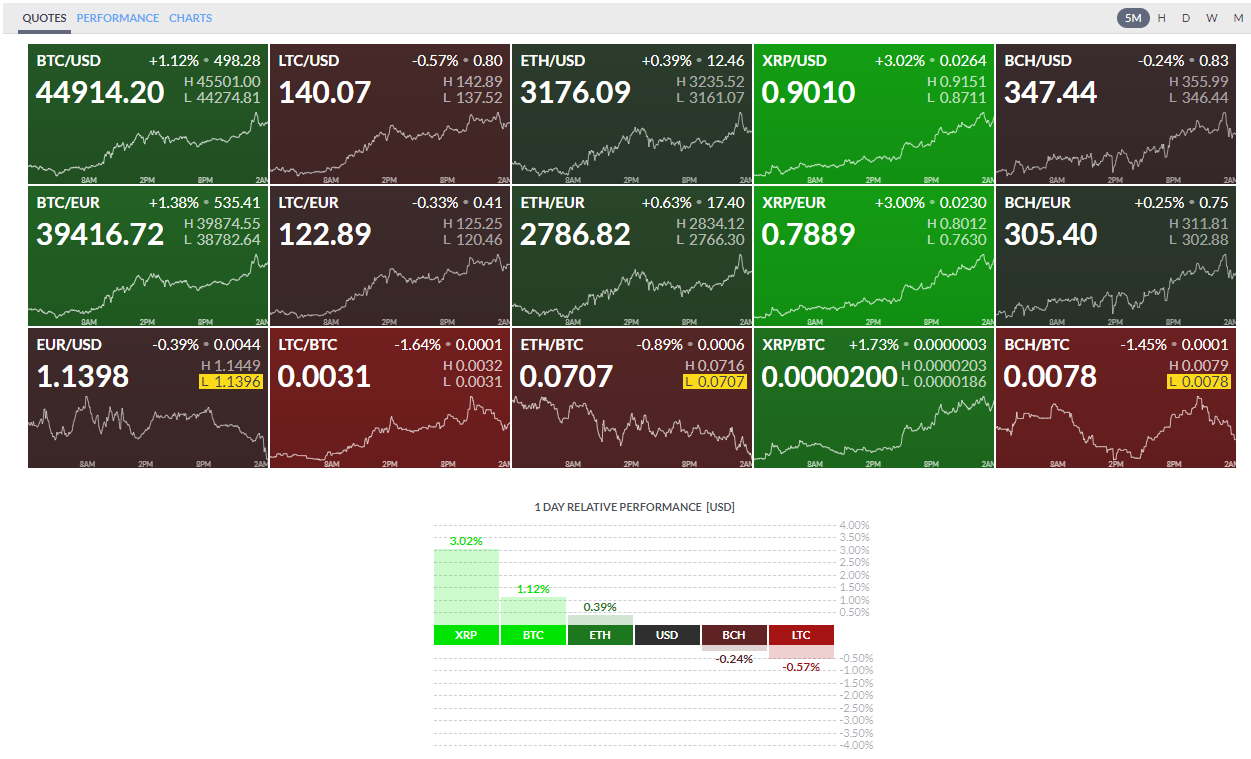
Finviz Crypto & Forex Heatmaps
The Finviz analysis for cryptocurrency covers only 15 coins and provides charting but no performance information. Finviz tracks 12 foreign exchange pairs, but no background analysis or news. You can click on any chart (see the image below) and jump to an interactive chart, but you cannot save annotations or settings.
FAQ
How to use Finviz to find breakout stocks?
A great way to find breakout stocks in Finviz is to select two criteria from its stock screener. Select "Price crossed MA50 above" and "Gap Up 5%." These two criteria show stocks that were in a downtrend but are now breaking up through the 50-day moving average with a 5% daily gap.
Does Finviz have a mobile app?
No, Finviz does not have a mobile app. Despite the world's internet users moving to mobile, Finviz lags behind in mobile-first development. The Finviz.com website is fast on mobile but not user-friendly.
Does Finviz scan premarket?
Yes, Finviz does scan premarket and extended hours, but only with the Elite service. The Finviz free service does not allow access to premarket or extended-hours data.
How much is Finviz Elite?
Finviz Elite costs $39.99/mo, but if you choose an annual plan, that price drops to $25/mo because of the 40 percent annual discount.
How often does Finviz update?
Finviz Elite will provide up-to-date data with 1-minute accuracy. Finviz Free updates with a 12-15 minute delay. Testing the Apple Inc. stock price, the Finviz Free plan pricing is delayed by 12 minutes, but the free TradingView service is nearly real-time with only a 1-minute delay.
How to find good stocks on Finviz?
Finding a good stock on Finviz depends on what you define as a good stock. If high earnings make a good stock for you, then screen for "EPS growth 5 next years" or "EPS growth qtr over qtr".
How to find low-float stocks on Finviz?
Finviz makes it easy to find low-float stocks, select "Float Short Over 20% in the stock screener, and you will have a list of 50 stocks with a low float.
How to find short-squeeze stocks on Finviz?
To find short squeeze stocks on Finviz, go to the stock screener and select "Float Short Over 30%" and "Option/Short - Optionable." This will provide a list of 10-20 short-squeeze stocks.
How to find undervalued stocks on Finviz?
Finviz does not have the ability to find undervalued stocks. An undervalued stock sells at a discount to its 10-year projected discounted forward cash flow (FCF). The only stock screener that allows you to find undervalued stocks is Stock Rover's Premium+ Plan. Stock Rover has accurate FCF, Fair Value, and Margin of Safely criteria for those seeking value stocks.
How to find value stocks on Finviz?
Finviz does not enable investors to find value stocks. Value stocks are defined by a low stock price versus future cash flows and profits. Value investors should look at Stock Rover, which provides vital value investor criteria such as Fair Value and Margin of Safely.
Is Finviz free?
Yes, Finviz is free; in fact, 80 percent of Finviz customers use the free version of Finviz. Finviz free has many benefits; it is fast, simple to use, and has built-in stock chart pattern recognition. Unfortunately, the free version of Finviz is inundated with adverts, which can spoil the user experience. You can remove the adverts and get real-time data with Finviz Elite.
Is Finviz legit?
Finviz has been online since 2005, but does that make it a legitimate company? Surprisingly there is very little public information about Finviz and no reference to the ownership, corporate structure, or goverance. Deeper research shows Finviz has a 2.9-star rating on Trustpilot, and the website provides no legitimate address, phone number, or corporate contacts.
Who owns Finviz?
According to very few online sources, the owner of Finviz is Slokavian Juraj Duris. Surprisingly there is no reference to the ownership or corporate structure of Finviz on its website or anywhere else on the internet.
Is Finviz reliable?
The Finviz service is reliable and fast. However, my testing has found issues in the Elite charting and backtesting service results.
Are Finviz charts real-time?
Finviz charts are real-time with an accuracy of 1 minute only with the Finviz Elite service. Finviz Elite costs $25/mo with a 40 percent annual discount.
Are Finviz stock quotes delayed or in real-time?
Finviz quotes are both delayed and real-time. With the free Finviz service, quotes are delayed between 12-15 minutes. With Finviz Elite, the data is close to real-time with only a 1 minute day. Real-time data, like with TradingView, is with only a 1-5 second delay.
Can Finviz chart Elliott waves?
No, Finviz does not have Elliott Wave charting capabilities. With Finviz Elite, it is possible to plot Elliott waves on charts, but TradingView Pro has automated Elliott Waves analysis algorithms that do the hard work for you.
Can Finviz scan for float?
Yes, Finviz can scan for a float with two screening criteria. "Float Short" allows you to scan for float less than 5% or over 30%, and the "Float" criteria enables you to select the number of shares float between -1 million and plus 1,000 million.
- Related Article: Portfolio 123: An Excellent Alternative To Finviz.
- Related Article: StockCharts vs. TradingView: Head-to-Head Comparison
- Related Article: TC2000 vs. TradingView: We Do The Test To See Who’s Best?
- Related Article: TradingView vs. TrendSpider: 9 Epic Tests To See Who’s Best?
- Related Article: Finviz vs. Tradingview: Rated & Ranked, Who Gets Spanked?