Trade Ideas offers hundreds of strategies, scans, and automated trading algorithms, along with audited performance results, to meet the needs of the most discerning traders.
My testing awards Trade Ideas an AA rating of 4.52 stars. Its stock scanner, alerting, and algorithmic trading signals are advanced and trustworthy. Brokerage Plus auto-trading is a great feature for experienced traders.
This review will give you all the information you need to decide whether AI trade signals and auto-trading are right for you.
Composite Lab Performance Score
Trade Ideas scores AA 4.52, above the median competitor 4.21 and not far off the 4.75. The reason the composite is strong is simple: Trade Ideas concentrates performance in categories that directly reduce execution friction and opportunity cost—signals, scanning, pattern recognition, backtesting, AI/algo intelligence, alerts, and community support.
| Test | Calculation | Trade Ideas | High | Median | Low |
|---|---|---|---|---|---|
| Composite Lab Performance Score (CLPS) | Average for all ratings + 5X Superpower Boost for Top 5 killer features | 4.52 | 4.75 | 4.21 | 2.93 |
| Composite Lab Performance Score (CLPS) Overall Test Winners | TradingView 4.75 | TrendSpider 4.72 | Trade Ideas 4.52 |
Trade Ideas lands in the top tier overall. In my audit notes, the platform’s edge comes from real-time scanning and high-fidelity AI-driven signal workflows, rather than “all-in-one” breadth of charting.
This is not an “everything platform.” It is a high-throughput decision engine: find tradable candidates quickly, validate quickly, and act (manually or via automation).
Test Results & Verdict
My in-depth testing shows that Trade Ideas is the ultimate black-box, AI-powered day-trading signal platform with built-in automated bot trading. Three automated Holly AI systems pinpoint trading signals for day traders. Trade Ideas promises and delivers market-beating returns.
| Test | Tier | Score | Average |
|---|---|---|---|
| Lab Test Composite Score | AA | 4.52 | 4.21 |
| Pricing Index: $/day | A | $5.85 | $2.74 |
| Value Score (VP) | A | 4.03 | 2.82 |
| Speed & Ease of Use | AA | 4.50 | 4.50 |
| Chart Analysis Depth Index | C | 2.93 | 3.17 |
| Chart Pattern Depth & Accuracy | AA | 4.62 | 2.73 |
| Scanning Performance | B | 3.88 | 3.38 |
| Backtesting Performance | AA | 4.38 | 3.38 |
| Trading Bot & Auto-Trading Reliability | A | 4.00 | 2.50 |
| AI & Algo Index | AA | 4.50 | 2.00 |
| Alert Speed | A | 4.00 | 3.67 |
| Trade Signal Quality | AAA | 5.00 | 0.00 |
| Broker Connectivity & Ecosystem Depth | C | 2.40 | 1.55 |
| Portfolio Tool Performance | C | 2.10 | 2.80 |
| Financial News Speed & Depth | C | 1.00 | 2.30 |
| Community Utility Index (CUI) | AAA | 4.75 | 3.25 |
| Support Infrastructure & SLA Audit | AA | 4.50 | 3.75 |
Tested using rating system v3.
See the 2026 v3. 58-point Trade Ideas test and benchmarks.
Pros
✔ 3 AI Trading Algorithms That Beat the Market
✔ Get A Free Holly AI Stock Trade Every Week
✔ Fully Automated Backtesting
✔ Exceptional Stock Scanning
✔ Specific Audited Trade Signals
✔ Auto-trading & broker integration
✔ Auto Trade Commission Free with eTrade integration
✔ Free Live Trading Room
Cons
✘ Old School User Interface
✘ No Mobile App

Trade Ideas is best for active US day traders seeking real-time AI-driven high-probability trades, excellent stock scanning, and a live trading room to learn trading techniques.
Trade Ideas is worth it if you are a pattern day trader trading at least three times daily with an account value of over $25K as this will help you profit after paying the Trade Ideas subscription cost.
Save 30% on Trade Ideas Premium
Our 4.52 ⭐ Rated AI-Day Trading Tool
☆ 25% Off All Other Plans ☆
Deal Ends In:
Key Features
| ⚡ Features ? | Charts, Watchlists, Screening |
| 🏆 Unique Features ? | AI Trade Signals, Trading Room, Trading Competitions |
| 🎯 Best for | US Day Traders |
| ♲ Subscription | Monthly, Yearly |
| 💰 Price | $89 | $178 |
| 🆓 Free Version | ✔ |
| 💻 OS | Web Browser, PC |
| 🎮 Trial | Free Live Trading Room |
| ✂ Discount | -15% Discount Code "LIBERATED" |
| 🌎 Region | USA |


What is Trade Ideas?
Founded in 2003, Trade Ideas is a web & desktop-based software platform for finding day trading opportunities. Historically specializing in real-time stock scanning, Trade Ideas now incorporates cutting-edge AI algorithms that backtest every stock in the USA & Canada for high-probability trading opportunities.
To understand the platform, we must first consider its pricing structure and what you receive for your investment.
Pricing Index
The lab data shows a clear “premium tax”: the tool is expensive relative to the feature bundle, even though the features themselves are incredibly strong.
Trade Ideas is objectively expensive on a cost basis. The value case depends on whether you actually use its real-time scanning and market outperforming signal stack, or use it as a general-purpose charting tool (where cheaper options dominate). To get true value you need to be a day trader acting on its signals.
| Test | Calculation | Trade Ideas | High | Median | Low |
|---|---|---|---|---|---|
| Cost-per-day | $/day on an annual plan. Minimum viable plan with real-time exchange data | $5.85 | $9.99 | $2.74 | $0.74 |
| $ per feature | Effective Monthly Cost /Total Features | $10.47 | $23.37 | $5.95 | $1.94 |
| Effective Monthly Cost (EMC) | EMC = (Plan price + required real-time data fees + any required add-ons) / month | $178.00 | $303.87 | $83.32 | $22.50 |
Trade Ideas’ Basic Plan costs $127/mo or $89/mo on an annual plan. It includes a live trading room, broker integration, streaming trade ideas, paper trading, and powerful scanning and charting. It excludes auto-trading and AI trading signals.
Although Trade Ideas Standard costs $127 per month, you can save $456 with an annual subscription, which costs $1,068 —a 25% discount.
The Premium Plan costs $254/mo or $178/mo on an annual plan, and adds AI trading signals, backtesting, customization, and auto trading. Trade Ideas Premium costs $254 per month, but you can save $912 by purchasing an annual subscription for $2136, a 25% discount.
Premium adds Trade Ideas’ “1st Gen AI Signals” (Holly) on top of everything in Basic, plus backtesting, Smart Risk Levels, the Channel Bar’s curated templates, and the RBI/GBI windows for popular intraday setups. Holly delivers ready-to-use trade ideas with defined entries and exits in real-time.
Trade Ideas Additional 15% Discount Coupon Code
Use My Trade Ideas Premium Plan Partner Discount Code “LIBERATED” to get an additional 15% discount ($320) off your first annual purchase.
Value Score (VP)
Value Score (VP) is where Trade Ideas justifies itself: 4.03 vs the 2.82 median, approaching the High benchmark (4.37). The message is clear: it’s expensive, but the feature set is unusually deep for active trading.
VP is built from Quality (feature scores), Breadth (feature richness), and Access (device coverage). In my workflow terms: “Do the features actually work well, are there enough of them to run a complete trading process, and can I access them where I trade?”
| Test | Calculation | Trade Ideas | High | Median | Low | Category Winner |
|---|---|---|---|---|---|---|
| Value Score (VP) | Sum of Feature Quality (60% Weight), Feature Depth (30%) & Device Support Depth (10%) | 4.03 | 4.37 | 2.82 | 1.70 | TradingView |
| Value Rank | Percentile Ranking | 4.50 | 5.00 | 2.50 | 1.00 | TradingView |
| Feature Quality | Average of All Feature Quality Ratings | 3.84 | 4.16 | 2.97 | 2.00 | TrendSpider |
| Feature Breadth | Feature richness (count of meaningful core features) | 17 | 17.00 | 12.00 | 9.0 | TradingView, Trade Ideas |
| Feature Depth | Percentile Ranking | 4.75 | 4.75 | 3.00 | 1.00 | Trade Ideas |
| Device Support Depth | Web 2 points, (PC, Android/iOS/ 1 Point each) | 3.00 | 5.00 | 2.00 | 1.00 | TradingView, TC2000 |
Speed & Ease of Use
Speed & Ease of Use scores 4.50, equal to the median of 4.50. The story here is not “slow platform”—it is “fast once loaded, heavier to start and learn.” Audit note (“slow Java startup; blazing fast once in memory”) aligns with the lab measurements.
Trade Ideas is solid but not elite on multi-chart latency and “frictionless UI” scoring. In my audit notes, the platform can feel slower at startup (Java footprint) but becomes fast once running—especially in active scanning workflows.
| Test | Calculation | Trade Ideas | High | Median | Low |
|---|---|---|---|---|---|
| Speed & Use Index Rating | Average of Time to Chart Performance, Multimonitor Chart Speed & 3 Click Rule: Ease of Use | 4.50 | 5.00 | 4.50 | 3.30 |
| Time to Chart Speed (Seconds) | Seconds from clicking the icon to a fully loaded chart with 200 price bars & 2 indicators. | 4.70 | 17.03 | 4.70 | 1.6 |
| Time to Chart Performance | Speed to Chart Points | 5.00 | 5.00 | 4.50 | 3.00 |
| Multi-Chart Latency (ms) | – | 292.00 | 667.00 | 209.00 | 10.0 |
| Multimonitor Chart Speed | Multi-Chart Sync Points | 3.50 | 5.00 | 3.50 | 0.00 |
| 3-Click Rule Test | Number of Clicks to place a trade or launch a scan | 3.00 | 6.00 | 3.00 | 2.0 |
| 3 Click Rule: Ease of Use | 3 Click Points (each click > 3 = 1 minus point | 5.00 | 5.00 | 5.00 | 2.00 |
| Speed & Ease of Use Test Winners | TradingView 5.00 | Stock Rover 5.00 | Seeking Alpha 5.00 |
Trade Ideas has two versions: a full-blown desktop platform and a lighter web version. The Trade Ideas web service can be accessed from any PC or Mac and contains most of the desktop platform’s functionality. Serious traders will want to download and install the desktop platform because it is endlessly configurable and multi-monitor-friendly.
When you first open Trade Ideas on your desktop, the software feels extremely clunky and unfriendly. Every element has its window, so if you want to resize the view, you need to resize all eight windows. This seems like a hassle at first and harkens back to the days of Windows 98.
But there is a good reason for this design. It offers endless flexibility and window configuration options when using multiple monitors and large screens. Also, even though they are fully separate windows, they can be linked and unlinked to provide a fluid experience.
However, the interface is undergoing a huge transformation, making it more interactive and gamified, which is a welcome improvement.
Chart Analysis Depth Index
Chart Analysis Depth scores 2.93, below the 3.17 median and far from the High benchmark (5.00). This confirms the product reality: Trade Ideas is scanner-and-signal first; charting is present but not the deepest module.
Trade Ideas is not trying to win “deep charting.” My audit notes characterize it as a scanner-first approach; charting exists, but it’s not the platform’s core advantage.
| Test | Calculation | Trade Ideas | High | Median | Low |
|---|---|---|---|---|---|
| Chart Analysis Depth Index | Average of Chart Depth, Indicator Depth & Custom Coding Scores | 2.93 | 5.00 | 3.17 | 0.50 |
| Chart Types | Total Count | 6.00 | 38.00 | 10.00 | 1.0 |
| Chart Depth | Chart Type Score 0.3 points per chart | 1.80 | 5.00 | 3.00 | 0.30 |
| Indicators | Total Count | 80.00 | 400.00 | 116.00 | 0.0 |
| Indicator Depth | Indicators Scores 0.025 points per indicator | 2.00 | 5.00 | 2.90 | 0.00 |
| Custom Indicator Coding | Available = 5 Points | 5.00 | 5.00 | 2.50 | 0.00 |
| Chart Analysis Depth Index Test Winners | TradingView 5.00 | MetaStock 5.00 | Optuma 5.00 |
Audit note (context): “Primarily an AI-driven scanner; charting is supplementary.”
The one area in which I felt let down was the ability to perform my own technical analysis. Most technical analysis software, backtesting, and charting platforms offer at least 50 different technical analysis tools. Trade Ideas does not play that game; it offers only volume, moving averages, VWAP, and trendlines.
The lack of indicators is not a good look for Trade Ideas compared to MetaStock, which offers over 300 indicators and drawing tools, or TradingView, with 160 indicators and chart types. To counter that argument, one could suggest that the design remit removes the need for you to perform your own technical analysis by running all the backtests and finding all the opportunities for you, which is unique.
In any case, a few more technical analysis tools would help improve the product.
| Technical Charting | Rank | Chart Types | Indicators |
| TradingView | #1 | 21 | 400 |
| MetaStock | #2 | 15 | 300 |
| TrendSpider | #3 | 12 | 140 |
| Finviz | #4 | 5 | 125 |
| Trade Ideas | #5 | 6 | 80 |
Chart Pattern Depth & Accuracy
This is a top-tier strength: 4.62 vs 2.73 median, close to the High benchmark (4.88). In workflows, this reduces false positives and speeds up filtering: pattern recognition becomes a practical scan dimension rather than a novelty label.
This is one of Trade Ideas’ standout areas. In my audit notes, a large portion of the pattern power is effectively “embedded into” Holly AI-style signal logic rather than presented as a pure chart-annotation experience.
| Test | Calculation | Trade Ideas | High | Median | Low |
|---|---|---|---|---|---|
| Pattern Recognition Efficacy & Accuracy | Average of Pattern Recognition Depth & Accuracy Scores | 4.62 | 4.88 | 2.73 | 0.00 |
| Total Patterns | Count of unique patterns recognized | 136.00 | 226.00 | 57.50 | 0.0 |
| Pattern Recognition Depth | 0.33 Points per pattern recognized | 4.49 | 5.00 | 1.90 | 0.00 |
| Candle Patterns Recognized | – | 85.00 | 172.00 | 20.00 | 0.0 |
| Chart Price & Trend Patterns Recognized | – | 51.00 | 54.00 | 16.00 | 0.0 |
| Accuracy | Percent Accurate | 95.00 | 95.00 | 89.00 | 0.0 |
| Pattern Recognition Accuracy | Accuracy Points 0.05 point per percent accurate | 4.75 | 4.75 | 4.48 | 0.00 |
| Chart Pattern Recognition & Accuracy Test Winners | TrendSpider 4.88 | Trade Ideas 4.62 | TradingView 3.98 |
In my lab testing, it recognized 136 total patterns, including 85 candle patterns and 51 chart price/trend patterns, with a tested accuracy of 95%.
The main reason Trade Ideas scores so well is that its pattern recognition is built into its AI-driven trade discovery workflow. My audit notes show that Trade Ideas includes 15 specific chart patterns plus more than 70 breakout patterns, integrated into its Holly AI trade-signal engine.
This makes its pattern recognition more actionable than a simple chart overlay: the patterns are used to help generate day-trading ideas, breakout alerts, and AI-ranked setups rather than just labeling shapes on a chart.
What makes Trade Ideas different is how those patterns are connected to real-time scanning, breakout logic, and Holly AI. Instead of forcing traders to manually inspect charts, Trade Ideas can surface pattern-based opportunities as part of live market scans and AI-ranked trade ideas.
That is especially useful for day traders because timing matters: a breakout pattern, reversal candle, or momentum continuation setup is only valuable if it appears quickly enough to act on. The platform’s combination of recognized chart patterns, breakout filters, AI strategy testing, and real-time alerting makes pattern recognition part of a complete trade-discovery workflow. In practice, this means Trade Ideas is not just telling you “a pattern exists”; it is helping prioritize which pattern-based setups may be worth attention right now.
Scanning Performance
Scanning Performance is strong: 3.88 vs 3.38 median. This is the “engine room” of Trade Ideas, and the granular metrics show why: sub-200ms scanning on an S&P 500 universe and meaningful filter depth.
Trade Ideas excels at real-time scanning, with fast S&P 500 multi-criteria scans. My audit notes emphasize day-trader-centric criteria depth (VWAP, support/resistance behavior, catalyst-style filters) rather than “broad everything” scanning.
| Test | Calculation | Trade Ideas | High | Median | Low |
|---|---|---|---|---|---|
| Market Scanning Latency & Depth | Average of Scanning Speed, Criteria & Customer Code Scores | 3.88 | 5.00 | 3.38 | 0.80 |
| Scanner Performance (ms) | Milliseconds to search the entire S&P 500 across 5 different criteria. | 208.00 | 2500.00 | 300.00 | 7.0 |
| Scanning Speed (ms) | Scanner Performance Points | 4.00 | 5.00 | 4.00 | 1.00 |
| Scanner Auto-Refresh Rate (seconds) | Auto-Refresh Speed(Not Scored) | 1.00 | 60.00 | 1.00 | 0.0 |
| Scanning Criteria & Depth | Total Criteria Count | 210.00 | 675.00 | 200.00 | 30.0 |
| Scanning Criteria & Depth | Scanning Criteria 0.0125 points per criteria | 2.63 | 5.00 | 2.50 | 0.80 |
| Custom Code Scanning | Exists 5 Points | 5.00 | 5.00 | 5.00 | 0.00 |
| Scanning Performance Test Winners | Stock Rover 5.00 | TradingView 4.83 | TrendSpider 4.67 |
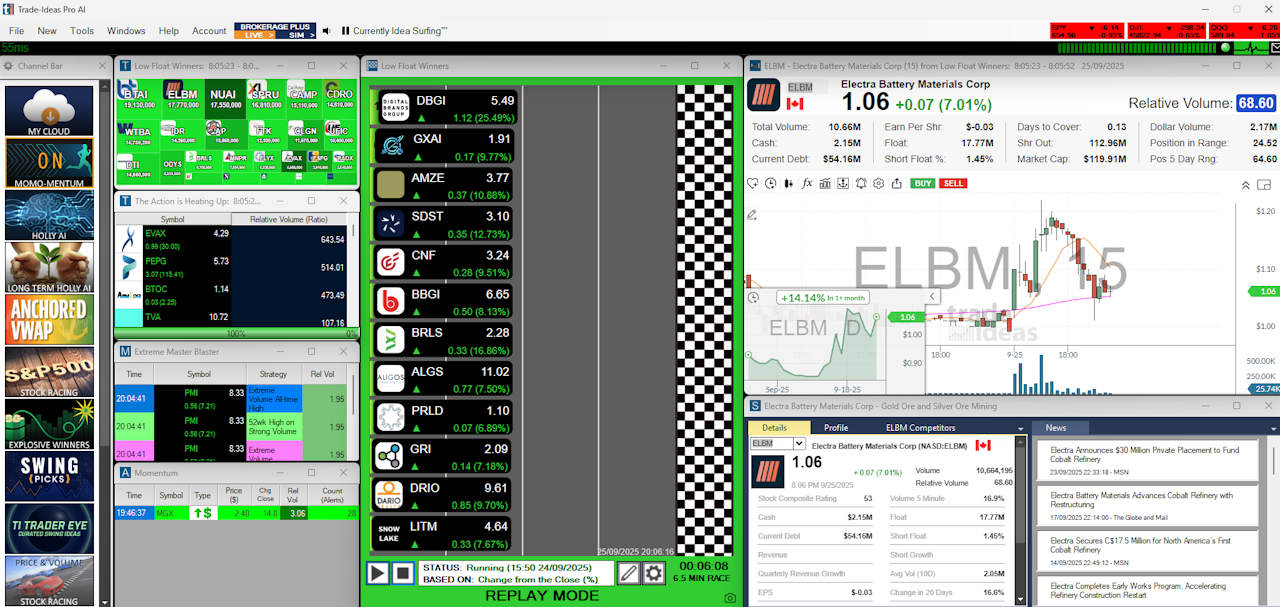
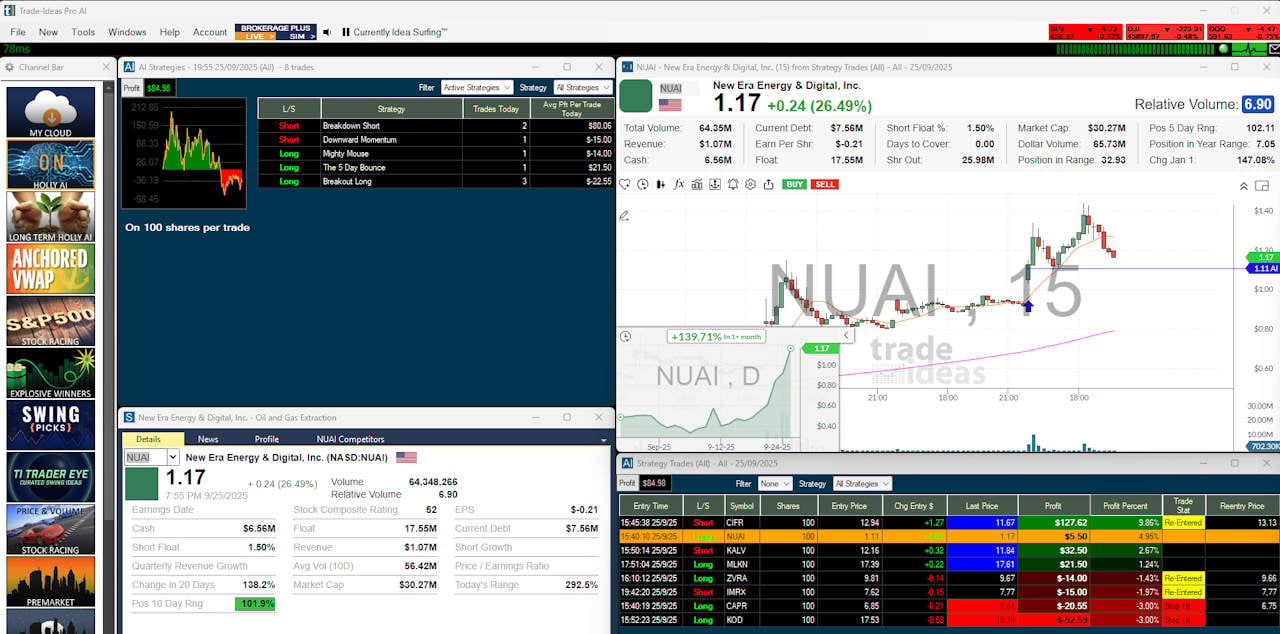
Trade Ideas Channels
Trade Ideas offers over 30 curated channels that highlight theme-based trading opportunities the team believes present outsized profit potential. The channels cover social media buzz, earning opportunities, and multiple industry plays.
Above, you can see many of the Trade Ideas channels, each with a unique, custom view tailored to the trading situation. Channels include Holly AI, Anchored VWAP, S&P 500 VWAP, Swing Picks, Price and Volume, Premarket, and After Hours.
Backtesting Performance
Backtesting is a major differentiator: median of 4.38 vs 3.38, close to High (4.90). The key is not just speed—it’s the combination of no-code backtesting, flexible coding, basket testing, andreporting.
Trade Ideas is legitimately strong here: no-code backtesting, flexible strategy logic, and basket testing all score at the ceiling. The main trade-off is speed versus the absolute fastest engines (and, depending on your workflow, you may prioritize its “regime-adaptive” simulation approach over raw milliseconds).
| Test | Calculation | Trade Ideas | High | Median | Low |
|---|---|---|---|---|---|
| Quantitative Backtesting Fidelity | Average of Backtesting Speed, No Coding Required, Flexible Coding, Report Quality & Multi-Stock Backtesting Scores | 4.38 | 4.90 | 3.38 | 0.00 |
| Backtesting Speed (ms) | Time required to run a strategy simulation over 10 years of daily data or 2 months of 5-minute data (milliseconds) | 929.00 | 6000.00 | 302.00 | 7.0 |
| Backtesting Speed | Backtesting Speed Points | 4.00 | 5.00 | 4.25 | 0.00 |
| No Coding Required | Zero Code Backtesting 5 Points | 5.00 | 5.00 | 5.00 | 0.00 |
| Flexible Coding Backtesting | Exists = 5 points | 5.00 | 5.00 | 5.00 | 0.00 |
| Backtesting Report Quality | Backtesting Report Quality Percent | 70.00 | 100.00 | 70.00 | 0.0 |
| Backtesting Report Quality | % of total reporting criteria available. 0.05 points per 1% | 3.50 | 5.00 | 2.25 | 0.00 |
| Multi-Stock Basket Backtesting | If Exists 5 Points | 5.00 | 5.00 | 5.00 | 0.00 |
| Backtesting Performance Test Winners | Optuma 4.94 | TrendSpider 4.88 | MetaStock 4.81 |
The Trade Ideas platform has a powerful, easy-to-use backtesting system that requires no programming knowledge. A point-and-click backtesting system is rare in this industry; the only other software with this capability is TrendSpider.
I ran many backtests with Trade Ideas, but the one I wanted to focus on was the “Unusual Social Mentions Scan”; it is a good test of the wisdom of crowds.
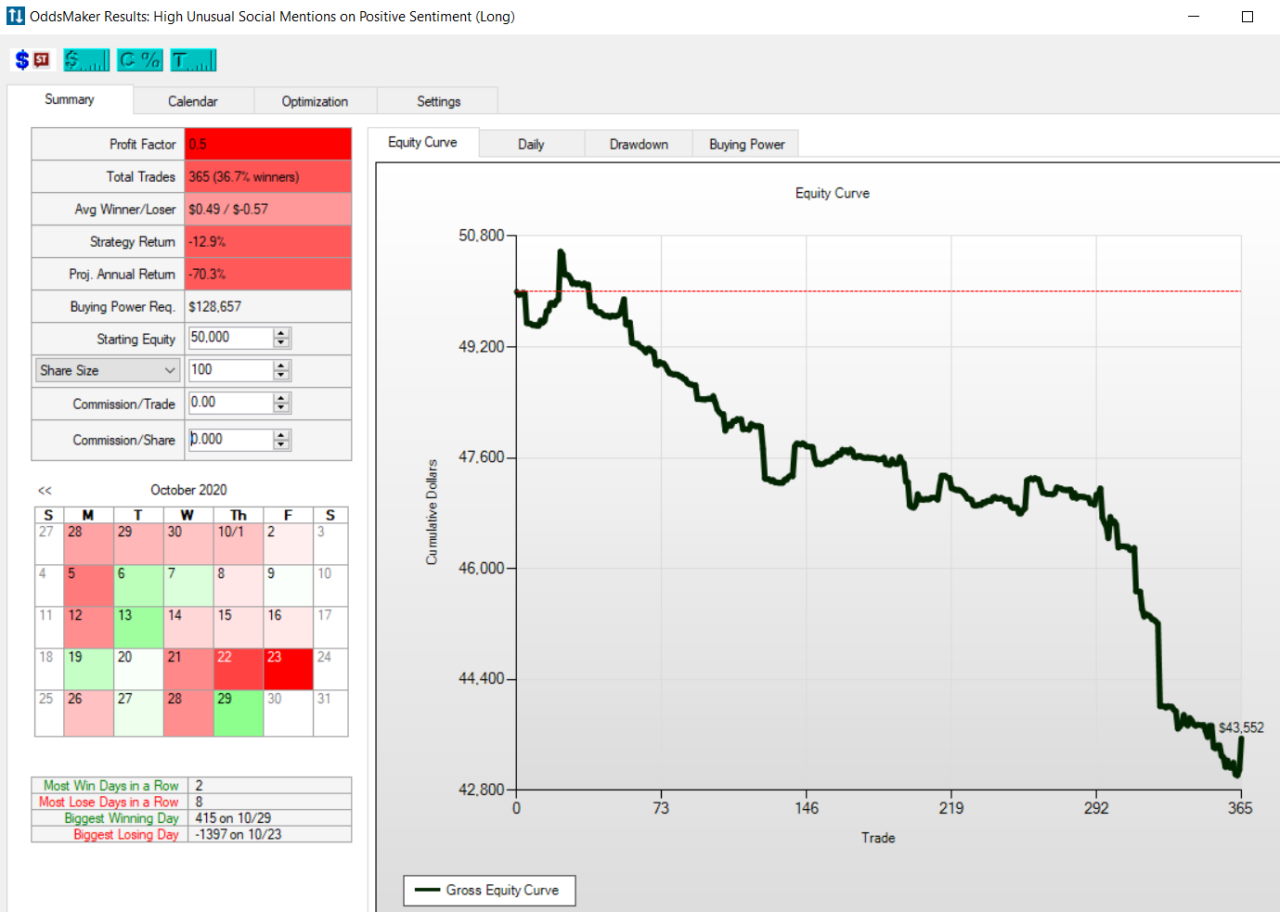
I wanted to focus on was a backtest of the “Unusual Social Mentions Scan”. This is a good test of the wisdom of crowds.
As you can see in the backtest results above, the crowds are not very wise, as the system loses 70% per year. This helps me draw three conclusions.
- Do not listen to people on social media.
- Trade Ideas provides excellent, unique insight into stock market crowd sentiment.
- You may have a winning system if you do the opposite of what people suggest on StockTwits.
| Tool | Backtesting | No-Code Backtesting | Auto-Trading | Ranking |
|---|---|---|---|---|
| Trade Ideas | ✔ | ✔ | ✔ | #1 |
| TrendSpider | ✔ | ✔ | ✔ | #1 |
| TradingView | ✔ | ✘ | ✔ | #2 |
| Stock Rover | ✔ | ✘ | ✘ | #3 |
| MetaStock | ✔ | ✘ | ✘ | #3 |
Trading Bot & Auto-Trading Reliability
Auto-trading reliability scores 4.00 vs 2.50 median, which is a meaningful edge. The breakdown shows why: Trade Ideas earns full points for both the automation path and sophistication, then is constrained by a lack of a published SLA/credits/uptime promise in my audit.
Trade Ideas explicitly supports broker-linked execution via Brokerage+ and provides connection instructions for Interactive Brokers and E*TRADE.
| Test | Calculation | Trade Ideas | High | Median | Low |
|---|---|---|---|---|---|
| Automated Execution & Bot Reliability | Sum of Automation Path, Strategy/Bot Sophistication, Operational Assurance Points | 4.00 | 4.50 | 2.50 | 0.00 |
| Automation Path | Automation Path (0.0–2.0) | 2.00 | 2.00 | 1.00 | 0.00 |
| Strategy/Bot Sophistication | Strategy/Bot Sophistication (0.0–2.0) | 2.00 | 2.00 | 1.50 | 0.00 |
| Operational Assurance | Operational Assurance (0.0–1.0) | – | 1.00 | 0.00 | 0.00 |
| Bot & Auto-Trading Reliability Test Winners | TrendSpider 4.50 | Trade Ideas 4.00 | Tickeron 4.00 |
Trade Ideas scores very high on automation path + sophistication, consistent with my audit notes about Brokerage Plus enabling broker-connected automation workflows. The gap is operational assurance: I did not record an explicit public SLA/credit-style uptime promise for Trade Ideas in the notes used for this dataset.
AI & Algo Index
Trade Ideas earns 4.50 vs 2.00 median, one of the widest gaps in the entire benchmark set. In practical terms, it is not simply a scanner with “AI marketing.” It is built around AI-driven strategy generation and signal delivery (Holly AI is positioned as a core premium feature).
This is consistent with Trade Ideas’ market positioning: “AI-driven strategies and signals” are sold as a premium layer.
| Test | Calculation | Trade Ideas | High | Median | Low |
|---|---|---|---|---|---|
| Algorithmic Intelligence & AI Tier Index | Sum of Algo Depth, AI Layer & Transparency Points | 4.50 | 5.00 | 2.00 | 1.00 |
| Algo Depth | Algo Depth (0.0–2.0) | 2 | 2.00 | 1.50 | 1.0 |
| AI Layer | AI Layer (0.0–2.0) | 1.5 | 2.00 | 0.00 | 0.0 |
| Transparency | Transparency (0.0–1.0) | 1 | 1.00 | 1.00 | 0.0 |
| AI & Algo Index Test Winners | TrendSpider 5.00 | Trade Ideas 4.50 | Tickeron 4.50 |
The Trade Ideas Holly AI algorithms are the software’s biggest benefit for day traders. The Pro AI system has three AI bots: Holly, Holly 2.0, and Holly Neo. The Holly AI bots represent the most innovative trading AI available to retail investors today.
I had a lengthy Zoom session with Sean McLaughlin, Senior Strategist over at Trade Ideas, to delve into how their AI works, and I was very impressed. This company is laser-focused on providing traders with the best data-supported trading opportunities.
Holly is 3 AI Systems Applying Over 70 Strategies with Differing Risk Levels.
Holly AI
Holly AI applies 70 different strategies to all the stocks on the US stock exchanges; 70 strategies multiplied by 8,000+ stocks mean millions of backtests daily.
Only strategies with a backtested win rate of over 60% and an estimated risk-reward ratio of 2:1 will be suggested as potential trades the following day.
Holly 2.0
Holly 2.0 is a more aggressive version of Holly AI, presenting more aggressive day trading scenarios for you to select. Trade Ideas operates three key trading styles with each AI algorithm: conservative, moderate & aggressive. Holly 2.0 is aggressive.
Holly Neo
Holly NEO is a newer AI that seeks to trade real-time chart patterns. It utilizes a mix of long and short trades based on stock price pullbacks and breakouts.
- Pullback Long: This strategy identifies trades in which the stock price is down and seeks to move up on higher volume.
- Breakout Long – Stock price breaks out through a key resistance or to new highs.
- Pullback Short – identifying a short pullback opportunity in price.
- Breakdown Short – a shorting opportunity where upward momentum breaks down.
Alert Speed
Alert performance is strong: 4.00 vs 3.67 median. The nuance is that Trade Ideas is exceptional on concurrency and streaming, but weaker on “alert stream richness” relative to the benchmark rubric.
Trade Ideas documents email/SMS delivery for Alert Window alerts (beta), with explicit constraints (limited symbols and message frequency).
| Test | Calculation | Trade Ideas | High | Median | Low |
|---|---|---|---|---|---|
| Alert Trigger Latency & Delivery Speed | Average of Concurrent Alerts, Alert Streams Richness & Alert Speed Rating Scores | 4.00 | 4.67 | 3.67 | 2.30 |
| Concurrent Alerts | How many concurrent alerts (1 point per 50, to a max of 5 points) | 5.00 | 5.00 | 5.00 | 5.00 |
| Concurrent Alert Count | – | Unlimited | 2000.00 | 875.00 | 400.0 |
| Alert Streams Richness | Email, webhook, SMS, app alert. 1 point per stream, max 5 points. | 2.00 | 5.00 | 2.00 | 1.00 |
| Alert Speed Rating | – | 5.00 | 5.00 | 3.00 | 1.00 |
| Alert Speed Test Winners | TradingView 4.67 | TrendSpider 4.33 | Benzinga Pro 4.33 |
Trade Signal Quality
Trade Signal Quality is the headline: 5.00 vs 0.00 median. Most competitors either do not deliver audited, specific trade signals as a core product or offer only generic gauges. Trade Ideas is structurally different: AI-driven signals and strategy outputs are central to the Premium value proposition.
| Test | Calculation | Trade Ideas | High | Median | Low | Category Winner |
|---|---|---|---|---|---|---|
| Signal Alpha & Predictive Efficacy | Rating | 5.00 | 5.00 | 0.00 | 0.00 | Trade Ideas, Tickeron, Stock Rover, Motley Fool, Seeking Alpha |
This is a clear strength. My audit framing for Trade Ideas is that signals are not an accessory feature—they are the product, tightly connected to scanning and regime-based strategy selection.
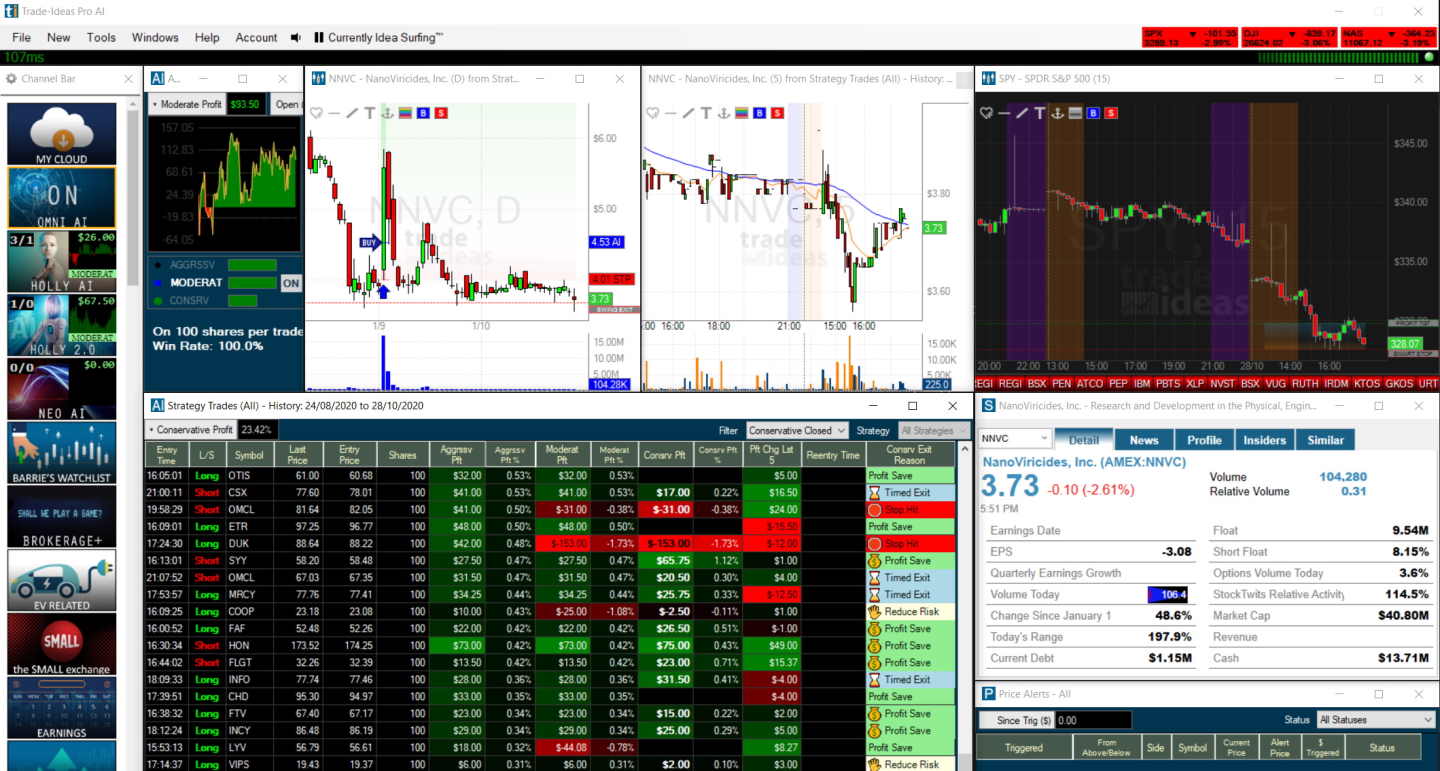
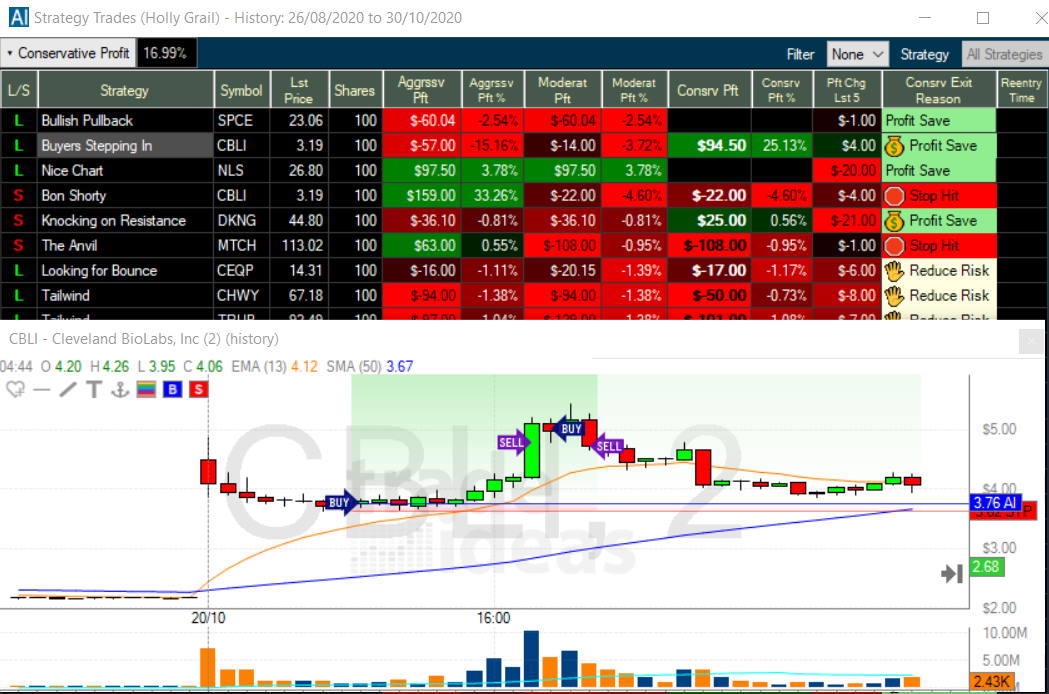
Buy & Sell Signals
While testing Trade Ideas, I was impressed by how Holly AI visually shows every buy and sell signal on a chart. The charts display both in-play and historical trades, making it easy to understand the strategy and potential.
I have highlighted a trade Holly AI (Holly Grail) recommended in the chart below. This trade for Cleveland Biolabs (Ticker: CBLI) made a 25% profit within 4 hours. Not how the buy and sell signals are depicted on the chart.
Holly AI
Trade Ideas Holly AI services institutions and retail investors, recommending 3 to 10 trades per day, lasting from a few minutes to a few hours. Holly AI returns at least 20% per year without leverage and has beaten the market over the last three years.
- Trade Ideas has large institutional clients and is a legitimate business.
- Trade Ideas recommends about 3 to 10 trades per day.
- Each trade duration is from a few minutes to a few hours.
- You must be an active day trader to take advantage of Trade Ideas.
- Trade Ideas returns approximately 20% per year.
- Trade Ideas has beaten the S&P 500 over the last 4 years.
- You must be able to go short and long to take advantage of the trading strategies.
- Depending on your leverage, trading style, and the trades you take, you could make more than 20% or even incur a loss.
- You must hold a minimum balance of $25K in your brokerage account to actively pattern day trade in the USA.
Holly AI Performance
Upon downloading and analyzing 65 days of trades, I can confirm the performance numbers claimed by Trade Ideas. Trade Ideas Holly AI’s performance is publicly available and impressive.
To assess a system’s performance, one must compare it to an underlying benchmark. Holly Grail AI has outperformed the S&P 500 by 10% since 2019, and Holly 2.0 beat the market by 31%.
| Holly AI Performance | Starting Capital Jan 2019 | Ending Capital Oct 2020 | Total Return | % Per Year |
| Holly Grail (AI) | $50,000.00 | $71,186.00 | 42% | 23% |
| Holly 2.0 | $50,000.00 | $80,510.00 | 61% | 33% |
| Holly Neo | $50,000.00 | $71,186.00 | 42% | 23% |
| S&P 500 | $50,000.00 | $66,000.00 | 32% | 17% |
Table: Independent Performance Audit: Comparing $50,000 invested in the S&P 500 versus day trading with Trade Ideas.
Interestingly, Holly did not suffer the huge losses incurred in the S&P 500 during the Corona Crash from March to April 2020 or 2022.
Broker Connectivity & Ecosystem Depth
Broker Connectivity scores 2.40 vs 2.00 median—above average but still not strong —and the weakest sub-score is “Broker Integration.” The product reality is: Trade Ideas supports broker-linked workflows (notably via Brokerage+), but it is not a broad multi-broker ecosystem.
Trade Ideas publishes Brokerage+ connection guidance for Interactive Brokers and E*TRADE, and also clarifies some feature limitations on the web version.
| Test | Calculation | Trade Ideas | High | Median | Low |
|---|---|---|---|---|---|
| Asset & Data Coverage Index | Average of Live Trading, Broker Integration, Asset & Data Coverage Scored | 2.40 | 5.00 | 2.00 | 0.67 |
| Live Trading | 5 Points | 5.00 | 5.00 | 5.00 | 0.00 |
| Total number of brokers integrated | Count | 2 | 1200.00 | 2.00 | 0.0 |
| Broker Integration | 0.1 point for every 1 broker to max 5 points | 0.20 | 5.00 | 0.20 | 0.00 |
| Asset & Data Coverage | Stocks, Options, FX, USA Exchanges, International Exchanges – 1 Point Each | 2.00 | 5.00 | 2.00 | 2.00 |
| Broker Connectivity & Ecosystem Test Winners | TradingView 5.00 | MetaTrader 5.00 | TrendSpider 4.43 |
Trade Ideas supports live trading, but its integration footprint is narrower than that of platforms that act as broad broker hubs. In my audit notes, it’s best understood as “high-performance signal + execution for a limited set,” not “connect to everything.”
Trade Ideas integrates with Interactive Brokers, E*TRADE, and eSignal. The Brokerage Plus functionality is available with the Standard and Premium services. Trade signals generated by Holly AI cannot be autotraded. Still, alert window scans can be auto-executed in a sandbox or live with your brokerage using Brokerage Plus (available in the premium plan).

| Tools | Autotrading Bot Integration | Brokers Integrated | Exchanges | Ranking |
| Trade Ideas | ✔ | 3 | USA | #1 |
| TradingView | ✘ | 50 | Global | #1 |
| TrendSpider | ✔ | 5 | USA | #2 |
| MetaStock | ✘ | 0 | Global | #4 |
Table: Trade Ideas vs. The Competition – Broker Integration
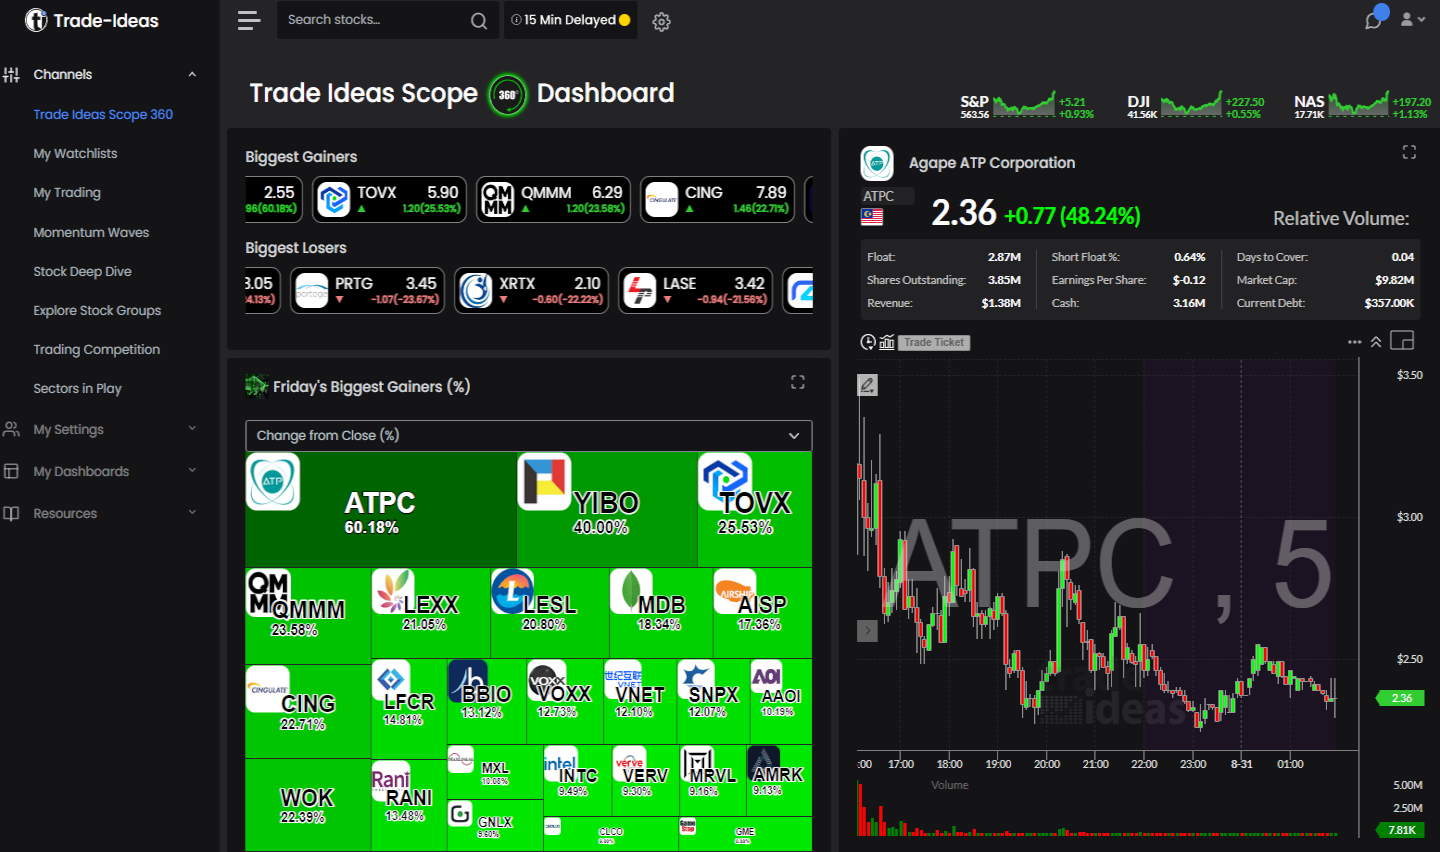
The Trade Ideas scanner is at the heart of the system and uniquely provides access to over 40 innovative market scans. These scans include long and short strategies, volume breakouts, premarket price moves, and price pivot action.
By clicking New -> Alerts, you can access the Alert Config Window, which gives you immediate access to over 40 trading scans. The screenshot below shows all the built-in scans categorized into Bullish, Bearish, or Neutral. Depending on the overall market direction, you can easily select a potential strategy for the day.
One scan I find particularly impressive is the “Unusual Social Mentions Scan.” The Trade Ideas AI engine constantly scans StockTwits for surges in mentions of particular stocks. If you click “Load Settings,” you will be presented with a list of trending stocks on social media. Of course, you can customize any of the scans featured here or create your alerts from scratch.
Financial News Speed & Depth
Financial News scores 1.00 vs. the medianof 2.30, a clear weakness within the rubric you defined. The key nuance: the dataset shows Trade Ideas can be fast on “news scanning,” but the broader “news depth” feature checklist (chart overlays, watchlist news, provider depth, news alerts, filtering) is where it loses points.
| Test | Calculation | Trade Ideas | High | Median | Low |
|---|---|---|---|---|---|
| Financial News Speed & Quality Rating | 100% Weight – 5 points | 1.00 | 5.00 | 2.30 | 0.00 |
| Financial News Speed & Depth Test Winners | MetaStock 5.00 | Benzinga Pro 5.00 | Scanz 5.00 |
Trade Ideas can be fast on headline appearance (my audit notes frame it as day-trader-optimized), but your scoring rubric weights “news infrastructure depth” (providers, filtering, alerts, watchlist linkage), where dedicated news terminals/products dominate.
Community Utility Index (CUI)
Community Utility is excellent: 4.75 vs 3.25 median, close to High (5.00). For complex trading software, community quality isn’t fluff—it directly reduces onboarding time and increases repeatability through shared configurations and playbooks.
| Test | Calculation | Trade Ideas | High | Median | Low |
|---|---|---|---|---|---|
| Community Utility Index | Average of Active Community Size & Quality of Community Contribution Scores | 4.75 | 5.00 | 3.25 | 1.80 |
| Active Community Size | Active Users rating | 4.50 | 5.00 | 3.00 | 2.00 |
| Quality of Community Contribution | Quality of IP rating | 5.00 | 5.00 | 3.50 | 1.50 |
| Community Utility Index Test Winners | TradingView 5.00 | MetaTrader 5.00 | Trade Ideas 4.75 |
Trade Ideas scores extremely well because the community is “trading room” driven. Traders meet every day to learn and trade together. In my audit notes, this is less about social posting and more about high-quality IP.
Support Infrastructure & SLA Audit
Support scores 4.50 vs 3.75 median. For a platform with automation and complex scanning logic, support quality directly reduces operational downtime and “false bug” time sinks.
| Test | Calculation | Trade Ideas | High | Median | Low |
|---|---|---|---|---|---|
| Support SLA Audit: Time-to-Human Benchmarks | Average of Support Communication Channels & Support Response Time Scores | 4.50 | 5.00 | 3.75 | 1.00 |
| Support Communication Channels | Communication Channels rating | 4.00 | 5.00 | 3.50 | 1.00 |
| Support Response Times | Response Times rating | 4.00 | 5.00 | 4.00 | 1.00 |
| Support Infrastructure & SLA Audit Winners | TrendSpider 5.00 | TC2000 5.00 | ThinkorSwim 4.75 |
So what? If Trade Ideas is mission-critical to your day trading, above-median support is a real risk reducer. If you use it casually, you’ll still appreciate the training ecosystem, but you won’t fully realize the benefit.
Trading Room
I have often joined the Trade-Ideas trading room; skilled trader Barrie Einarson is the moderator and will answer any of your questions. Barrie also shares his screen so you can see his trades, see how he trades, and learn from him. Many trading rooms can cost you a lot more than the entire Trade Ideas Pro subscription, which is an extremely valuable part of the value proposition.
Compare to Similar Products
Our tests compare Trade Ideas versus TrendSpider, MetaStock, and TradingView. Trade Ideas is the best for black box AI-driven day trading. TrendSpider is better for automated stock chart analysis, backtesting, and automated trading. Stock Rover is better than Trade Ideas for long-term investors. Benzinga Pro is a better alternative for trading real-time news. If you are looking for a free and effective screening tool, Finviz beats Trade Ideas.
| Features | Trade Ideas | TrendSpider | TradingView | MetaStock |
| Rating | 4.7★ | 4.8★ | 4.8★ | 4.4★ |
| Pricing | $89 | $178 | $54 | $214 | $0 | $15 | $35 | $70 | $100 | $265 |
| Global Market Data | USA | USA | ✔ | ✔ |
| Black Box AI Algorithms* | ✔ | ✘ | ✘ | ✘ |
| Powerful Charts | ✔ | ✔ | ✔ | ✔ |
| Stocks | ✔ | ✔ | ✔ | ✔ |
| Futures | ✘ | ✔ | ✔ | ✔ |
| Forex | ✘ | ✔ | ✔ | ✘ |
| Cryptocurrency | ✘ | ✔ | ✔ | ✘ |
| Social Community | ✔ | ✘ | ✔ | ✘ |
| Real-time News | ✘ | ✘ | ✘ | ✔ |
| Screeners | ✔ | ✔ | ✔ | ✔ |
| Backtesting | ✔ | ✔ | ✔ | ✔ |
| Code-Free Backtesting | ✘ | ✔ | ✘ | ✘ |
| Automated Analysis | ✔ | ✔ | ✔ | ✔ |
Is Trade Ideas Legit?
Trade Ideas is a professional company that has been developing strategies to enable traders to beat the market for nearly two decades. Trade Ideas is worth the subscription if:
- You are an active day trader.
- You want to become a full-time day trader.
- You can maintain a minimum trading account balance of $25,000 (if you are a US resident).
- You want to have the power of AI on your side to beat the market.
FAQ
How to get a discount on Trade Ideas?
As a Trade Ideas partner, we have negotiated a 40 percent discount for our readers; simply use the coupon code "LIBERATED" at checkout for an instant 40 percent saving on your first year's subscription.
Does Trade Ideas have level 2 data?
Yes, Trade Ideas provides access to real-time Level 2 data. By subscribing to its Pro subscription plan, you can gain access to streaming quotes and depth of market for stocks traded in the U.S. markets, allowing you to see the full order book of buy and sell orders and track market movements in real time.
Can I use Trade Ideas to find diverging stocks?
Yes, Trade Ideas can be used to find diverging stocks. For example, its MFI Divergence scanner finds stocks diverging with the money flow indicator. Additionally, there is an RSI Divergence scanner for stocks diverging from the Relative Strength Index indicator.
Can Trade Ideas send a text alert?
Yes, Trade Ideas can send text alerts via SMS or email when certain criteria are met. For instance, users can send alerts when a stock crosses over a certain price point or based on technical indicators and strategies.
Does TD Ameritrade partner with Trade Ideas?
No, TD Ameritrade is not currently partnered with Trade Ideas. It is possible to link TD Ameritrade's Think or Swim app to the Trade Ideas app, but that is not the same as a partnership.
Does Think or Swim work with Trade Ideas?
It is possible to get Think or Swim working with Trade Ideas. Open both apps with administrator privileges, then in Trade Ideas, go to Tools > Externally Link > Select The Ticker Box in Think or Swim. Both apps should know loosely work together.
Does Trade Ideas show futures?
Trade Ideas does not work with futures contracts as it is primarily designed for stock trading in the major US exchanges.
Can I use Trade Ideas for automated trading?
Yes, Trade Ideas can be used for automated trading. It offers a variety of tools and strategies that allow users to set custom parameters and create automated trading systems. Additionally, Trade Ideas can be integrated with third-party brokers like Interactive Brokers and ETrade to execute trades automatically.
Does Trade Ideas offer customer support?
Yes, Trade Ideas offers customer support via email and telephone. The company also has an extensive knowledge base with tutorials and helpful articles.
Is the Trade Ideas Scanner Free?
No, the Trade Ideas scanner is not free. Trade Ideas is a premium paid-for subscription service. However, you can try the Trade Ideas Trading Room for free or get a free Holly AI stock trade every week in your inbox.
How much is Trade Ideas?
Trade Ideas offer a Standard Plan that costs $118/mo or $999/year, including a live trading room, streaming trade ideas, and powerful scanning and charting. The Premium plan costs $228/mo or $1999/year, adding precise trade signals, 3 AI bots, and auto trading.