My verified trading software partner discounts are live: TradingView 17% off, TrendSpider 45%, Trade Ideas 28%, Stock Rover 25%, and Seeking Alpha 21% off. Grab your deal now!
| Jump Directly to the Deal | Test Rating | Best for: |
|---|---|---|
| TradingView 17% | Yearly plan | 4.8⭐ | Charts, Screening, Community, Globally |
| TrendSpider 45% | Yearly plan + Code (see below) | 4.8⭐ | Automated Analysis & AI Trading USA |
| MetaStock | 3-for-1 Deal | 4.4⭐ | Global Realtime New & Technical Analysis |
| Tickeron 50% | Yearly Plan | 4.4⭐ | AI Portfolios & Research USA |
| Trade Ideas 25% | Code (see below) | 4.7⭐ | Profitable AI Day Trading Signals USA |
| Stock Rover 25% | with Premium Trial | 4.8⭐ | Value, Dividend & Growth Investors USA |
| Seeking Alpha 21% | Preium & Alpha Picks Bundle | 4.7⭐ | Alpha Picks High Performance Stock Selection |
| Benzinga Pro 37% | Code SMARTER | 4.6⭐ | Cost-Effective Real-Time Trading News |
| Finviz 37% | Yearly Plan | 4.3⭐ | Fast Screening & Charting USA |
LiberatedStockTrader can offer special discounts because we have verified partnerships with the best names in the stock trading software industry.
1. TrendSpider 45% Partner Discount
Save 38% on TrendSpider
Our 4.72 ⭐ Rated Trading Tool
✅ Automated Charts & Research
✅ Scanning & Auto-Trading
✅ AI Benchmark Winner
Deal Ends In:
My research reveals that TrendSpider is an excellent choice for US traders seeking AI-driven tools for charting, pattern recognition, and backtesting across stocks, indices, futures, and currencies. The platform stands out by automatically detecting trendlines, Fibonacci levels, and candlestick patterns. With its robust backtesting capabilities and multi-timeframe analysis, TrendSpider is particularly well-suited for seasoned technical traders looking to refine their strategies.
| Test | Tier | Score | Average |
|---|---|---|---|
| Composite Lab Performance Score | AAA | 4.72 | 4.21 |
| Pricing Index: $ per Day | A | $2.70 | $2.74 |
| Value Score (VP) | A | 4.17 | 2.82 |
| Speed & Ease of Use | AA | 4.67 | 4.50 |
| Chart Analysis Depth Index | A | 4.03 | 3.17 |
| Chart Pattern Depth & Accuracy | AAA | 4.88 | 2.73 |
| Scanning Performance | AA | 4.67 | 3.38 |
| Backtesting Performance | AAA | 4.88 | 3.38 |
| Trading Bot & Auto-Trading Reliability | AA | 4.50 | 2.50 |
| AI & Algo Index | AAA | 5.00 | 2.00 |
| Alert Speed | AA | 4.33 | 3.67 |
| Trade Signal Quality | C | 0.00 | 0.00 |
| Broker Connectivity & Ecosystem Depth | AA | 4.43 | 1.55 |
| Portfolio Tool Performance | C | 2.10 | 2.80 |
| Financial News Speed & Depth | AA | 4.50 | 2.30 |
| Community Utility Index (CUI) | B | 3.75 | 3.25 |
| Support Infrastructure & SLA Audit | AA | 4.50 | 3.75 |
Tested using rating system V3.
See the 2026 v3 58-point TrendSpider test and benchmarking.
Pros
✔ 150+ chart and candle patterns recognized
✔ True AI Model Training & Deployment
✔ AAA Point-and-click backtesting
✔ Auto-trading bots
✔ Multi-timeframe analysis
✔ Real-time data included
✔ US Stocks, ETFs, Forex, Crypto, & Futures
✔ Seasonality charts, options flow
✔ News & analyst ratings change scanning
✔ 1-on-1 training included
Cons
✘ Not ideal for value or dividend investors
✘ No social community or copy-trading
✘ Limited portfolio management tools

TrendSpider stands out by leveraging AI and machine learning to streamline traders’ workflow, bringing automated trend and pattern recognition to the forefront. With TrendSpider, traders gain access to advanced analysis and strategy-testing capabilities, surpassing manual efforts in both scale and efficiency.
| ⚡ Features ? | Charts, Watchlists, Screening, Free Real-time Data |
| 🏆 Unique Features ? | AI Automated Trendlines, Fibonacci, Candlestick Pattern Recognition, Auto-Bot Trading, Code-free Powerful Backtesting, Launch and Train Personal AI Models with Strategy Lab. |
| 🎯 Best for | Stock, Options, FX & Crypto Traders |
| ♲ Subscription | Monthly, Yearly |
| 💰 Price | $54 | $214 |
| 💻 OS | Web Browser |
| 🎮 Trial | ❌ |
| ✂ Discount | Code "LST30" for 30% to 63% Off |
| 🌎 Region | USA |
TrendSpider is the powerhouse of chart trading software. It’s best for traders seeking cutting-edge AI software that automates technical chart analysis, trendlines, and pattern recognition. TrendSpider features a robust system for backtesting and automated recognition of Fibonacci and candlestick patterns across stocks, ETFs, FX, and Crypto markets.

TrendSpider is a leading stock charting software packed with innovative technical analysis tools. If you are a serious market analyst, TrendSpider will help you do the job quicker and with better quality and help you not miss an opportunity.
Automated trendline detection and plotting perform better than a human can; using algorithms, the system can detect thousands of trendlines and flag the ones with the highest backtested probability of success. Read the TrendSpider Test & Rating.
2. Trade Ideas 28% Partner Discount

Save 30% on Trade Ideas Premium Annual Plan
Our 4.52 ⭐ Rated AI-Day Trading Tool
☆ 25% Off All Other Plans ☆
Deal Ends In:
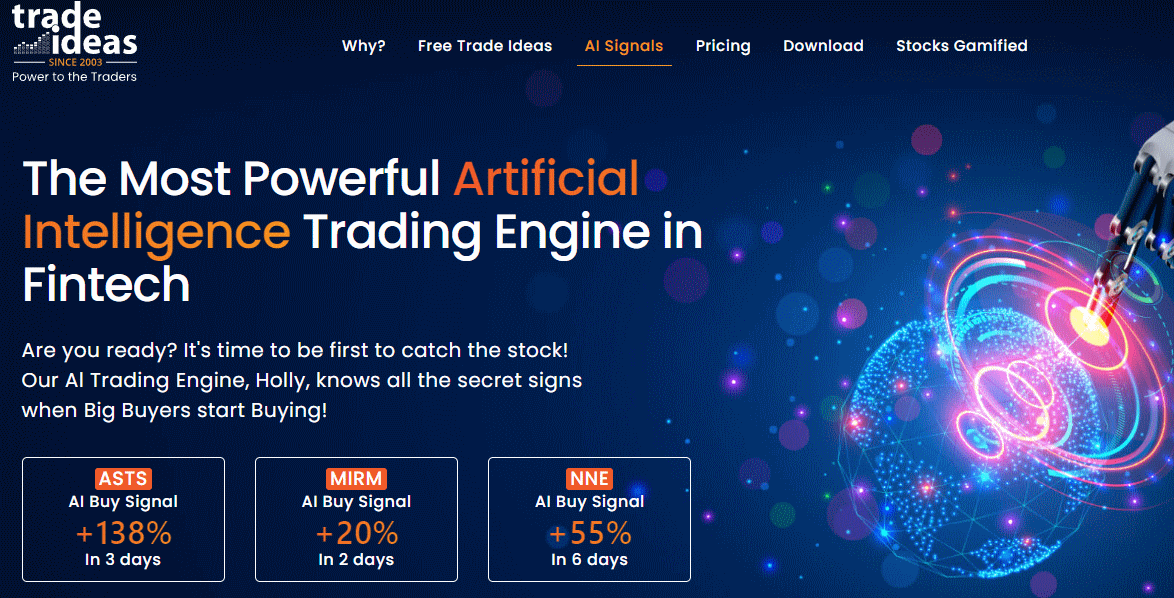
Trade Ideas is best for active day traders wanting AI-driven black-box trading signals. Trade Ideas provides actual buy and sell signals for trades by performing millions of backtests daily on 70+ strategies. The Holly AI platform has an audited track record of beating the market.
My in-depth testing shows that Trade Ideas is the ultimate black-box, AI-powered day-trading signal platform with built-in automated bot trading. Three automated Holly AI systems pinpoint trading signals for day traders. Trade Ideas promises and delivers market-beating returns.
| Test | Tier | Score | Average |
|---|---|---|---|
| Lab Test Composite Score | AA | 4.52 | 4.21 |
| Pricing Index: $/day | A | $5.85 | $2.74 |
| Value Score (VP) | A | 4.03 | 2.82 |
| Speed & Ease of Use | AA | 4.50 | 4.50 |
| Chart Analysis Depth Index | C | 2.93 | 3.17 |
| Chart Pattern Depth & Accuracy | AA | 4.62 | 2.73 |
| Scanning Performance | B | 3.88 | 3.38 |
| Backtesting Performance | AA | 4.38 | 3.38 |
| Trading Bot & Auto-Trading Reliability | A | 4.00 | 2.50 |
| AI & Algo Index | AA | 4.50 | 2.00 |
| Alert Speed | A | 4.00 | 3.67 |
| Trade Signal Quality | AAA | 5.00 | 0.00 |
| Broker Connectivity & Ecosystem Depth | C | 2.40 | 1.55 |
| Portfolio Tool Performance | C | 2.10 | 2.80 |
| Financial News Speed & Depth | C | 1.00 | 2.30 |
| Community Utility Index (CUI) | AAA | 4.75 | 3.25 |
| Support Infrastructure & SLA Audit | AA | 4.50 | 3.75 |
Tested using rating system v3.
See the 2026 v3. 58-point Trade Ideas test and benchmarks.
Pros
✔ 3 AI Trading Algorithms That Beat the Market
✔ Get A Free Holly AI Stock Trade Every Week
✔ Fully Automated Backtesting
✔ Exceptional Stock Scanning
✔ Specific Audited Trade Signals
✔ Auto-trading & broker integration
✔ Auto Trade Commission Free with eTrade integration
✔ Free Live Trading Room
Cons
✘ Old School User Interface
✘ No Mobile App
Trade Ideas is best for active US day traders seeking real-time AI-driven high-probability trades, excellent stock scanning, and a live trading room to learn trading techniques.
Trade Ideas is worth it if you are a pattern day trader trading at least three times daily with an account value of over $25K as this will help you profit after paying the Trade Ideas subscription cost.
| ⚡ Features ? | Charts, Watchlists, Screening |
| 🏆 Unique Features ? | AI Trade Signals, Trading Room, Trading Competitions |
| 🎯 Best for | US Day Traders |
| ♲ Subscription | Monthly, Yearly |
| 💰 Price | $89 | $178 |
| 🆓 Free Version | ✔ |
| 💻 OS | Web Browser, PC |
| 🎮 Trial | Free Live Trading Room |
| ✂ Discount | -15% Discount Code "LIBERATED" |
| 🌎 Region | USA |
According to our testing, Trade Ideas is the industry-leading artificial intelligence-powered stock market scanning and trading signals generation platform. Despite a complicated user interface, the real power lies underneath, with 30 channels of trading ideas and three AI systems pinpointing trading signals for day traders. Trade Ideas promises and delivers the nirvana of market-beating returns.
Trade Ideas is unique because the software tells you when to buy and sell stocks by analyzing millions of trade setups daily. The analysis results in 3 to 5 high probability trades every day. Check out the full Trade Ideas AI trading test.
3. TradingView 17% Annual Discount
Get Your 80% TradingView Black Friday Discount Now
Our 4.8 ⭐ Rated Winning Trading Tool
✅ Applies to New & Existing Customers
✅ Global Markets, Trading & Community
✅ Best In Class Charting
Deal Ends In:

TradingView is my favorite stock trading platform for all international stock markets and social trading. It is designed for traders who value great prices, powerful chart analysis, backtesting, and a large social community.
TradingView is the world’s premier trading platform, trusted by over 20 million active traders. It offers a seamless blend of powerful charting tools, advanced screening features, and in-depth analysis, covering a wide range of assets, including stocks, indices, ETFs, and cryptocurrencies.
| Test | Tier | Score | Average |
|---|---|---|---|
| Composite Lab Performance Score | AAA | 4.75 | 4.21 |
| Pricing Index: $ per Day | AA | $1.97 | $2.74 |
| Value Score (VP) | AA | 4.37 | 2.82 |
| Speed & Ease of Use | AAA | 5.00 | 4.50 |
| Chart Analysis Depth Index | AAA | 5.00 | 3.17 |
| Chart Pattern Depth & Accuracy | B | 3.98 | 2.73 |
| Scanning Performance | AAA | 4.83 | 3.38 |
| Backtesting Performance | A | 4.19 | 3.38 |
| Trading Bot & Auto-Trading Reliability | B | 3.50 | 2.50 |
| AI & Algo Index | B | 3.00 | 2.00 |
| Alert Speed | AA | 4.67 | 3.67 |
| Trade Signal Quality | C | 2.50 | 0.00 |
| Broker Connectivity & Ecosystem Depth | AAA | 5.00 | 1.55 |
| Portfolio Tool Performance | B | 3.60 | 2.80 |
| Financial News Speed & Depth | B | 3.00 | 2.30 |
| Community Utility Index (CUI) | AAA | 5.00 | 3.25 |
| Support Infrastructure & SLA Audit | B | 3.25 | 3.75 |
Tested using benchmarking system v3.
See the 2026 v3 58-point TradingView test and benchmarks.
Pros
✔ 20 million users sharing ideas
✔ AAA Speed & ease of use
✔ Trading from charts
✔ Powerful screening and technical analysis
✔ All stock exchanges globally
✔ AAA Broker connectivity and asset coverage
✔ 100,000+ user-generated strategies
✔ Free and low-cost plans
✔ Flexible backtesting with Pine Script
Cons
✘ Not ideal for value or dividend investors
✘ Coding skills required for backtesting and custom indicators
✘ Average portfolio tools
TradingView provides best-in-class technical analysis tools to analyze financial markets. It offers heatmaps, super charts, indicators, strategy development tools, and backtesting capabilities.
Its vibrant community of traders shares ideas, strategies, and custom indicators, making it an invaluable resource for learning and collaboration.
| ⚡ TradingView Features ? | Charts, News, Watchlists, Screening, Chart Pattern & Candlestick Recognition, Full Broker Integration |
| 🏆 Unique Features ? | Trading, Backtesting, Community, Global Stock, FX & Crypto Markets, Webhook Bot Integration |
| 🎯 Best for | Stock, FX & Crypto Traders |
| ♲ Subscription | Monthly, Yearly |
| 💰 Price | $0 | $15 | $35 | $70 |
| 🆓 Free | ✔ |
| 💻 OS | Web Browser|PC|IOS|Android |
| 🎮 Trial | Yes, Free 30-Day Premium |
| ✂ Discount | -17% on yearly plan + $15 Discount |
| 🌎 Region | Global |
TradingView has an active community of individuals developing and selling stock analysis systems. With the premium-level service, you can create and sell your own. The community also offers numerous indicators and systems at no cost.

TradingView offers over 160 stock chart indicators and unique chart types, including LineBreak Charts, Kagi Charts, Heikin Ashi charts, Point & Figure Charts, and Renko Charts. As an advanced technical trader, you will be well served. Read the in-depth TradingView Test.
4. MetaStock 3-for-1 Deal

Save Up to 80% in MetaStock's Black Friday Sale Now
Our 4.4 ⭐ Rated Global Real-Time News & Best Technical Analysis Tool
✅ 50% Off MetaStock 20 Upgrades
✅ 80% Off Add-Ons
Deal Ends In:
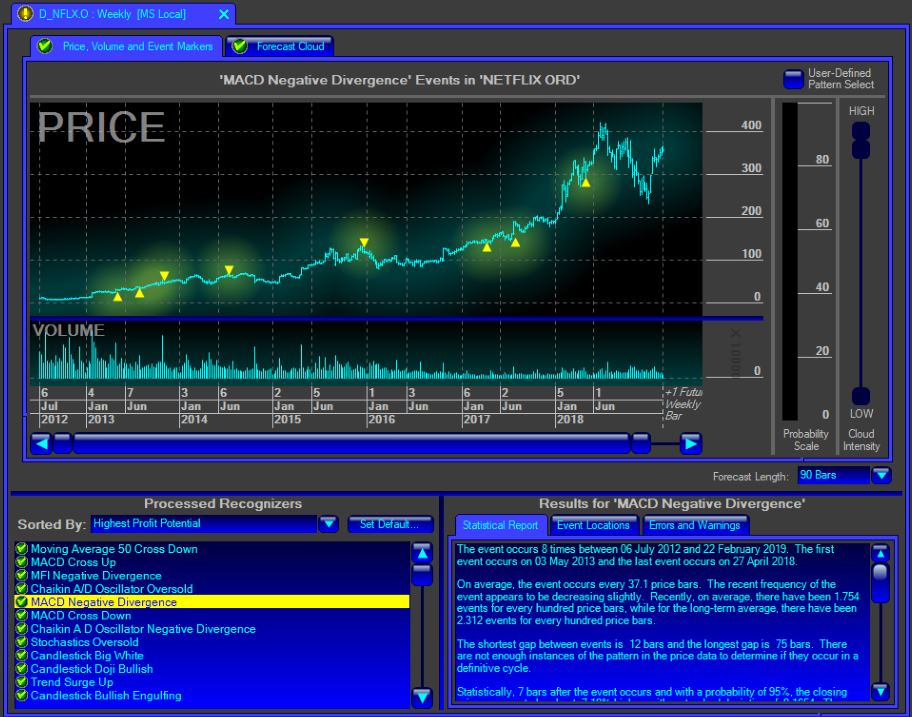
My MetaStock testing highlights it as a robust trading platform. It offers over 300 charts and indicators for global markets, including stocks, ETFs, bonds, and Forex. MetaStock R/T excels with its advanced backtesting and forecasting features, alongside real-time news updates and efficient screening tools.
| Test | Tier | Score | Average |
|---|---|---|---|
| Lab Test Composite Score | AA | 4.42 | 4.21 |
| Pricing Index: $/day | A | $8.71 | $2.74 |
| Value Score (VP) | B | 3.26 | 2.82 |
| Speed & Ease of Use | B | 3.33 | 4.50 |
| Chart Analysis Depth Index | AAA | 4.83 | 3.17 |
| Chart Pattern Depth & Accuracy | B | 3.70 | 2.73 |
| Scanning Performance | B | 3.71 | 3.38 |
| Backtesting Performance | AAA | 4.81 | 3.38 |
| Trading Bot & Auto-Trading Reliability | C | 2.50 | 2.50 |
| AI & Algo Index | C | 2.50 | 2.00 |
| Alert Speed | B | 3.67 | 3.67 |
| Trade Signal Quality | C | 2.50 | 0.00 |
| Broker Connectivity & Ecosystem Depth | C | 1.67 | 2.00 |
| Portfolio Tool Performance | C | 2.60 | 2.80 |
| Financial News Speed & Depth | AAA | 5.00 | 2.30 |
| Community Utility Index (CUI) | B | 3.25 | 3.25 |
| Support Infrastructure & SLA Audit | A | 4.00 | 3.75 |
Tested using benchmarking system v3.
See the 2026 v3 58-point MetaStock test and benchmarks.
Pros
✔ Great Selection of Automated Expert Advisors
✔ Excellent Deep Backtesting
✔ Unique Stock Price Forecasting
✔ Large Library of Add-on Professional Strategies
✔ AAA Charts & Indicators
✔ AAA Institutional Real-Time News
✔ Xenith Add-On Rivals Bloomberg Terminals
✔ Works Online & Offline
Cons
✘ Takes Time To Learn
✘ Old School Windows App Design
✘ Too Many Add-ons

MetaStock is best for traders who need excellent real-time news, exceptional technical analysis, a vast stock systems marketplace with global data coverage, and excellent customer service.
However, the full Metastock suite costs $ 265 per month. It rivals the Bloomberg terminal in functionality but lacks the new AI trading features of TrendSpider and Trade Ideas, such as AI Bot trading and advanced pattern recognition.
| ⚡ Features? | Charts, Watchlists, Scanning, Backtesting |
| 🏆 Unique Features? | Algorithmic AI Forecasting, Real-time Global Trading News (Multi-language), Pattern Recognition with Add-ons. |
| 🎯 Best for | Stock, FX & Commodity Traders |
| ♲ Subscription | Monthly, Yearly |
| 💰 Price | $100 | $265 |
| 💻 OS | PC |
| ✂ Discount | 3 for 1 Deal Worth $530 |
| 🌎 Region | Global |
MetaStock is best for stock traders who need real-time news, access to a huge stock systems marketplace, and the best technical stock chart analysis, backtesting, and forecasting. All international exchanges are covered & backed up with excellent customer service.
Using MetaStock R/T, you can access an in-depth analysis of company fundamentals, from debt structure to the top ten investors, including Level II data. Excellent watchlists featuring company financials and powerful market scanning make MetaStock unique.
MetaStock R/T Refinitiv integration means you get institutional-quality real-time news, analysis, research, and economic outlooks. Refinitiv is the fastest global news service available in the industry. For international investors, MetaStock is unique because the news is also translated into all major languages.
MetaStock has over 350 stock tools for charting, annotation, and drawing trendlines and indicators, the broadest selection of technical analysis tools on the market today. MetaStock is the clear leader in pure technical analysis of stock charts. Read the full MetaStock Lab-Test.
5. Stock Rover 25% Premium Trial Discount
Get Your 30% Stock Rover Black Friday Discount Now
Our 4.7 ⭐ Rated US Investors Tool
✅ Applies to New Customers
✅ Best for US Value, Dividend & Growth Investors
Deal Ends In:
My testing shows Stock Rover is best for long-term dividend, value, and growth investors. Its exceptional features are in-depth screening of a 10-year financial database, research reports, and broker-integrated portfolio management.
| Test | Tier | Score | Average |
|---|---|---|---|
| Lab Test Composite Score | AA | 4.37 | 4.19 |
| Pricing Index | AAA | $0.77 | $2.74 |
| Value Score (VP) | B | 3.63 | 2.82 |
| Speed & Ease of Use | AAA | 5.00 | 4.50 |
| Chart Analysis Depth Index | AA | 4.50 | 3.50 |
| Chart Pattern Depth & Accuracy | N/A | N/A | 2.73 |
| Scanning Performance | AAA | 5.00 | 4.50 |
| Backtesting Performance | A | 4.00 | 4.00 |
| Trading Bot & Auto-Trading Reliability | C | 2.50 | 1.50 |
| AI & Algo Index | C | 2.50 | 2.00 |
| Alert Speed | C | 2.67 | 1.50 |
| Trade Signal Quality | C | 2.50 | 0.00 |
| Broker Connectivity & Ecosystem Depth | C | 2.25 | 4.50 |
| Portfolio Tool Performance | AAA | 4.80 | 2.80 |
| Financial News Speed & Depth | C | 2.00 | 2.30 |
| Community Utility Index (CUI) | C | 2.75 | 4.00 |
| Support Infrastructure & SLA Audit | B | 3.50 | 3.50 |
Tested using benchmarking system v3.
See the 2026 v3 58-point Stock Rover test and benchmarks.
Pros
✔ 800+ Financial Screening Metrics
✔ Potent Stock Scoring Systems
✔ Unique 20-Year Historical Financial Data
✔ Warren Buffett Value Screeners & Portfolios
✔ All Important Financial Ratios
✔ Real-time Research Reports
✔ Portfolio Management & Rebalancing
✔ Broker Integration
✔ Winner: Best Value Investing Screener
Cons
✘ No Social Community
✘ Not for Traders
✘ No Cryptocurrency or Forex Data
✘ US Markets Only
Stock Rover is an industry-leading platform that enables the development of intricate dividend, value, and growth investing strategies.
With Stock Rover, I have developed highly valuable strategies using its unique fair value, discounted cash flow, and margin-of-safety data. Its extensive growth investing data, such as performance versus the S&P 500 and industry growth and earnings rankings, make Stock Rover the best choice for serious investors.
Stock Rover’s key benefits include portfolio correlation and balancing, along with tools to screen for dividends, value, and growth stocks. With 10 years of historical data, you can backtest your criteria to see whether your scans would have been profitable in the past.
| ⚡ Stock Rover Features? | Charts, News, Watchlists, Broker Integration |
| 🏆 Exceptional Features? | Financial Screening, Portfolio Mgt & Rebalancing, 10-Year Database |
| 🎯 Best for | Growth, Dividend & Value Investors |
| ♲ Subscription | Monthly, Yearly |
| 🆓 Free | ✔ |
| 💰 Price | $0 | $29 | $49 |
| 💻 OS | Web Browser |
| 🎮 Trial | 14-Day |
| ✂ Discount Code | -25% During Premium Trial Period |
| 🌎 Region | USA |
Stock Rover is our recommended stock screener for US investors. Stock Rover is ideal for USA value, dividend, and growth investors seeking innovative fundamental stock analysis, screening, and portfolio management software. Stock Rover enables the easy implementation of powerful investing strategies.
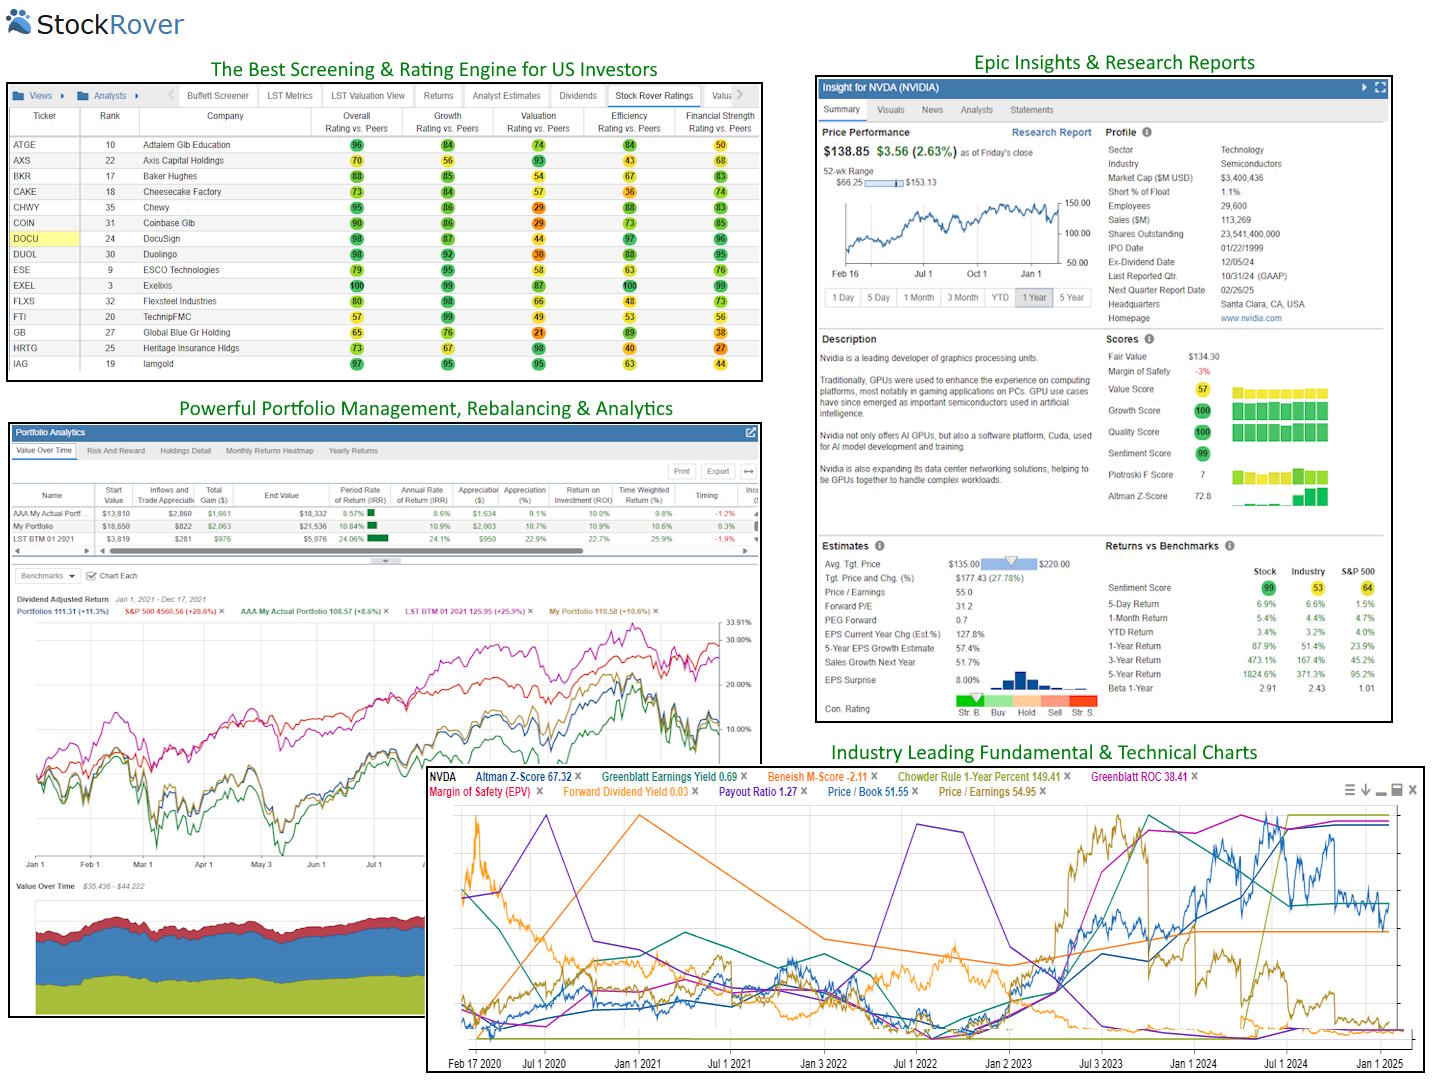
Stock Rover excels at screening stocks for building professional growth, dividend, and value stock portfolios. Stock Rover provides detailed research reports, historical screening, portfolio management reporting, rebalancing, and correlation.
If you manage your portfolio of stocks across multiple brokers, Stock Rover will also integrate them into a single view. Read the full Stock Rover Review and rating.
7. Tickeron 50% Discount Live
★ TICKERON 50% Sale is Live
Tickeron’s 50% Year Round Sale is Running
Tickeron’s 50% Discount is Exclusive to New Customers. Make Sure to Click on the Sale Button
✅ Applies to New Customers
My Tickeron testing confirms impressive AI-powered chart pattern recognition and prediction algorithms for stocks, ETFs, Forex, and Cryptocurrencies. Tickeron provides reliable thematic model portfolios, specific pattern-based trading signals, success probability, and AI confidence levels.
| Test | Tier | Score | Median |
|---|---|---|---|
| Lab Test Composite Score (CLPS) | A | 4.19 | 4.21 |
| Pricing Index: $ per Day | A | $4.11 | $2.74 |
| Value Score (VP) | B | 3.26 | 2.82 |
| Speed & Ease of Use | AAA | 4.83 | 4.50 |
| Chart Analysis Depth Index | C | 0.77 | 3.17 |
| Chart Pattern Depth & Accuracy | B | 3.43 | 2.73 |
| Scanning Performance | C | 2.05 | 3.38 |
| Backtesting Performance | C | 1.88 | 3.38 |
| Trading Bot & Auto-Trading Reliability | A | 4.00 | 2.50 |
| AI & Algo Index | AA | 4.50 | 2.00 |
| Alert Speed | A | 4.00 | 3.67 |
| Trade Signal Quality | AAA | 5.00 | 0.00 |
| Broker Connectivity & Ecosystem Depth | B | 3.17 | 2.00 |
| Portfolio Tool Performance | B | 3.00 | 2.80 |
| Financial News Speed & Depth | C | 2.80 | 2.80 |
| Community Utility Index (CUI) | C | 2.75 | 3.25 |
| Support Infrastructure & SLA Audit | C | 2.75 | 3.75 |
Pros
✔ 45 Streams of Trade Ideas
✔ AAA 5.00 Trade Signals
✔ Real-Time Pattern Recognition for Stocks, ETFs, Forex, and Crypto
✔ AI Trend Prediction Engines
✔ Investing Portfolios with Audited Track Records
✔ Build Your Portfolios with AI
Cons
✘ Custom Charting Limited
✘ Cannot Plot Indicators
✘ Complicated Pricing
Tested using benchmarking system v3.
See the 2026 v3 58-point Tickeron test and benchmarks.
Tickeron’s trading platform is unique and innovative. It combines artificial intelligence and human intelligence based on the community of traders, so you can compare what humans think versus what machines think.
| ⚡ Tickeron Features ? | Portfolios, Watchlists, Screening, 45 Streams of Trade Ideas |
| 🏆 Unique Features ? | Real-time AI Trading Signals for ETF, Forex & Crypto & Pattern Recognition, AI Portfolios |
| 🎯 Best for | Day & Swing Traders |
| ♲ Subscription | Monthly, Yearly |
| 💰 Price | $0 | $250 | $125 |
| 💻 OS | Web Browser, PC |
| 🎮 Trial | 14-Day Free Trial |
| ✂ Discount | 50% Discount on Yearly Plan |
| 🌎 Region | USA |
Tickeron has impressive AI-powered chart pattern recognition and prediction algorithms for stocks, ETFs, Forex, and Cryptocurrencies. Tickeron excels at providing thematic model portfolios, specific pattern-based trading signals, and success probability and AI confidence levels.
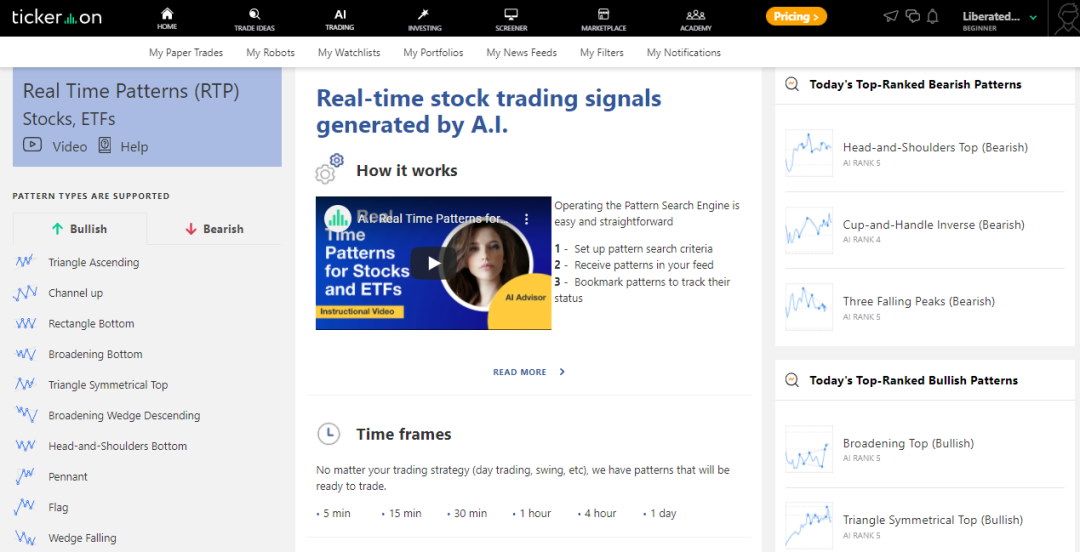
Tickeron’s real-time pattern recognition is particularly useful for swing or day traders, where market timing is the top priority. Tickeron scans the entire market and suggests the best pattern on a particular day. In the screenshot above, you can see Today’s Top Ranked Market Systems, which rates the potential success of the patterns based on the market’s current trading activity.
8. Seeking Alpha 21% Picks & Premium Discount
Seeking Alpha Black Friday Sale 20% Off All Plans
Our 4.7 ⭐ Rated Stock Picking Service
✅ Applies to New Customers
✅ Save up to $480
Deal Ends In:
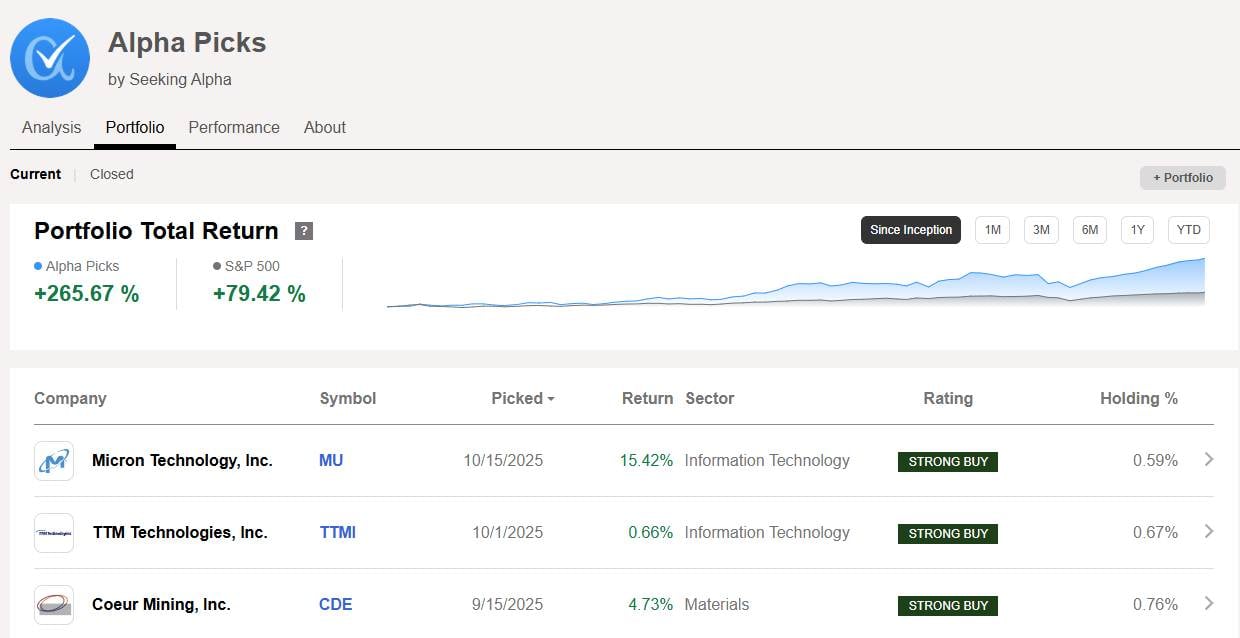
After my independent testing, I rate Seeking Alpha 4.35. I confirm that its Alpha Picks service has an excellent track record, significantly outperforming the market since 2022. Additionally, the quant ratings and level of research included in Premium are truly impressive.
My subscription to Alpha Picks provides significant value, saving me a lot of time on research and stock selection. When combined with the Premium service, I can see next-level quant ratings and grades for all stocks.
| Test | Tier | Score | Average |
|---|---|---|---|
| Lab Test Composite Score | AA | 4.35 | 4.21 |
| Pricing Index | AAA | $2.19/day | $2.74/day |
| Value Score (VP) | B | 3.56 | 2.82 |
| Speed & Ease of Use | AAA | 5.00 | 4.50 |
| Chart Analysis Depth Index | B | 3.95 | 3.24 |
| Scanning Performance | C | 1.67 | 3.50 |
| Trading Bot & Auto-Trading Reliability | C | 1.50 | 2.00 |
| AI & Algo Index | B | 3.00 | 2.00 |
| Alert Speed | B | 3.33 | 4.25 |
| Trade Signal Quality | AAA | 5.00 | 0.00 |
| Broker Connectivity & Ecosystem Depth | C | 2.00 | 2.00 |
| Portfolio Tool Performance | AA | 4.30 | 2.80 |
| Financial News Speed & Depth | B | 1.50 | 2.30 |
| Community Utility Index (CUI) | A | 4.25 | 3.00 |
| Support Infrastructure & SLA Audit | B | 3.50 | 4.00 |
Tested using benchmarking system v3.
See the 2026 v3 58-point Seeking Alpha test and benchmarks.
Pros
✔ Alpha Picks outperformed the S&P 500 by 3X since 2022.
✔ Powerful Quant Ratings & Grading systems.
✔ Alpha Picks & Premium bundle is $639 or $53/m, representing good value for money.
✔ Transparent audit of stock-picking performance.
✔ Incredible depth of research.
✔ A large, vibrant, and intelligent community.
✔ Follow top analysts.
Cons
✘ Pro service is expensive for retail investors.
✘ No Fair Value & DCF metrics for value investors.
✘ Investing groups are pricey.
Alpha Picks really stood out. My test real-world benchmarking showed 3-year annual returns of +88%, compared with +26% for the S&P 500. These momentum-based picks outperformed most Wall Street ratings.
| ⚡ Seeking Alpha Features ? | Charting, Pre-built Screeners, Live Webinars, Community |
| 🏆 Unique Features ? | Alpha Picks Winning Track Record, Quant Ratings, Top Analysts with Audited Performance |
| 🎯 Best for | Stock & ETF Investors |
| ♲ Subscription | Yearly |
| 💰 Price | $24 | $41/m |
| 💻 OS | Web Browser |
| 🎮 Trial | 7 Day Premium Trial |
| ✂ Discount | -21% Alpha Picks & Premium Bundle |
| 🌎 Region | USA |


9. Benzinga Pro 37% Discount

Benzinga Pro: 65% Black Friday Discounts
If you day trade news events, you need Benzinga Pro.
The best US real-time news, research & analysis software for US stock traders.
☆ 65% Off Annual Pro Plans ☆
☆ 65% Off Options Mentor ☆
Deal Ends In:
After thorough testing, I’ve found that Benzinga Pro is an excellent choice for U.S. traders seeking a fast, actionable, real-time news feed at a fraction of the cost of a Bloomberg terminal. Priced at just 1/10th of its competitor, Benzinga Pro is particularly well-suited for active day traders and investors who rely on breaking news to inform their trades. I highly recommend it for those looking to capitalize on market-moving events efficiently.
| Test | Tier | Score | Average |
|---|---|---|---|
| Lab Test Composite Score | A | 4.07 | 4.21 |
| Pricing Index | — | $6.48 | $2.74 |
| Value Score (VP) | C | 2.11 | 2.82 |
| Speed & Ease of Use | AA | 4.33 | 4.50 |
| Chart Analysis Depth Index | C | 2.67 | 3.17 |
| Chart Pattern Depth & Accuracy | N/A | N/A | 2.73 |
| Scanning Performance | C | 2.60 | 3.38 |
| Backtesting Performance | N/A | N/A | 3.38 |
| Trading Bot & Auto-Trading Reliability | C | 2.50 | 2.50 |
| AI & Algo Index | C | 2.00 | 2.00 |
| Alert Speed | AA | 4.33 | 3.67 |
| Trade Signal Quality | C | 2.50 | 0.00 |
| Broker Connectivity & Ecosystem Depth | C | 1.50 | 2.00 |
| Portfolio Tool Performance | C | 2.00 | 2.80 |
| Financial News Speed & Depth | AAA | 5.00 | 2.30 |
| Community Utility Index (CUI) | B | 3.25 | 3.25 |
| Support Infrastructure & SLA Audit | A | 4.25 | 3.75 |
Tested using rating system v3.
See the 2026 v3 58-point Benzinga Pro test and benchmarks.
Pros
✔ AAA Fastest Real-time News Feed
✔ Live Audio News Squawk Box
✔ Options Alerts
✔ Analyst Rating Calendar
✔ Price Change Since News
✔ Sentiment Indicators
✔ News Rated for Impact
✔ 1/10th Price of Bloomberg
Cons
✘ No Broker Integration
✘ No Backtesting
Benzinga Pro offers a comprehensive suite of tools, including detailed charts, financial data, screeners, options mentoring, and an advanced calendar system. Standout features include news sentiment analysis, direct access to a professional newsdesk, a real-time squawk box, and instant alerts for market-moving news.
Benzinga Pro offers a top-tier platform for traders, complete with integrated chat streams and expert options mentoring to help you maximize your gains. I highly recommend it.
| ⚡ Features ? | Real-time News, Calendar, Charts |
| 🏆 Unique Features ? | Audio Squawk Box, News Sentiment, News Rating & Alerts |
| 🎯 Best for | Stock, FX & Crypto Traders |
| ♲ Subscription | Monthly, Yearly |
| 💰 Price | $197 | $166 |
| 💻 OS | Web |
| 🎮 Trial | Yes 14-Day |
| 🌎 Region | North America |
| ✂ Discount | Code "SMARTER" for 25% Off |
Benzinga Pro is our review-winning platform for trading real-time news. Designed for day traders, it delivers real-time market-moving news to give you a trading edge. The service is complete with a news squawk box, direct access to the news desk, and real-time charting and scanning.
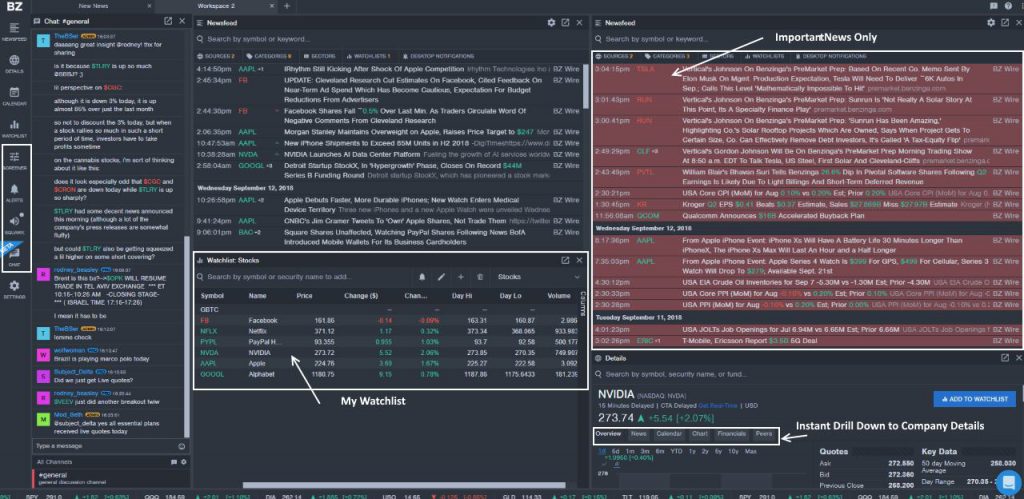
At the core of the Benzinga Pro service is access to a real-time newsfeed that updates quickly and effectively.
Read the In-Depth Benzinga Pro Review
10. Finviz 37% Discount Live
★ Finviz Year-Round Sale
Finviz’ 37% Year Round Sale is Running
Sign up for an Annual Elite plan to save 37%
✅ Applies to New & Existing Customers
Finviz Elite is our recommended software for screening, heatmaps, and chart pattern recognition. An annual subscription, compared to a monthly plan, instantly qualifies you for a 37% discount.
After hands-on testing, I found Finviz to be a powerful free stock screener, with swift market heatmaps and impressive stock chart pattern recognition.
Thanks to ongoing enhancements to its charting capabilities, Finviz remains a relevant and powerful tool in stock analysis. Through my testing, I found Finviz to be an exceptional free resource, offering intuitive heatmaps, speedy stock screening, and seamless chart pattern recognition.
| Test | Tier | Score | Average |
|---|---|---|---|
| Lab Test Composite Score | B | 3.84 | 4.21 |
| Value Score (VP) | C | 1.74 | 2.82 |
| Speed & Ease of Use | AAA | 4.83 | 3.75 |
| Chart Analysis Depth Index | C | 1.54 | 3.17 |
| Chart Pattern Depth & Accuracy | C | 2.73 | 2.73 |
| Scanning Performance | C | 2.26 | 3.38 |
| Backtesting Performance | C | 2.75 | 3.38 |
| Trading Bot & Auto-Trading Reliability | C | 2.00 | 2.50 |
| AI & Algo Index | C | 2.00 | 2.00 |
| Alert Speed | B | 3.67 | 3.67 |
| Trade Signal Quality | C | 0.00 | 0.00 |
| Broker Connectivity & Ecosystem Depth | C | 0.67 | 2.00 |
| Portfolio Tool Performance | C | 2.50 | 2.80 |
| Financial News Speed & Depth | C | 1.50 | 2.30 |
| Community Utility Index (CUI) | C | 1.75 | 3.25 |
| Support Infrastructure & SLA Audit | C | 1.25 | 3.75 |
Tested using rating system v3.
See the 2026 v3 58-point Finviz test and benchmarks.
Pros
✔ 67 stock screening metrics
✔ 33 Chart Patterns Recognized
✔ Intraday (1-minute) data with Finviz Elite
✔ One of the best free stock screeners
✔ Good insider trading/news service
✔ Fast heatmaps for sector & industry visualizations
✔ Integrated news aggregation
✔ Backtesting recognizes 102 chart patterns
Cons
✘ Elite Backtesting Could Be More Flexible
✘ 21 chart indicators
✘ No app for Android or iPhone
✘ No Community
✘ Support & SLA
For those seeking more advanced features, Finviz Elite delivers value at $299 per year, providing real-time data and robust backtesting tools.
Finviz’s elite service provides real-time market data and enables up to 24 years of backtesting across multiple combinations of 102 technical indicators. Finviz is designed for individual investors, enabling them to screen for stocks, see which are on the move, and track their performance in real time.
| ⚡ Finviz Features ? | Screening, Heatmaps, Charts |
| 🏆 Exceptional Features ? | Patterns, Signals, Auto-Trendlines |
| 🎯 Best for | Beginner Investors/Traders |
| ♲ Subscription | Monthly, Yearly |
| 💰 Price | $0 | $25 |
| 🆓 Free Plan | ✔★ |
| 💻 OS | Web Browser |
| 🎮 Trial | 30-Day Money-Back |
| ✂ Discount | 37% Discount on Yearly Plan |
| 🌎 Region | US |
Finviz provides lightning-fast free stock charting, robust screening, and stock chart pattern recognition. Finviz lets investors visualize vast stock market data with heatmaps and money flows on a single screen.
The Finviz heat maps are the show’s star, providing a view of the US and the world’s stock markets. Finviz manages to cram the entire world’s moving stocks onto a single-page heatmap at lightning speed, which is impressive. Simply hovering your mouse over a company shows the stock’s current performance, a mini line chart, and the company’s direct competitors.
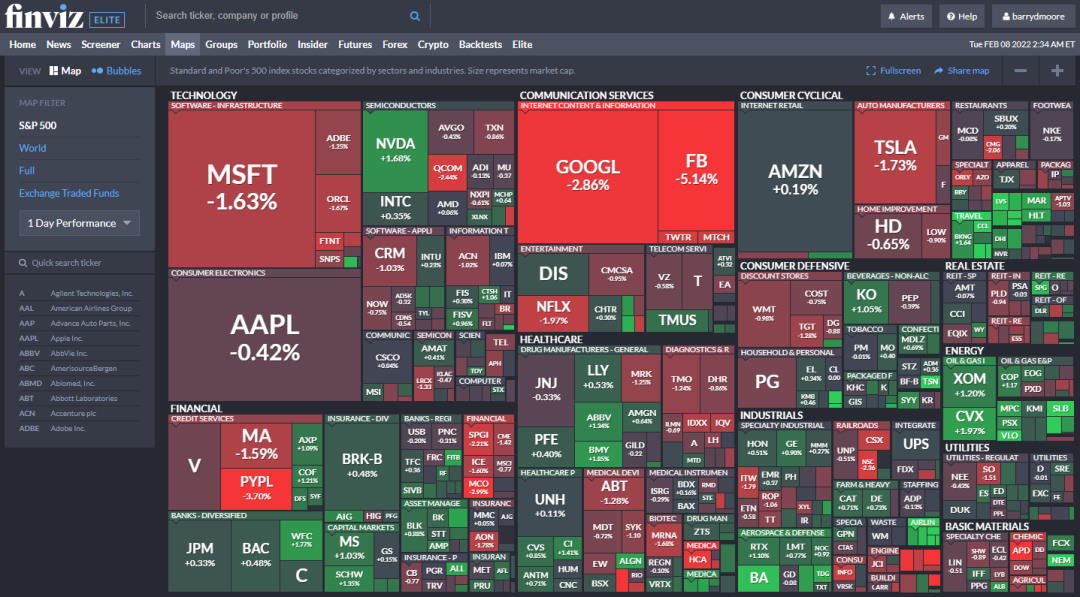
Finviz enables you to visualize markets based on stock price performance, volume, P/E ratio, PEG ratio, Dividend Yield, Float, EPS, and even analyst recommendations. From here, you can double-click on a stock and jump directly to the individual company data and chart. The whole process is extremely fast and efficient.
Trading Courses 50% Discount
Invest in yourself! Get all our courses and strategies for 50% off
★ Liberated Stock Trader Pro Stock Investing & Trading Course ★
★ M.O.S.E.S. Market Outperforming ETF Strategy ★
★ LST Beat the Market Stock Picking Strategy ★
★ Exclusive Bonus Course – The Stock Market Crash Detector Strategy ★
Fully Guided Videos, eBooks & Lifetime Email Support
108 Videos + 3 Full eBooks + 5 Scripts for TradingView + Code & Logic For Stock Rover