Benzinga Pro scores A 4.04 on my Composite Lab Performance Score (CLPS), benchmarked across 17 categories (pricing, value, speed, charting, scanning, automation, AI, alerts, news, community, and support). Bottom line: it’s a specialist real-time news and alerting terminal, not an all-in-one charting/backtesting or portfolio analytics platform.
Our 58-point Benzinga Pro lab test, audit, and benchmarking cover speed, news accuracy, value, and feature depth with precise, data-driven results.
Use this benchmark report to decide (1) whether the subscription cost is justified by your daily workflow, and (2) what to pair it with if you want a complete trading stack.
Composite Lab Performance Score
Benzinga Pro scores A 4.07 on my Composite Lab Performance Score (CLPS), versus the median 4.21.
This is the “whole product” view: it rewards platforms that are balanced across charting, scanning, automation, portfolio, support, and—crucially—real workflow impact. Benzinga Pro’s profile is specialized: it wins on real-time news and alerting, but it intentionally gives up ground in backtesting and deep chart engineering.
| Metric | Calculation | Benzinga Pro | High | Median | Low |
|---|---|---|---|---|---|
| Composite Lab Performance Score (CLPS) | Average for all ratings + 5X Superpower Boost for Top 5 killer features | 4.07 | 4.75 | 4.21 | 2.93 |
| Composite Lab Performance Score (CLPS) Overall Test Winners | TradingView 4.75 | TrendSpider 4.72 | Trade Ideas 4.52 |
If you’re a catalyst or momentum trader who reacts to information, this composite can still translate into better entries and fewer surprises. If you want an all-in-one analysis workstation, the composite correctly signals the need to pair it with another platform.
Key takeaway: the platform’s strengths are concentrated in news, alerts, and operational support, while deep analytics (e.g., patterns, backtesting, portfolio) are limited.
In Context: Benzinga Pro is built for traders who treat news as the first mover. The composite score combines all categories and then boosts the few areas that most directly affect outcomes. Here, the edge isn’t deeper charting or portfolio analytics—it’s speed to awareness: headline flow, squawk, and alerting that let you react before the move is fully priced in. If your workflow starts with “what just happened and why?”, this score is meaningful. If your workflow starts with backtesting, factor models, or automated execution, the composite will lag by design.
Benzinga Pro Benchmarked Lab Scores
| Test | Tier | Score | Average |
|---|---|---|---|
| Lab Test Composite Score | A | 4.07 | 4.21 |
| Pricing Index | — | $6.48 | $2.74 |
| Value Score (VP) | C | 2.11 | 2.82 |
| Speed & Ease of Use | AA | 4.33 | 4.50 |
| Chart Analysis Depth Index | C | 2.67 | 3.17 |
| Chart Pattern Depth & Accuracy | N/A | N/A | 2.73 |
| Scanning Performance | C | 2.60 | 3.38 |
| Backtesting Performance | N/A | N/A | 3.38 |
| Trading Bot & Auto-Trading Reliability | C | 2.50 | 2.50 |
| AI & Algo Index | C | 2.00 | 2.00 |
| Alert Speed | AA | 4.33 | 3.67 |
| Trade Signal Quality | C | 2.50 | 0.00 |
| Broker Connectivity & Ecosystem Depth | C | 1.50 | 2.00 |
| Portfolio Tool Performance | C | 2.00 | 2.80 |
| Financial News Speed & Depth | AAA | 5.00 | 2.30 |
| Community Utility Index (CUI) | B | 3.25 | 3.25 |
| Support Infrastructure & SLA Audit | A | 4.25 | 3.75 |
Reasons to Consider
- You trade around catalysts (earnings, guidance, macro headlines) and need real-time awareness.
- Alerts are central to your workflow, and you need high-capacity, reliable delivery and fast trigger-to-notification.
- You want a news-first UI that reduces screen time and decision lag during market hours.
Reasons to Avoid / Pair With Another Tool
- You need backtesting, strategy research, or systematic validation (Benzinga Pro is not a backtest lab).
- You depend on automated chart pattern discovery or deep, scriptable charting.
- You need portfolio health analytics, rebalancing tools, or correlation/risk decomposition.
Verdict
Benzinga Pro is best viewed as a high-velocity news and alert engine. If you actively trade catalysts, its strengths can justify the pricing. If you need an all-in-one analysis workstation, treat it as one component in a broader stack.

Pricing Index
Benzinga Pro’s cost-per-day is $6.48 on an annual plan, compared with the median of $2.74. Pricing Index is measured in dollars (not a 0–5 rating), so the question is simple: do you use the service often enough to justify the daily cost?
At this price level, you’re paying for speed-to-awareness, a news feed that changes decisions intra-day, not for broad feature coverage. If the squawk, filters, and alerts are part of your daily routine, the cost-per-day can be rational. If it’s an occasional check-in, the pricing becomes pure drag.
| Metric | Calculation | Benzinga Pro | High | Median | Low |
|---|---|---|---|---|---|
| Cost-per-day | $/day on an annual plan. Minimum viable plan with real-time exchange data | $6.48 | $9.99 | $2.74 | $0.74 |
| $ per feature | Effective Monthly Cost /Total Features | $19.70 | $23.37 | $5.95 | $1.94 |
| Effective Monthly Cost (EMC) | EMC = (Plan price + required real-time data fees + key premium add-ons) / month | $197.00 | $303.87 | $83.32 | $22.50 |
Key takeaway: the economics only work if you actively trade catalysts and keep the feed/alerts running most market days.
In Context: Pricing is measured in dollars, not points: cost per day on an annual plan, plus the effective monthly cost, and per-feature cost. This matters because a “news terminal” is only worth paying for if it reliably saves you time and prevents expensive mistakes—missed catalysts, bad entries, or slow exits.
Benzinga Pro prices above the median, so the practical question is whether you’ll actually use the squawk, filters, and alerts daily. If you check it sporadically, the cost-per-day becomes friction rather than an edge.
Value Score (VP)
Benzinga Pro’s Value Score is 2.11 versus the median 2.82. That gap is mostly about breadth and depth outside its core mission—this is not a ‘do everything’ platform.
In practice, the value proposition is strongest when the news workflow is your edge: filtered catalysts, rapid interpretation, and configurable alerts. If you also expect rich chart-building, scripting, portfolio health analytics, and backtesting in the same subscription, the value score is a cautionary sign.
| Metric | Calculation | Benzinga Pro | High | Median | Low |
|---|---|---|---|---|---|
| Value Score | Sum of Feature Quality (60% Weight), Feature Depth (30%) & Device Support Depth (10%) | 2.11 | 4.37 | 2.82 | 0.77 |
| Value Rank | Percentile Ranking | 1.00 | 5.00 | 3.00 | 1.00 |
| Feature Quality | Average of All Feature Quality Ratings | 2.69 | 4.50 | 3.00 | 1.60 |
| Feature Breadth | Feature richness (count of meaningful core features) | 10 | 20 | 11 | 7 |
| Feature Depth | Percentile Ranking | 1.00 | 5.00 | 2.00 | 1.00 |
| Device Support Depth | Web 2 points, (PC, Android/iOS/ 1 Point each) | 2.00 | 5.00 | 2.00 | 1.00 |
| Value Score Test Winners | TradingView 4.37 | TrendSpider 4.20 | Trade Ideas 4.05 |
Key takeaway: the subscription makes sense when you monetize news speed; otherwise, value is better in platforms that consolidate analysis features.
In Context: Value Score summarizes whether the feature set you get is deep enough to justify the bill, based on quality (how well features work), depth (how sophisticated they are), and device support. For Benzinga Pro, value lives in workflow acceleration—tagged headlines, curated feeds, and configurable alerts—more than “toolbox breadth.”
If you’re a catalyst trader, the value can be high even with modest charting. If you want a single platform that does screening, charting, portfolio analytics, and backtesting at a high level, the value score is a warning that you’ll likely need a second tool.
Speed & Ease of Use
Benzinga Pro scores AA 4.33 for Speed & Ease of Use, slightly under the median 4.50. That’s still a strong result for a news-first workstation.
The sub-metrics matter because intraday workflows are fragile: every extra click and every lagging pane increases hesitation when a catalyst hits. Benzinga Pro’s design leans minimalist and fast, prioritizing alert-driven navigation over deep chart layout management.
| Metric | Calculation | Benzinga Pro | High | Median | Low |
|---|---|---|---|---|---|
| Speed & Use Index Rating | Average of Time to Chart Performance, Multimonitor Chart Speed & 3 Click Rule: Ease of Use | 4.33 | 5.00 | 4.50 | 3.25 |
| Time to Chart Speed (Seconds) | Seconds from clicking the icon to a fully loaded chart with 200 price bars & 2 indicators. | 7.22 | 17.03 | 4.70 | 1.55 |
| Time to Chart Performance | Points (<5s=5; <10=4.5; <15=4; <20=3) | 4.50 | 5.00 | 4.50 | 3.00 |
| Multi-Chart Latency (ms) | Delay when syncing 4 charts | 250.00 | 667 | 209 | 10 |
| Multimonitor Chart Speed | Multi-chart sync points | 3.50 | 5.00 | 4.00 | 0.00 |
| 3 Click Rule: Ease of Use | 5 Click Points. Each click > 3 = 1 minus point | 5.00 | 5.00 | 5.00 | 1.00 |
| Speed & Ease of Use Test Winners | TradingView 5.00 | Stock Rover 5.00 | Seeking Alpha 5.00 |
Key takeaway: the interface is optimized for fast reaction to events; the 3-click workflow matters more here than fancy analysis tools.
In Context: Speed & Ease of Use is about friction: how fast you can get from idea → actionable view. Time-to-chart, multimonitor latency, and the 3-click rule translate directly into missed opportunities when headlines hit. Benzinga Pro’s minimalist interface is optimized for “flash” reaction—alerts, feeds, and quick context—rather than multi-step analysis.
If you’re running several screens during market hours, latency and click depth compound into real cognitive load. This metric tells you whether the platform stays out of your way when seconds matter.
Chart Analysis Depth Index
Benzinga Pro lands at 2.67 on Chart Analysis Depth, below the median 3.17. The score reflects a clear positioning choice: charts are for confirmation, not for building custom indicators and workflows inside the platform.
Where this matters: if you rely on custom indicator coding, strategy scripting, or extensive indicator libraries, you will quickly hit a ceiling. If your workflow is ‘headline → quick technical check → execute elsewhere,’ the chart depth is usually sufficient.
| Metric | Calculation | Benzinga Pro | High | Median | Low |
|---|---|---|---|---|---|
| Chart Analysis Depth Index | Average of Chart Depth, Indicator Depth & Custom Coding Scores | 2.67 | 5.00 | 3.17 | 0.50 |
| Chart Types | Total Count | 20.00 | 100.00 | 30.00 | 10.00 |
| Chart Depth | Chart Type Score 0.3 points per chart | 5.00 | 5.00 | 3.00 | 0.30 |
| Indicators | Total Count | 120.00 | 1000.00 | 240.00 | 70.00 |
| Indicator Depth | Indicators Scores 0.025 points per indicator | 3.00 | 5.00 | 2.90 | 0.00 |
| Custom Indicator Coding | Available = 5 Points | 0.00 | 5.00 | 2.50 | 0.00 |
| Chart Analysis Depth Index Test Winners | TradingView 5.00 | MetaStock 5.00 | Optuma 5.00 |
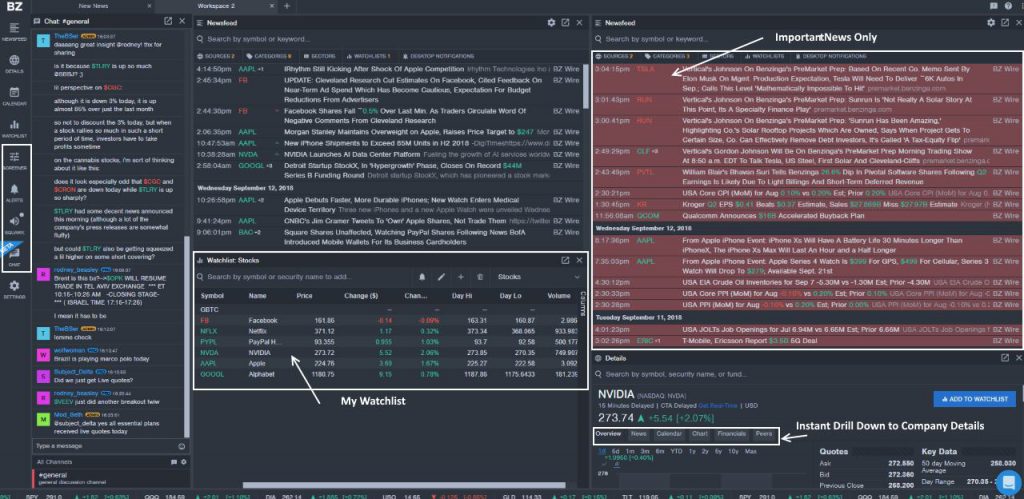
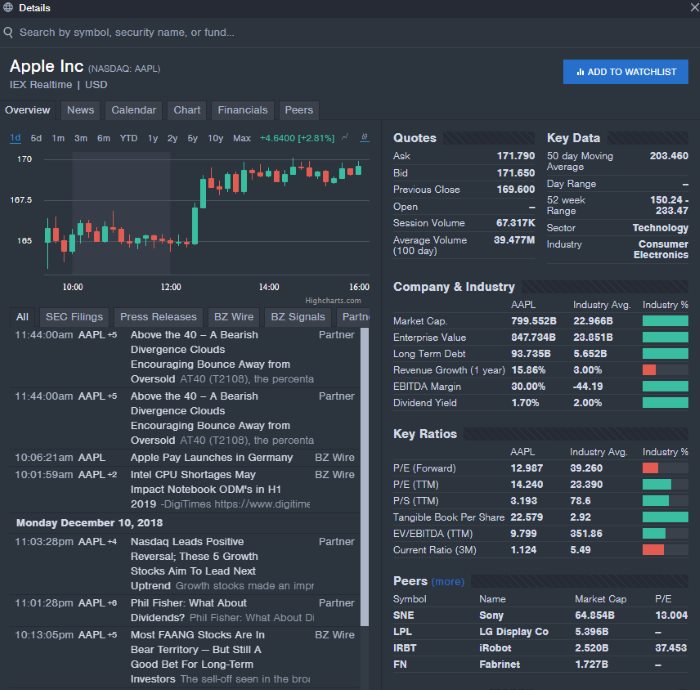
My audit notes: News-first platform; charting powered by TradingView widget.
In Context: Chart Analysis Depth measures whether charting is a primary workstation or a supporting widget, based on chart type variety, indicator depth, and custom coding. Benzinga Pro’s charts are sufficient for context, but the platform’s core job is news and alerting. If your process is “headline → quick technical check → execute elsewhere,” moderate chart depth is fine. But if you build and iterate indicators, scripts, or complex multi-timeframe layouts inside one platform, chart depth becomes non-negotiable—and this metric flags the gap early.
Chart Pattern Depth & Accuracy
Benzinga Pro scores 0.00 on Chart Pattern Depth & Accuracy, versus the median 0.00. In plain terms: it doesn’t try to be a pattern-recognition engine.
If your process depends on automatic discovery of candlestick or trend patterns, this is a hard limitation. If your process requires pattern recognition, you can see the leaders below.
| Metric | Calculation | Benzinga Pro | High | Median | Low |
|---|---|---|---|---|---|
| Pattern Recognition Efficacy & Accuracy | Average of Pattern Recognition Depth & Accuracy Scores | 0.00 | 4.88 | 2.73 | 0.00 |
| Total Patterns | Count of unique patterns recognized | 0 | 226 | 57 | 0 |
| Chart Pattern Recognition & Accuracy Test Winners | TrendSpider 4.88 | Trade Ideas 4.62 | TradingView 3.98 |
Key takeaway: no automated pattern discovery—plan to generate setups elsewhere.
In Context: Pattern metrics exist to answer one question: Can the platform reliably surface actionable setups without you manually scanning charts? That includes pattern breadth (candles, trends, formations) and accuracy. For Benzinga Pro, the workflow is the opposite: you learn about the catalyst first, then you decide whether the chart confirms it. If you rely on automated pattern discovery to generate ideas, a zero here is a hard constraint.
If you rely on news catalysts, the lack of patterns is mostly irrelevant—as long as your charting tool covers confirmations.
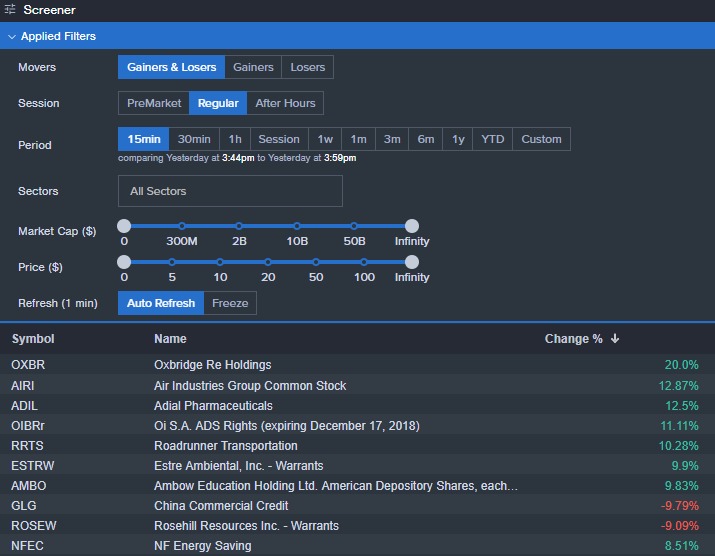
Scanning Performance
Benzinga Pro scores 2.60 for Scanning Performance, below the median 3.38 despite very fast raw scanning speed. The reason is depth: speed alone doesn’t replace flexible criteria and custom logic.
For traders who want rapid, frequently refreshed filters (especially around news/catalysts), the speed component is meaningful. For systematic screening workflows, missing custom code scanning and limited expressiveness can be the bigger constraint.
My audit notes: Fast, deep scanning with real-time refresh and incredible news scanning. Speed is excellent, but the lack of custom logic limits flexibility.
| Metric | Calculation | Benzinga Pro | High | Median | Low |
|---|---|---|---|---|---|
| Market Scanning Latency & Depth | Average of Scanning Speed, Criteria & Customer Code Scores | 2.60 | 4.25 | 3.38 | 0.80 |
| Scanner Performance (ms) | Milliseconds to search the entire S&P 500 across 5 different criteria. | 84.00 | 2500.00 | 450.00 | 90.00 |
| Scanning Speed Points | Points (<100ms=5; <200=4.5; <500=4; <1000=3; <2000=2) | 5.00 | 5.00 | 4.00 | 1.00 |
| Scanner Auto-Refresh Rate (seconds) | Auto-Refresh Speed | 1.00 | 60.00 | 1.00 | 0.00 |
| Scanning Criteria & Depth | Total Criteria Count | 224.00 | 675.00 | 200.00 | 30.00 |
| Scanning Criteria & Depth | Scanning Criteria 0.0125 points per criteria | 2.80 | 5.00 | 2.50 | 1.00 |
| Custom Code Scanning | Exists 5 Points | 0.00 | 5.00 | 5.00 | 0.00 |
| Scanning Performance Test Winners | Stock Rover 5.00 | TradingView 4.83 | TrendSpider 4.67 |
In Context: Scanning Performance blends raw speed with practical depth: how fast it can filter a universe, how many criteria you can express, and whether it supports custom logic.
Benzinga Pro can scan and refresh extremely quickly because it’s designed for real-time monitoring. However, fast scans don’t automatically mean flexible scans—missing custom code or limited criteria depth can cap advanced workflows.
For traders who run high-frequency news/catalyst filters intraday, scan latency matters more than exhaustive factor libraries. For systematic screeners building multi-factor universes, scan expressiveness matters more than milliseconds.
Backtesting Performance
Benzinga Pro scores 0.00 for Backtesting Performance. This is expected: it’s a real-time information and alerting platform, not a strategy research lab.
If you need to validate rules with historical simulations and reporting, you’ll pair Benzinga Pro with a dedicated backtesting tool. If you trade discretionary catalysts, backtesting may be optional—but the platform will not statistically prove an edge for you.
| Metric | Calculation | Benzinga Pro | High | Median | Low |
|---|---|---|---|---|---|
| Quantitative Backtesting Fidelity | Avg of Speed, No-Code, Flexible Coding, Report Quality, Basket Backtesting | N/A | 4.90 | 3.38 | 0.00 |
| Backtesting Speed (ms) | Time to run 10y daily or ~2 months 5-min simulation | N/A | 6000 | 302 | 7 |
| Backtesting Speed | Points (<200=5; <500=4.5; <10000=4; <20000=3) | N/A | 5.00 | 4.25 | 0.00 |
| No Coding Required | Zero-code backtesting (5 points) | N/A | 5.00 | 5.00 | 0.00 |
| Flexible Coding Backtesting | Exists = 5 points | N/A | 5.00 | 5.00 | 0.00 |
| Backtesting Report Quality | Report quality percent | N/A | 100% | 70% | 0% |
| Backtesting Report Quality | Points (0.05 points per 1%) | N/A | 5.00 | 2.25 | 0.00 |
| Multi-Stock Basket Backtesting | If exists = 5 points | N/A | 5.00 | 5.00 | 0.00 |
| Backtesting Performance Test Winners | Optuma 4.94 | TrendSpider 4.88 | MetaStock 4.81 |
Key takeaway: treat this as an upstream signal/awareness tool, not a strategy validation tool.
In Context: Backtesting metrics exist to prevent a common mistake: believing a strategy works because it “sounds right.” A strong backtester needs speed, a usable no-code path, flexible coding, and reporting that exposes drawdowns, regime shifts, and false positives. Benzinga Pro is not positioned as a strategy laboratory; it’s a real-time information system. If you need statistical validation, you’ll use a dedicated backtesting platform.
If you’re discretionary and catalyst-driven, backtesting may be optional—but the metric still reminds you that the platform won’t validate ideas for you.
Trading Bot & Auto-Trading Reliability
Benzinga Pro scores 2.50 for Trading Bot & Auto-Trading Reliability, matching the median 2.50. It supports automation pathways primarily through alerts and handoffs, rather than native auto-execution.
This category is about execution risk: can you reliably move from signal to action without manual bottlenecks, and do you have operational assurance (status, incident transparency, SLA)? Benzinga Pro shows credible options signals, but it’s not positioned as an automated trading engine.
| Metric | Calculation | Benzinga Pro | High | Median | Low |
|---|---|---|---|---|---|
| Automated Execution & Bot Reliability | Sum of Automation Path, Sophistication, Operational Assurance | 2.50 | 4.50 | 2.50 | 0.00 |
| Automation Path | 0.5 none; 1.0 alerts; 1.5 webhook/API; 2.0 native/broker-linked execution | 1.00 | 2.00 | 1.00 | 0.00 |
| Strategy/Bot Sophistication | 0.5 simple; 1.0 multi-condition; 1.5 scripting+test; 2.0 bot-platform depth | 1.00 | 2.00 | 1.50 | 0.00 |
| Operational Assurance | 0.5 public status; 1.0 explicit SLA/credits/uptime promise | 0.50 | 1.00 | 0.00 | 0.00 |
| Bot & Auto-Trading Reliability Test Winners | TrendSpider 4.50 | Trade Ideas 4.00 | Tickeron 4.00 |
In Context: Trading Bot & Auto-Trading Reliability is about execution pathways: can alerts hand off to automation, can strategies be expressed, and is there operational assurance (status, SLA, incident transparency). Benzinga Pro can sit upstream of automation as an alert and event engine, and my audit notes highlight a useful public status signal. But it’s not an auto-executing bot stack. If you want alerts that trigger external workflows, this can be enough. If you want native order automation with performance guarantees, you’ll need a broker-linked trading platform or a bot framework.
AI & Algo Index
Benzinga Pro sits at 3.50 on the AI & Algo Index, right on the median 2.00. It’s algorithmic in its workflow but not an AI-native strategy-synthesis platform.
That’s fine—as long as you don’t buy it expecting forecasting models, agentic strategy design, or automated decisioning. The real value is rapid headline interpretation and structuring, where transparency about what labels mean is more important than flashy claims.
| Metric | Calculation | Benzinga Pro | High | Median | Low |
|---|---|---|---|---|---|
| Algorithmic Intelligence & AI Tier Index | Sum of Algo Depth, AI Layer & Transparency Points | 3.50 | 5.00 | 2.00 | 1.00 |
| Algo Depth | Points: 0.5 alerts only; 1.0 rules strategies; 1.5 backtesting+factor/portfolio rules; 2.0 advanced quant platform | 1.00 | 2.00 | 1.50 | 1.00 |
| AI Layer | 0.0 none; 1.0 assistive; 1.5 ML signals core; 2.0 AI-native decisioning | 1.50 | 2.00 | 0.00 | 0.00 |
| Transparency | 0.0 black-box; 0.5 some; 1.0 clear methodology + validation artifacts | 1.00 | 1.00 | 1.00 | 0.00 |
| AI Reasoning Tier Level Verified | Sentiment Analysis | — | — | — |
| AI & Algo Index Test Winners | TrendSpider 5.00 | Trade Ideas 4.50 | Tickeron 4.50 |
My audit notes: Explicitly markets a “market-trained AI” as part of the product positioning, though it is not an auto-executing bot stack. Squawk & News AI: Excellent at “reasoning” through headlines to determine Bullish/Bearish sentiment via NLP.
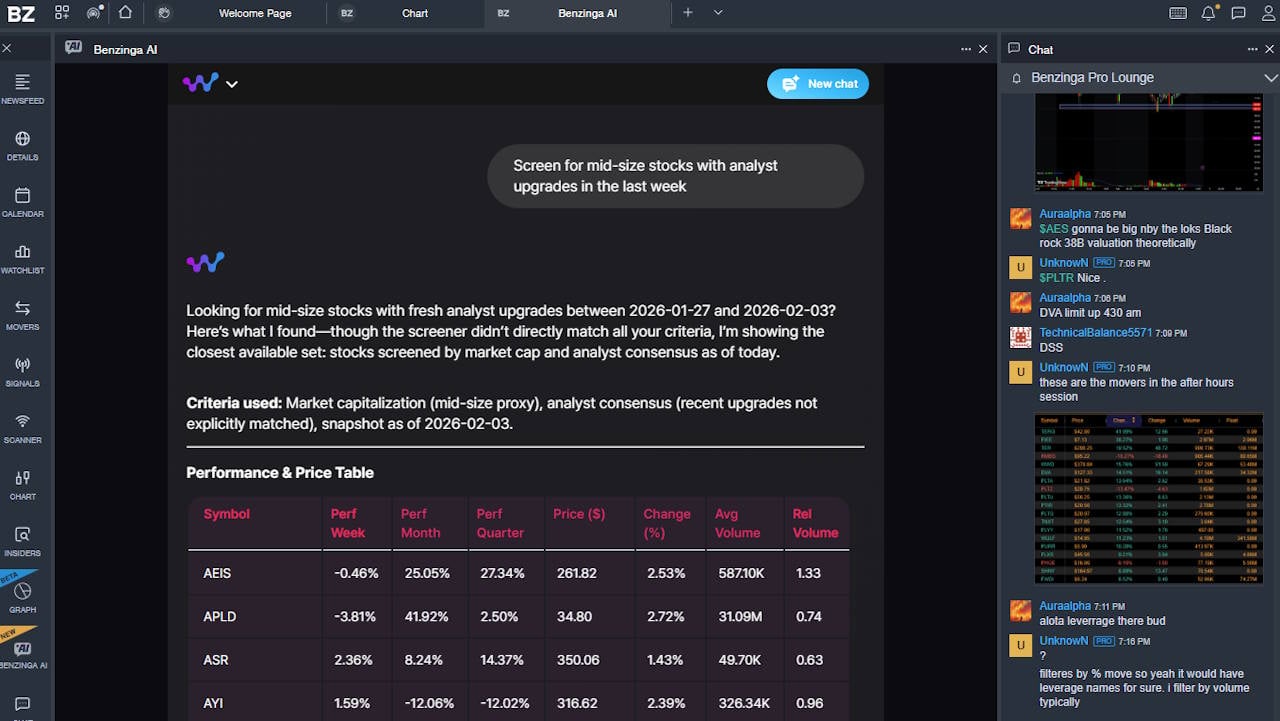
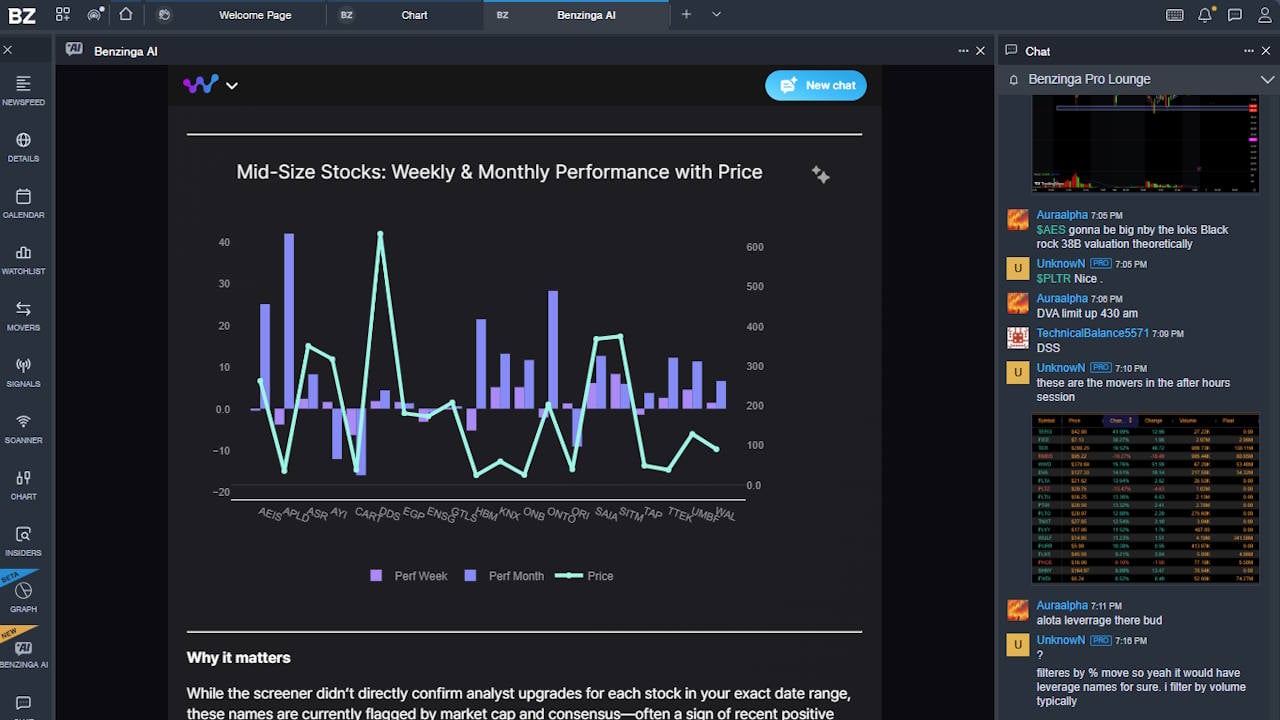
The introduction of the AI chatbot is extremely helpful and provides excellent reports.
Key takeaway: expect organization and sentiment-style assistance, not forecasting or agentic strategy design.
In Context: AI & Algo Index separates “marketing AI” from real capability: algorithmic depth, an actual AI layer, and transparency about methodology. Benzinga Pro is algorithmic in the practical sense—structured feeds, filters, and sentiment-style classification—but not AI-native strategy synthesis. Transparency matters because you need to know what a label means before you bet money on it. If you want AI-driven forecasting or automated decisioning, this score sets expectations. If you want rapid headline interpretation and organization, the index can be ‘good enough’ even without predictive ML signals.
Alert Speed
Benzinga Pro scores AA 4.33 on Alert Speed, above the median 3.67. For many traders, this is the single most purchase-justifying category.
Alerting reduces screen time and prevents missed catalysts—especially when you cover many tickers. The practical test is whether alerts arrive fast and in the channels you actually use (desktop, email, SMS, etc.), without artificial caps.
| Metric | Calculation | Benzinga Pro | High | Median | Low |
|---|---|---|---|---|---|
| Alert Trigger Latency & Delivery Speed | Avg of Concurrent Alerts, Alert Streams & Alert Speed Rating scores | 4.33 | 4.67 | 3.67 | 2.30 |
| Concurrent Alerts | 1 point per 50 (max 5 points) | 5.00 | 5.00 | 5.00 | 5.00 |
| Concurrent Alert Count | Raw capacity | Unlimited | 2000 | 875 | 400 |
| Alert Streams Richness | 1 point per stream (email/webhook/SMS/app; max 5) | 5.00 | 5.00 | 2.00 | 1.00 |
| Alert Speed Rating | Speed rating points | 5.00 | 5.00 | 3.00 | 1.00 |
| Alert Speed Test Winners | TradingView 4.67 | TrendSpider 4.33 | Benzinga Pro 4.33 |
My audit notes: Primarily real-time news/market alerts; supports desktop/browser-style notifications, voice alerts, and email; no alert-cap. Benzinga Pro markets customizable real-time alerts.
Key takeaway: alerting is a core strength—its capacity and delivery options are strong, directly supporting catalyst-based trading workflows.
In Context: Alert Speed is where Benzinga Pro earns its keep. It blends capacity (how many alerts you can run), delivery channels, and the perceived speed of the trigger-to-notification process. Fast alerts matter because the first minutes after a catalyst often decide whether you get a clean entry or chase. In my audit notes, the platform’s alerting is tightly coupled to the news workflow, which is exactly what active traders need. If you’re managing multiple tickers, alerts reduce screen time and fatigue. If you trade slowly on daily charts, alert advantages matter less.
Trade Signal Quality
Benzinga Pro scores 2.50 for Trade Signal Quality, above the median 0.00 (which is near-zero for many tools). These are generally directional gauges and sentiment-style prompts, not audited model portfolios.
Used correctly, signals can help you triage attention—what deserves a closer look right now. Used incorrectly, they can create false confidence. Treat them as context unless you have validation.
| Metric | Calculation | Benzinga Pro | High | Median | Low |
|---|---|---|---|---|---|
| Signal Alpha & Predictive Efficacy | Rating 5 Points Audited Specific Trade Signals 2.5 Points Buy & Sell Gauges / Systemic Signals | 2.50 | 5.00 | 0.00 | 0.00 |
| Trade Signal Quality Test Winners | Trade Ideas 5.00 | Seeking Alpha 5.00 | Tickeron 5.00 | Motley Fool 5.00 |
Key takeaway: Treat signals as context and triage, not as a substitute for a validated trading system.
In Context: Trade Signal Quality asks whether the platform provides actionable directional guidance—not just information. Benzinga Pro’s signals are closer to buy/sell gauges and sentiment cues than fully audited model portfolios. That can still be valuable if you treat it as context: a fast “temperature check” that helps you prioritize which stories deserve attention.
But signals can mislead if you assume predictive accuracy without validation. Use this metric to decide whether you’ll treat signals as prompts (discretionary) or as rules (systematic) consistently.
Broker Connectivity & Ecosystem Depth
Benzinga Pro scores 1.50 on Broker Connectivity & Ecosystem Depth, below the median 2.00. It can integrate broadly as a read-only access to your brokerage, but it is not a primary order-execution platform with published latency guarantees.
| Metric | Calculation | Benzinga Pro | High | Median | Low |
|---|---|---|---|---|---|
| Asset & Data Coverage Index | Avg of Live Trading, Broker Integration & Asset/Data Coverage | 1.50 | 5.00 | 2.00 | 0.67 |
| Live Trading | 5 points | 0.00 | 5.00 | 5.00 | 0.00 |
| Total number of brokers integrated | Raw broker count | 100 | 1200 | 2 | 0 |
| Broker Integration | 0.1 point per broker (max 5 points) | 2.50 | 5.00 | 0.20 | 0.00 |
| Asset & Data Coverage | Stocks, Options, FX, US Exchanges, International Exchanges (1 point each) | 2 | 5 | 2 | 2 |
| Broker Connectivity & Ecosystem Test Winners | TradingView 5.00 | MetaTrader 5.00 | TrendSpider 4.43 |
My audit notes: Benzinga Pro lets you link or select a broker, but only for read-only access to your account; it does not provide direct live trade execution.
In Context: Broker Connectivity & Ecosystem Depth measures whether the platform can close the loop: research → order → execution, plus breadth of assets and data coverage. Benzinga Pro can integrate with many brokers at a contextual level, but it’s not primarily a trade execution workstation with published order-latency guarantees. For many traders, that’s fine—news lives in one tool, execution in another. Where it matters is speed: if you want one-click action from an alert into an order ticket, deeper integration reduces slip and hesitation. This metric tells you how seamless that handoff will feel.
Portfolio Tool Performance
Benzinga Pro scores 2.00 for Portfolio Tool Performance, below the median 2.80. It’s not designed for deep portfolio health analytics, risk decomposition, or rebalancing.
My audit notes: Excellent watchlists and alerting for news/signals, but not designed for portfolio health/rebalancing analytics.
| Metric | Calculation | Benzinga Pro | High | Median | Low |
|---|---|---|---|---|---|
| Portfolio Health & Risk Analytics | 2.00 | 4.80 | 2.80 | 2.00 | |
| Health Check & Reporting Depth % of “Critical Financial Metrics” covered | Risk, dividend, portfolio health and correlation metrics. | 20/80 (25.0%) | 76/80 (95.0%) | 36/80 (45.0%) | 20/80 (25.0%) |
| Portfolio Tool Performance Test Winners | Stock Rover 4.80 | Portfolio 123 4.80 | Seeking Alpha 4.30 |
If you manage a long-term portfolio, pairing it with a dedicated portfolio analytics tool will improve decision quality by covering correlations, concentration, dividend health, and stress testing. If you’re mostly intraday and flat by the close, portfolio analytics matter less, and this weakness may not impact you.
Key takeaway: You’ll want a dedicated portfolio analytics solution if you manage multi-position risk.
In Context: Portfolio Tool Performance is about risk management after the trade: correlations, drawdown exposure, dividend and factor sensitivity, and health checks that prevent hidden concentration. Benzinga Pro is not designed as a portfolio analytics suite; its strengths are discovery and awareness. If you’re running a long-term portfolio, pairing it with a dedicated portfolio tool can materially improve decision quality through rebalancing, diversification, and stress testing. If you’re intraday and flat by the close, portfolio depth matters less. This metric helps you avoid paying a news premium expecting portfolio-grade reporting.
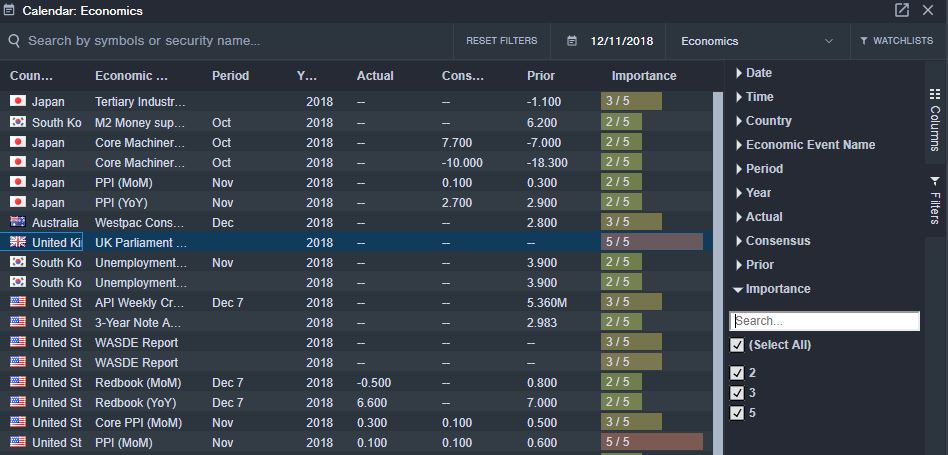
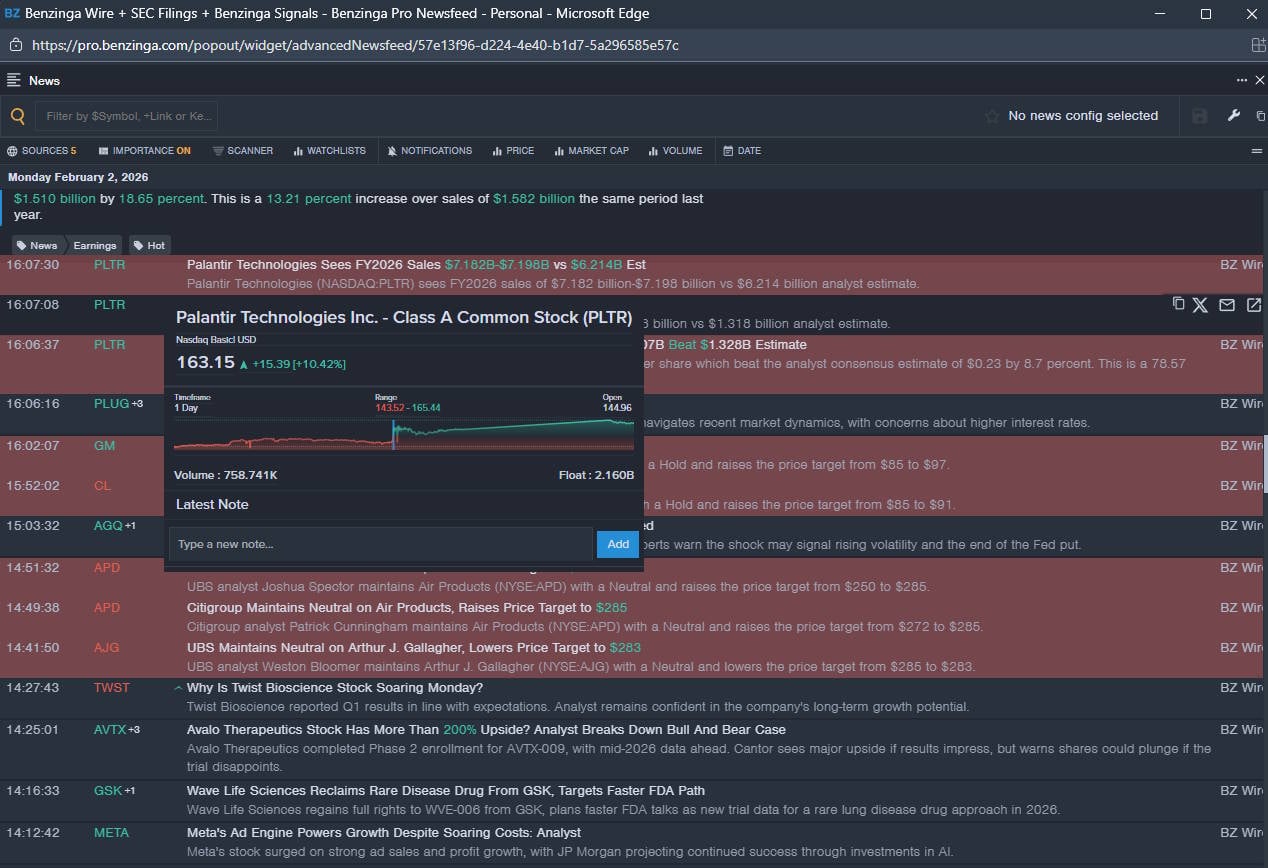
Financial News Speed & Depth
Benzinga Pro’s superpower scoring AAA 5.00 for Financial News Speed & Depth, hitting the high and setting the standard benchmark 5.00. This is the category it’s built to win.
If you trade around earnings, guidance, macro headlines, and unusual events, faster and filterable news can be a real edge. For slower timeframes, you’ll value organization and relevance more than raw seconds—Benzinga still performs well, but the payoff is different.
| Metric | Calculation | Benzinga Pro | High | Median | Low |
|---|---|---|---|---|---|
| Financial News Speed & Quality Rating | Weighted rubric (news scanning, plots, watchlist, filtering, providers, alerts, real-time) | 5.00 | 5.00 | 2.30 | 0.00 |
| News Delay vs Primary Wires | Seconds of delay vs Bloomberg/Reuters (range) | 1s – 3s | < 1 s | 60–300 s | Hours/Days |
| Financial News Speed & Depth Test Winners | MetaStock 5.00 | Benzinga Pro 5.00 | Scanz 5.00 |
My audit notes: The industry standard for retail news speed. Their “Squawk” often beats the text headlines.
In Context: Financial News Speed & Depth is Benzinga Pro’s signature category. The scoring rewards not just “has news,” but news that is filterable, alertable, multi-sourced, and truly real-time. In my audit notes, the squawk and feed speed are the differentiators: it’s built to surface what matters fast, not to produce long research essays.
For active traders, the difference between 3 seconds and 30 seconds can be the whole move. For investors, speed matters less than interpretation—so you’ll value filters, context, and watchlist relevance more than raw latency.
Community Utility Index (CUI)
Benzinga Pro scores 3.25 on Community Utility, right around the median 3.25. The community dynamic is more ‘newsroom’ than ‘research lab.’
If you want fast shared attention, what traders are watching now, the community helps. If you want reusable IP like scripts, backtests, and indicator libraries, you’ll typically find that in charting/scripting-centric platforms.
| Metric | Calculation | Benzinga Pro | High | Median | Low |
|---|---|---|---|---|---|
| Community Utility Index | Avg of Active Community Size & Quality of Contribution scores | 3.25 | 5.00 | 3.25 | 1.80 |
| Active Community Size | Active users/community density rating | 3.50 | 5.00 | 3.00 | 2.00 |
| Quality of Community Contribution | Quality of shared IP/code/research rating | 3.00 | 5.00 | 3.50 | 1.50 |
| Community Utility Index Test Winners | TradingView 5.00 | MetaTrader 5.00 | Trade Ideas 4.75 |
My audit notes: A high-velocity, “newsroom” style chat environment focused on immediate actionability rather than long-term IP.
Key takeaway: Community value is real but oriented to immediacy; don’t expect a large library of reusable scripts or backtests.
In Context: Community Utility Index captures two things: how many active users you can learn from, and whether that community produces high-quality, reusable ideas (not noise). Benzinga Pro’s community tends to feel like a newsroom—fast, reactive, and oriented to immediate action—rather than a code-sharing ecosystem. That’s useful if you want “what are traders watching right now?” It’s less useful if you’re hunting for backtested strategies or indicator libraries. This metric helps you decide whether the community will reduce your learning curve and whether it will add alpha—or just add chatter.
Support Infrastructure & SLA Audit
Benzinga Pro scores A 4.25 on Support Infrastructure & SLA, above the median 3.75. For an intraday tool, support quality is not a ‘nice to have’—it’s operational risk control.
| Metric | Calculation | Benzinga Pro | High | Median | Low |
|---|---|---|---|---|---|
| Support SLA Audit: Time-to-Human Benchmarks | Avg of Support Communication Channels & Support Response Times scores | 4.25 | 5.00 | 3.75 | 1.00 |
| Support Communication Channels | Access scale | 4.50 | 5.00 | 3.50 | 1.00 |
| Support Response Times | SLA scale | 4.00 | 5.00 | 4.00 | 1.00 |
| Support Infrastructure & SLA Audit Winners | TrendSpider 5.00 | TC2000 5.00 | ThinkorSwim 4.75 |
My audit notes: High-energy in-app support, with chat reps often providing trading context alongside technical help.
When alerts or feeds misbehave during market hours, you need a fast path to a human. Strong channels and response times reduce downtime, but you should still build redundancy for mission-critical workflows.
Key takeaway: Support responsiveness reduces operational risk for intraday users, but critical workflows should still have redundancy.
In Context: Support Infrastructure & SLA Audit measures access to a human and the realism of response expectations. When a platform is used during market hours, support delays become trading risk. Benzinga Pro scores above the median because support is reachable and reasonably responsive, and my audit notes highlight an in-app, high-energy support experience.
That matters if you rely on intraday alerts and feeds. Still, treat support as a safety net, not a trading plan: build redundancy for critical workflows, and verify reliability before you size up. This section tells you how much operational confidence you can assume.