TC2000, a trusted trading platform with over 30 years of history, has earned a strong reputation in the industry. But does it still hold its relevance in today’s fast-evolving market?
My TC2000 testing uncovers powerful market scanning, live trading, and options charts for US traders.
TC2000 is fast and cost-effective, but lags the competition in backtesting, AI, pattern recognition, and social features.
Composite Lab Performance Score
TC2000 scores 4.30, slightly above the Median competitor (4.21) and within striking distance of the best-in-class ceiling (4.75). What holds TC2000 back from the very top isn’t trading usability—it’s the research engine behind systematic testing and AI/algo tooling.
| Metric | What It Measures | Calculation | TC2000 | High | Median | Low |
|---|---|---|---|---|---|---|
| Composite Lab Performance Score (CLPS) | Overall benchmark outcome | Avg of all ratings + 5× superpower boost | 4.30 | 4.75 | 4.21 | 2.93 |
| Composite Lab Performance Score (CLPS) Overall Test Winners | TradingView 4.75 | TrendSpider 4.72 | Trade Ideas 4.52 |
Review Ratings & Verdict
My testing of TC2000 highlights its impressive real-time stock scanning, advanced charting, and customizable indicators, making it a powerful tool for US stock and options traders. It also offers seamless broker integration with TC2000 Brokerage and sophisticated technical analysis features, such as options strategy charting and trade execution.
| Test | Tier | Score | Average |
|---|---|---|---|
| Lab Test Composite Score | AA | 4.30 | 4.21 |
| Pricing Index $/day | AA | $2.74 | $2.74 |
| Value Score (VP) | B | 3.39 | 2.82 |
| Speed & Ease of Use | AAA | 4.83 | 4.50 |
| Chart Analysis Depth Index | B | 3.78 | 3.17 |
| Chart Pattern Depth & Accuracy | C | 2.58 | 2.73 |
| Scanning Performance | AA | 4.32 | 3.38 |
| Backtesting Performance | C | 0.00 | 3.38 |
| Trading Bot & Auto-Trading Reliability | B | 3.00 | 2.50 |
| AI & Algo Index | C | 1.50 | 2.00 |
| Alert Speed | A | 4.00 | 3.67 |
| Trade Signal Quality | C | 0.00 | 0.00 |
| Broker Connectivity & Ecosystem Depth | C | 2.73 | 2.00 |
| Portfolio Tool Performance | C | 2.90 | 2.80 |
| Financial News Speed & Depth | B | 3.50 | 2.30 |
| Community Utility Index (CUI) | B | 3.50 | 3.25 |
| Support Infrastructure & SLA Audit | AAA | 5.00 | 3.75 |
Tested using rating system v3.
See the 2026 v3 58-point TC2000 test and benchmarking.
Pros
✔ Excellent US Customer Support
✔ Trade Stocks & Options From Charts
✔ Broad Selection of Charts & Indicators
✔ Options Strategies & Live Trading
✔ Real-time Entire Market Scanning
✔ Great Usability & Simple Setup
✔ AAA Support & SLA
✔ Free for TC2000 Brokerage Users
Cons
✘ Limited Social Community
✘ Limited Pattern Recognition
✘ No Backtesting
✘ $1 per trade with TC2000 Brokerage
✘ No AI Trading Features

However, TC2000 falls short in its backtesting capabilities and in the advanced AI trading features offered by platforms like TrendSpider and Trade Ideas. It lacks cutting-edge tools such as AI stock trading and pattern recognition, which provide traders with a significant advantage.
Key Features
| ⚡ TC2000 Features ? | Charts, Custom Indicators, EasyScan |
| 🏆 Unique Features ? | TC2000 Brokerage, Options Strategies |
| 🎯 Best for | Stock & Options Traders |
| ♲ Subscription | Monthly, Yearly, Bi-Annually |
| 💰 Price | $0 |$25 | $50| $99 |
| 🆓 Free | Try TC2000 Free |
| 💻 OS | PC, Mac, Web |
| 🎮 Trial | Yes, 30-Day |
| ✂ Discount | -25% for 2-Year Subscription |
| 🌎 Region | USA |
What is TC2000?
TC2000 by Worden Brothers Inc. is a leading technical analysis and stock screening platform. Its mature service includes a comprehensive selection of stock charts, indicators, and fundamental scanning tools. Voted Best Software by Stock & Commodities magazine for 25 consecutive years, it is a great option for US investors. As a professionally certified market analyst, TC2000 has long been one of my favorite tools, and I have been a subscriber for over 20 years.
Pricing Index
TC2000 lands exactly on the Median at $2.74. That means it’s neither a bargain leader nor an outlier in terms of per-feature premium. The practical reader takeaway is simple: you buy TC2000 for workflow and speed, not because it’s the lowest cost way to cover every feature category.
| Metric | What It Measures | Calculation | TC2000 | High | Median | Low |
|---|---|---|---|---|---|---|
| Pricing Index | Daily cost baseline | $/day on annual plan (min viable + data) | $2.74 | $9.99 | $2.74 | $0.74 |
| $ per feature | Cost efficiency | Effective Monthly Cost / Total Features | $5.95 | $23.37 | $5.95 | $1.94 |
| Effective Monthly Cost (EMC) | True monthly cost | Plan + data + required add-ons/month | $83.32 | $303.87 | $83.32 | $22.50 |
My audit notes point to TC2000’s “value” being realized only when you actually use its strengths: scanning, multi-chart workflows, and execution. If you’re mostly doing light research and occasional chart checks, you can often get comparable value for less.
TC2000 is free for charts and trendlines, but the restrictions make it unusable. The Basic service costs $24.99 monthly and unlocks indicators, watchlists, and paper trading. Premium costs $49.99 per month and includes scanning, multiple monitors, chart drawing tools, and alerts.
Premium+ is priced at $83.32 per month, including $9.99 per month for data, which is the Effective Monthly Cost (EMC). It includes 1,000 alerts and real-time market pulse gauges.
The minimum plan to use is Premium+, since Basic lacks too much functionality.
Is TC2000 Free?
Yes, you can download and use TC2000 for free. The free version lets you view bar, candle, and Heikin-Ashi stock & option charts, and draw trendlines. You will need a premium subscription for customizable layouts, watchlists, and plot stock chart indicators.
TC2000 Discount
Our partnership with TC2000 allows us to share a $25 discount coupon for your first purchase. You can also combine it with a bi-annual subscription, which saves an additional 25%.
Basic Features
The Basic subscription offers additional features, enabling you to plot advanced stock chart indicators, use options charting, utilize customizable watchlists, and engage in paper trading. In my opinion, the Basic service is not worth it because many features are restricted.
Premium Features (Recommended)
The TC2000 Premium service costs $24.99 monthly, and an annual subscription offers a 17% discount. It includes real-time stock and options scanning, custom conditions, 100 alerts, and custom formulas. It strikes a good balance between price and functionality.
I recommend the Premium plan because of the following features:
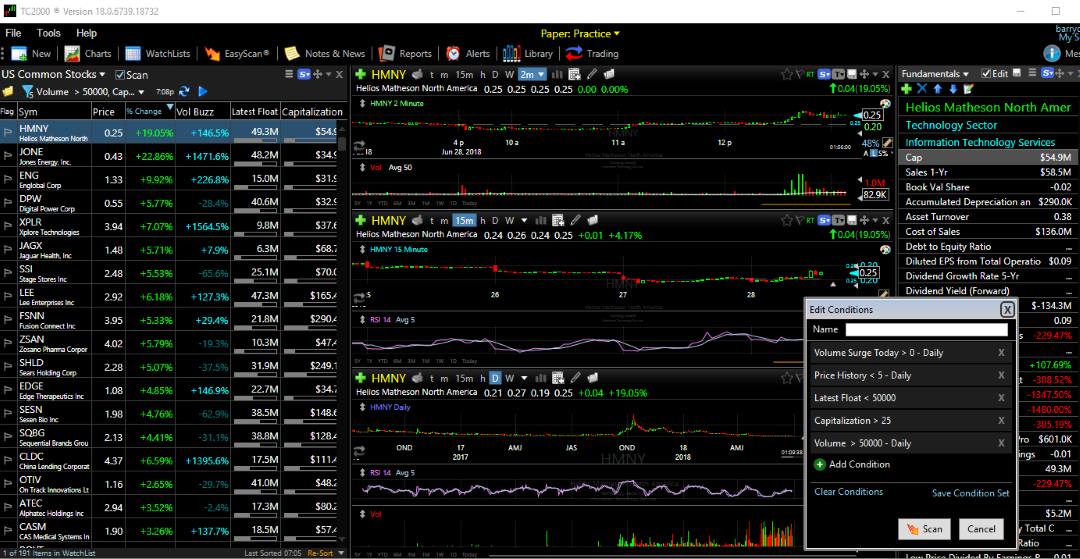
- EasyScan lets you unleash powerful fundamental scanning; you can scan EPS, PE Ratio, Earnings Growth, Sales, and more.
- Unlocks Technical & Fundamental Scanning Combinations—for example, if you want to combine the stock price crossing the 20-day moving average plus a volume surge with growth in the earnings per share for the last quarter, this is only possible with TC2000.
- EasyScan results are displayed extremely quickly, which can save a lot of time.
- 100 Alerts are enabled. TC2000 has an excellent, extremely flexible alert system that lets you set alerts on any indicator, price, or trendline. Alerts can be routed to your email, SMS, or an on-screen pop-up.
- Charting of Fundamentals from MorningStar – This is great because it enables you to plot, for example, earnings per share (EPS) on the chart. This lets you visually see whether a company has accelerated earnings over time.
Premium+ Features
The Premium+ service is double the price of the Premium service, and includes the real-time EasyScan dashboard, historical scanning, and customizable indicators.
- Easyscan is now real-time; watchlists’ scans and criteria pulsate with activity as they constantly refresh.
- Real-time scan results, so you can set up reports that summarize the results of your scans to enable simpler tracking of thousands of data points.
- Real-time Market-Pulse gauges and indicators.
- 1,000 stock and option alerts.
- Build custom market timing indicators from scan plots.
- A $300 discount annually when you trade once per month with a TC2000 Brokerage Account.
I recommend the Premium service, as it provides a more powerful alert engine and unlocks the full capabilities of TC2000’s technical and fundamental scanning and filtering. TC2000 is specifically designed for trading stocks, ETFs, mutual funds, and stock options, primarily in the US market.
Value Score (VP)
Value Score (VP) answers a different question than pricing: “How good is the product relative to what it offers?” It weighs Feature Quality (60%), Feature Depth (30%), and Device Support (10%). This is important because many tools look “feature-rich” but don’t deliver consistent quality, depth, or usability.
TC2000’s VP is 3.39, comfortably above the Median competitor (2.82). That’s what you want to see in a platform you’ll use during active market hours: strong enough product quality that you’re not fighting the interface or second-guessing tool stability.
| Metric | What It Measures | Calculation | TC2000 | High | Median | Low |
|---|---|---|---|---|---|---|
| Value Score (VP) | Overall product value | 60% Quality + 30% Depth + 10% Device | 3.39 | 4.37 | 2.82 | 1.70 |
| Value Rank | Relative standing | Percentile ranking | 3.75 | 5.00 | 2.50 | 1.00 |
| Feature Quality | “How well it works.” | Avg of feature-quality ratings | 2.94 | 4.16 | 2.97 | 2.00 |
| Feature Breadth | Feature coverage | Count of meaningful core features | 14 | 17 | 12 | 9 |
| Feature Depth | Capability depth | Percentile ranking | 3.75 | 4.75 | 3.00 | 1.00 |
| Device Support Depth | Cross-device utility | Web/PC/iOS/Android points | 5.00 | 5.00 | 2.00 | 1.00 |
| Value Score Test Winners | TradingView 4.37 | TrendSpider 4.20 | Trade Ideas 4.05 |
TC2000 is free to download for PC or Apple IOS devices. I have been testing and using the software since 1999, and I can confirm the platform is first-class, mature, and reliable.
TC2000 App for Android & IOS
- Google Play Store Rating: ★★★
- Our Service Rating: ★★★★
TC2000 has a 3-star-rated app on the Google Play Store but is unavailable on the Apple App Store. However, you can access the fully functional TC2000 by installing TC2000 Anywhere.
While the current reviews on the Play Store suggest some technical issues, TC2000 has recently been updated to run natively on all devices. I have tested it, and the new version is excellent.
It is an incredibly powerful yet easy-to-use stock analysis suite.
TC2000 is ideal for those wanting to trade and invest in the US and Canadian stock markets, as international exchanges are not supported. Worden Brothers, who created TC2000, have also launched the TC2000 Brokerage, which has some incredible benefits:
- You can trade directly from the charts.
- You can scan fundamentals and custom technical conditions and initiate a trade in seconds.
- You get a first-class experience on mobile.
The trades are not commission-free, but the software will be free if you sign up for the TC2000 brokerage. The downside is the app’s lack of social integration, real-time news, or stock research.
Speed & Ease of Use
TC2000 scores 4.83, better than the median (4.50). The most meaningful datapoint for active traders is multi-chart latency: TC2000 is effectively the fastest multimonitor sync delay (10ms), which is exactly what you want when running 4+ charts and expecting the platform to feel “local.” Plus, it passes the 3-click rule and requires zero data feeds configuration.
| Metric | What It Measures | Calculation | TC2000 | High | Median | Low |
|---|---|---|---|---|---|---|
| Speed & Use Index Rating | Practical speed/usability | Avg of 3 sub-scores | 4.83 | 5.00 | 4.50 | 3.30 |
| Time to Chart Speed (Seconds) | Time to usable chart | Click → loaded chart + indicators | 7.30s | 17.03s | 4.70s | 1.60s |
| Time to Chart Performance | Speed points | Threshold scoring | 4.50 | 5.00 | 4.50 | 3.00 |
| Multi-Chart Latency (ms) | Multi-chart sync delay | Delay syncing 4 charts | 10ms | 667ms | 209ms | 10ms |
| Multimonitor Chart Speed | Latency points | Threshold scoring | 5.00 | 5.00 | 3.50 | 0.00 |
| 3-Click Rule Test | Workflow friction | Clicks to trade/launch scan | 3 | 6 | 3 | 2 |
| 3 Click Rule: Ease of Use | Friction score | Penalty beyond 3 clicks | 5.00 | 5.00 | 5.00 | 2.00 |
| Speed & Ease of Use Test Winners | TradingView 5.00 | Stock Rover 5.00 | Seeking Alpha 5.00 |
TC2000 is easy to use and yet very powerful. The interface design strikes the right balance between looking great and being instantly useful. A heavy focus on watchlist management, flagging stocks, making notes, and powerful scanning make it easy to use and master. The software setup takes a few minutes and runs perfectly across devices.
Chart Analysis Depth Index
Chart depth isn’t just “how many chart types exist.” It’s a blend of (1) chart-type variety, (2) indicator library depth, and (3) whether you can extend the platform with custom logic. The reason this matters is simple: technical traders evolve, and you want a platform that can support new methods without forcing a migration.
TC2000 scores 3.78, above the Median (3.17). It doesn’t lead on chart-type count (it’s not trying to), but it performs strongly on indicator depth and custom coding availability.
| Metric | What It Measures | Calculation | TC2000 | High | Median | Low |
|---|---|---|---|---|---|---|
| Chart Analysis Depth Index | Overall charting depth | Avg chart + indicators + coding | 3.78 | 5.00 | 3.17 | 0.50 |
| Chart Types | Chart variety | Total count | 7 | 38 | 10 | 1 |
| Chart Depth | Chart variety score | 0.3 points per chart | 2.10 | 5.00 | 3.00 | 0.30 |
| Indicators | Built-in indicators | Total count | 170 | 400 | 116 | 0 |
| Indicator Depth | Indicator score | 0.025 points per indicator | 4.25 | 5.00 | 2.90 | 0.00 |
| Custom Indicator Coding | Extendability | Available = 5 points | 5.00 | 5.00 | 2.50 | 0.00 |
| Chart Analysis Depth Index Test Winners | TradingView 5.00 | MetaStock 5.00 | Optuma 5.00 |
In Context: My audit notes describe TC2000 as “deterministic and stable”—great for traders who want consistent charting plus the ability to write formulas without living inside a complex scripting ecosystem.
TC2000 has an excellent array of technical indicators and drawing tools; all the big ones are there, from OBV, RSI, and Bollinger Bands to Fibonacci Fans and Andrews Pitchfork. With over 170 different indicators, you will have plenty to play with.
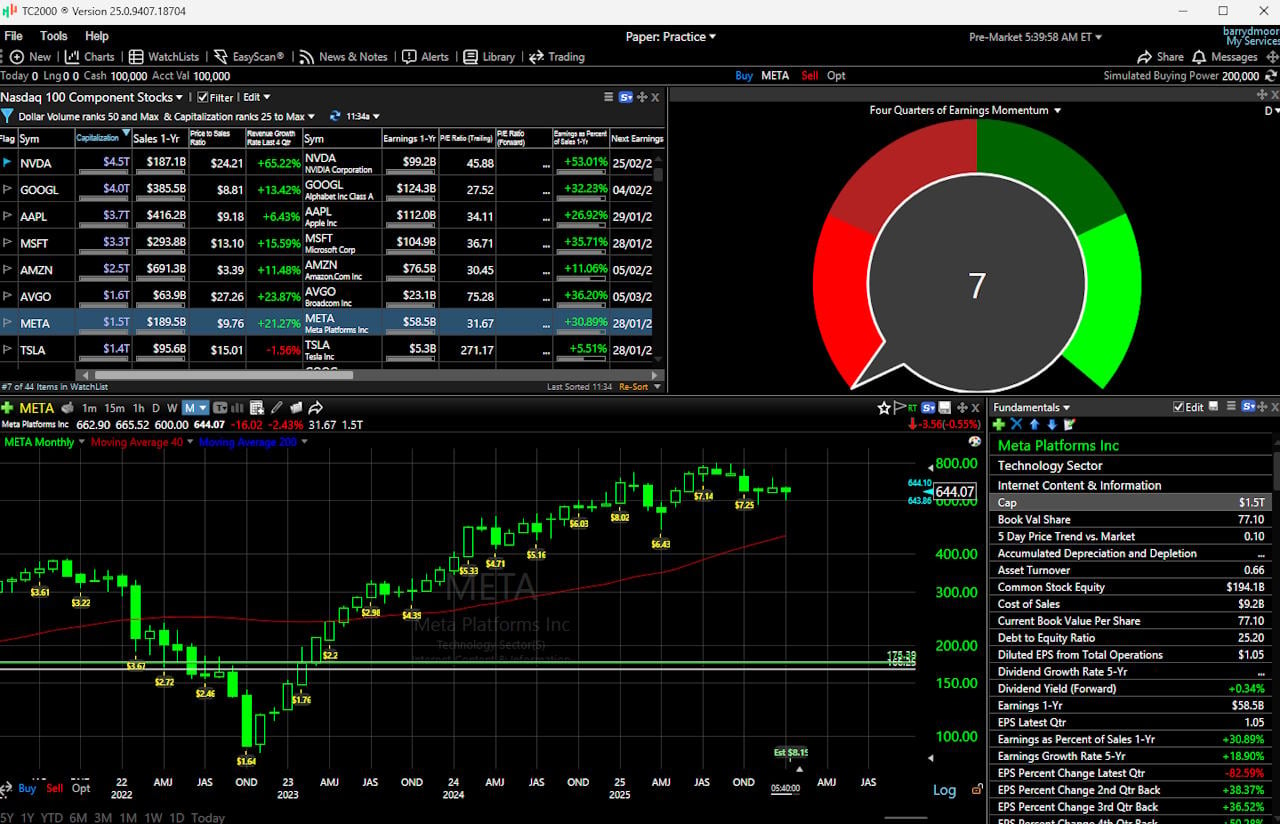
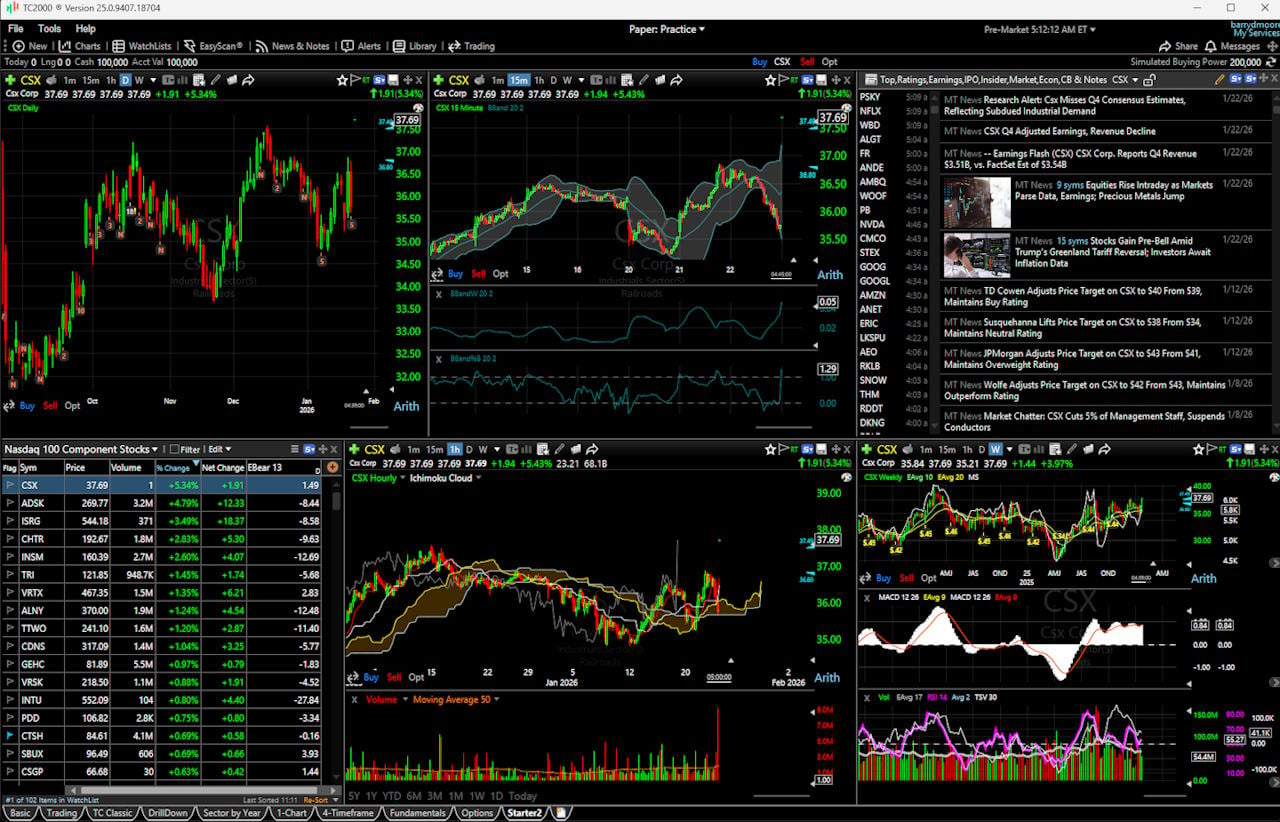
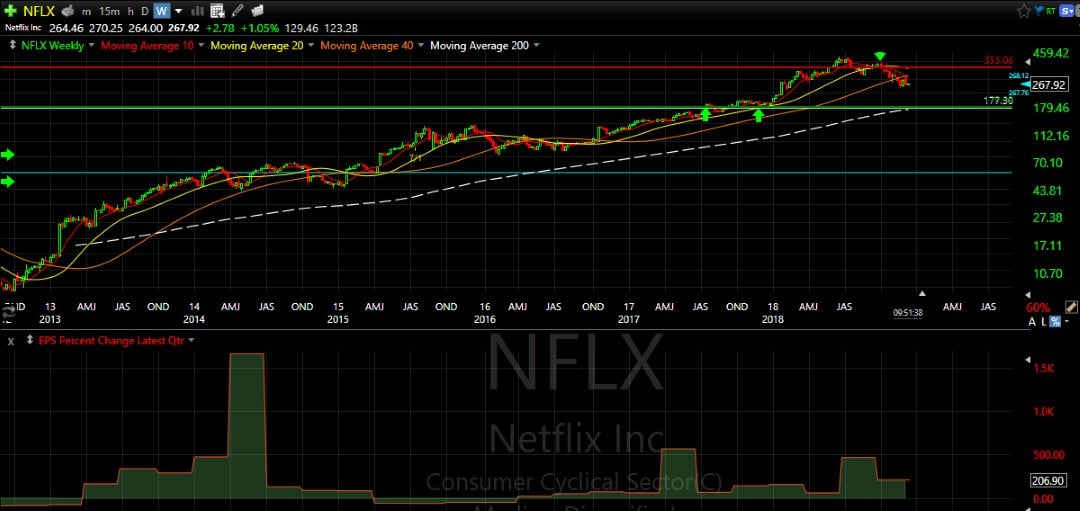
Here is a setup I use to find divergences in stock price and volume supply and demand; it is very reliable because it uses a mix of price, volume, and price/volume indicators.
All of these indicators are available in TC2000. The chart below shows the implementation.
- Parabolic Stop and Reverse (SAR) is a powerful indicator that shows trend direction and pivot points.
- Moving Averages 100, 50, 10 – the core of any analytics
- Ichimoku Cloud – an effective Japanese indicator
- Wilders Relative Strength Index (RSI)
- Chaikin Money Flow
- On Balance Volume
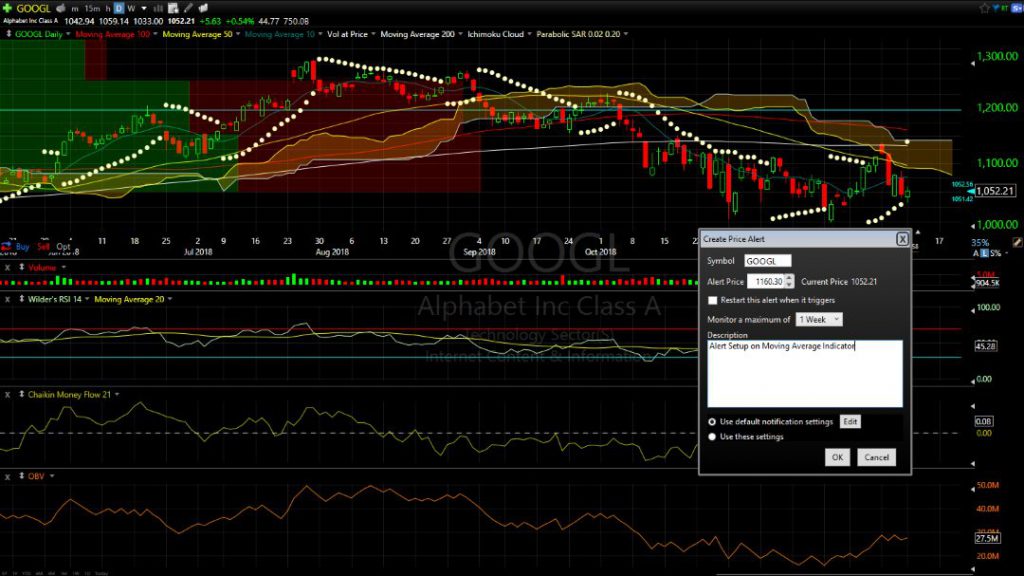
As you can see, you have a huge number of indicators and drawing tools to choose from in TC2000.
As you can see on the chart window, they have also introduced live alerts that you can configure to email or pop up if an indicator or trend line is breached. This is very useful indeed.
Chart Pattern Depth & Accuracy
Automated pattern recognition is only valuable when it does two things: covers enough patterns to matter and stays accurate enough that traders trust it. Many traders abandon pattern engines because they generate noise, over-trigger, or miss context.
TC2000 scores 2.58, slightly below the Median (2.73). The story here is not accuracy—TC2000’s accuracy score is solid (90%)—it’s breadth: the platform’s pattern library is relatively small and especially limited on trend/price patterns in this benchmark set.
| Metric | What It Measures | Calculation | TC2000 | High | Median | Low |
|---|---|---|---|---|---|---|
| Pattern Recognition Efficacy & Accuracy | Overall pattern automation | Avg depth + accuracy | 2.58 | 4.88 | 2.73 | 0.00 |
| Total Patterns | Pattern breadth | Count of patterns recognized | 20 | 226 | 57.5 | 0 |
| Pattern Recognition Depth | Breadth score | 0.33 points per pattern | 0.66 | 5.00 | 1.90 | 0.00 |
| Candle Patterns Recognized | Candlestick set | Count | 20 | 172 | 20 | 0 |
| Chart Price & Trend Patterns Recognized | Trend/price patterns | Count | 0 | 54 | 16 | 0 |
| Accuracy | Correctness | Percent accurate | 90% | 95% | 89% | 0% |
| Pattern Recognition Accuracy | Accuracy points | 0.05 per % accurate | 4.50 | 4.75 | 4.48 | 0.00 |
| Chart Pattern Recognition & Accuracy Test Winners | TrendSpider 4.88 | Trade Ideas 4.62 | TradingView 3.98 |
Scanning Performance
Scanning is where many traders win or lose time. A scanner needs two things: speed (so it updates when the market changes) and depth (so you can express your strategy conditions). A scanner that’s fast but shallow is a toy; a scanner that’s deep but slow is frustrating.
TC2000 scores 4.32 vs the Median (3.38). The key datapoints: strong raw scan speed (157ms) and high-quality criteria depth (276 criteria) with custom-code scanning supported.
| Metric | What It Measures | Calculation | TC2000 | High | Median | Low |
|---|---|---|---|---|---|---|
| Market Scanning Latency & Depth | Overall scanning capability | Avg speed + criteria + code | 4.32 | 5.00 | 3.38 | 0.80 |
| Scanner Performance (ms) | Raw scan time | S&P 500 across 5 criteria | 157ms | 2500ms | 300ms | 7ms |
| Scanning Speed (Points) | Speed score | Threshold scoring | 4.50 | 5.00 | 4.00 | 1.00 |
| Scanner Auto-Refresh Rate (seconds) | Refresh cadence | Not scored (context) | 1s | 60s | 1s | 0s |
| Scanning Criteria Count | Strategy expressiveness | Total criteria fields | 276 | 675 | 200 | 30 |
| Scanning Criteria & Depth (Points) | Criteria score | 0.0125 points per criterion | 3.45 | 5.00 | 2.50 | 0.80 |
| Custom Code Scanning | Programmability | Exists = 5 points | 5.00 | 5.00 | 5.00 | 0.00 |
| Scanning Performance Test Winners | Stock Rover 5.00 | TradingView 4.83 | TrendSpider 4.67 |
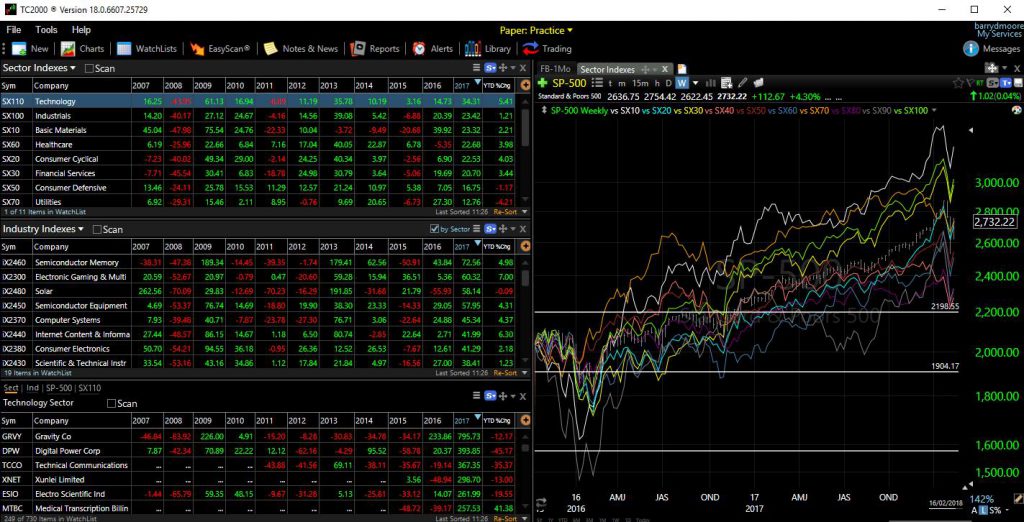
Make no mistake: TC2000 is a power player if you want real-time fundamental stock screening layered with technical screens, all integrated into live watch lists connected to your charts.
I selected TC2000 as my tool of choice back in 1999 because it offered the best implementation of fundamental scanning, filtering, and sorting available on the market. Twenty years later, they are still a leader in this section.
They offer a huge selection of fundamentals to choose from—192, to be exact—but even better than that, what makes it truly unique is the fact that you can, with a few clicks, create your own indicators based on the fundamentals.
You can then overlay the indicators directly on the charts, opening up a new world of technical and fundamental analysis. Again, TC2000 gets 10 out of 10.
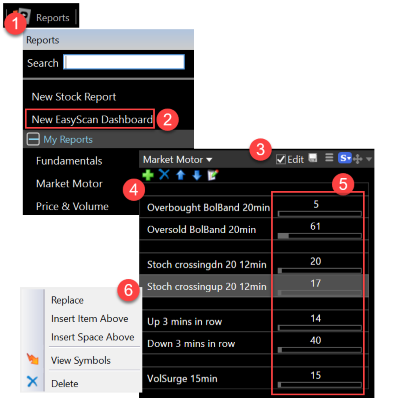
My Tested Scan & Watchlist Setup
TC2000 is solid for scanning the entire market in a few seconds to find the best fundamental setups for any company.
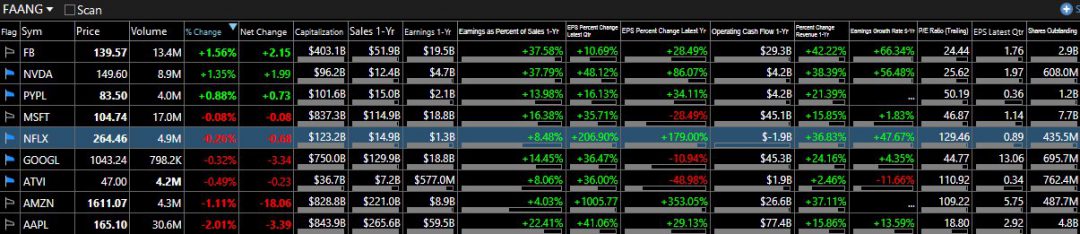
Key TC2000 Stock Screener Criteria to Find High-Growth Companies:
- Earnings as Percent of Sales 1-Year
- EPS Percent Change Latest Quarter
- EPS Percent Change Latest Year
- A Positive Operating Cash Flow
- Percent Change in Revenue 1 Year
- Earnings Growth Rate 5 Years
- Trailing EPS
- Shares Outstanding
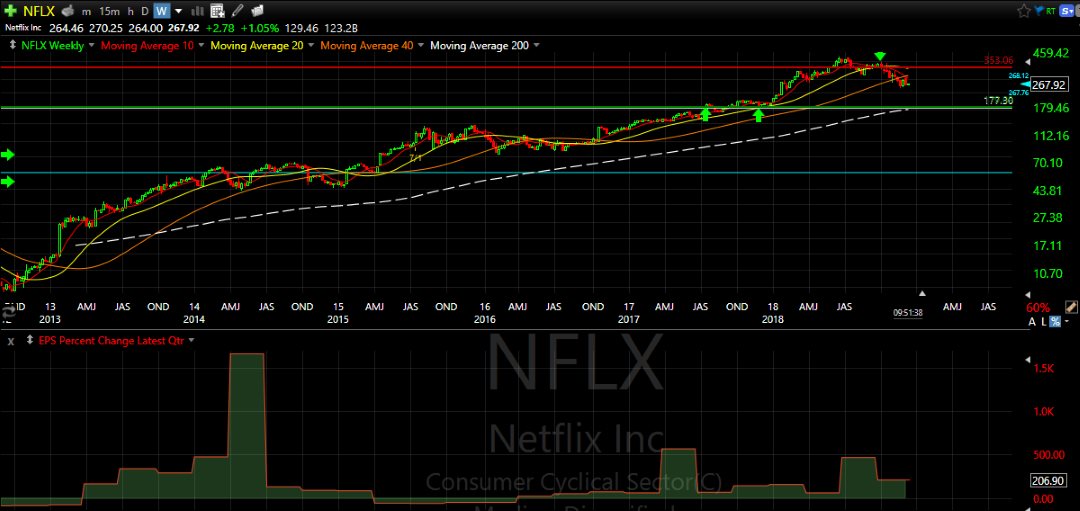
Plotting Fundamental Indicators As Stock Chart Indicators.
The chart below shows you how to plot over 129 fundamental variables from the balance sheet, income statement, and financial performance onto a chart. According to the classic William O’Neil book “How To Make Money In Stocks,” the C from the CANSLIM method stands for current earnings. This fundamental criterion, along with many others, is easily plotted in TC2000.
Backtesting Performance
Backtesting is the difference between “I think this works” and “I have evidence this works.” In my benchmarks, this category evaluates speed, no-code testing availability, coded testing, reporting quality, and whether you can test baskets/portfolios.
TC2000 scores 0.00 versus the Median (3.38). For the reader, this has a clear implication: TC2000 is not the tool you choose if your process depends on validating strategies with historical simulation. It can still be excellent as an execution and scanning platform—but you’ll need another tool for strategy research.
| Metric | What It Measures | Calculation | TC2000 | High | Median | Low |
|---|---|---|---|---|---|---|
| Quantitative Backtesting Fidelity | Overall backtesting depth | Avg of 5 sub-scores | 0.00 | 4.90 | 3.38 | 0.00 |
| Backtesting Speed (ms) | Raw simulation speed | 10y daily / 2m 5-min | – | 6000ms | 302ms | 7ms |
| Backtesting Speed (Points) | Speed points | Threshold scoring | 0.00 | 5.00 | 4.25 | 0.00 |
| No Coding Required | No-code testing | 5 points if yes | 0.00 | 5.00 | 5.00 | 0.00 |
| Flexible Coding Backtesting | Coded testing | Exists = 5 points | 0.00 | 5.00 | 5.00 | 0.00 |
| Backtesting Report Quality (Points) | Reporting depth | 0.05 per 1% criteria | 0.00 | 5.00 | 2.25 | 0.00 |
| Multi-Stock Basket Backtesting | Portfolio simulation | Exists = 5 points | – | 5.00 | 5.00 | 0.00 |
| Backtesting Performance Test Winners | Optuma 4.94 | TrendSpider 4.88 | MetaStock 4.81 |
In Context: My audit notes reinforce what the score says: TC2000 is optimized for live workflows. If your edge requires rigorous testing, treat TC2000 as the “trading workstation,” and run research elsewhere.
If you want to perform powerful stock backtesting or trading automation, then TC2000 is not for you. The platinum service includes historical condition testing and scan results, which are not the same as real backtesting.
Trading Bot & Auto-Trading Reliability
This category is about how safely and realistically a tool supports automation—ranging from “alerts only” to “native execution,” plus the sophistication of the strategy engine and operational reliability signals.
TC2000 scores 3.00 vs Median 2.50. The nuance matters: TC2000 can support condition-driven execution workflows, but it is not a “bot platform” in the modern sense (webhook ecosystems, bot orchestration, AI-native execution).
| Metric | What It Measures | Calculation | TC2000 | High | Median | Low |
|---|---|---|---|---|---|---|
| Automated Execution & Bot Reliability | Automation readiness | Sum of sub-metrics | 3.00 | 4.50 | 2.50 | 0.00 |
| Automation Path | How automation is executed | 0–2 rubric | 2.0 | 2.0 | 1.0 | 0.0 |
| Strategy/Bot Sophistication | Logic depth | 0–2 rubric | 1.0 | 2.0 | 1.5 | 0.0 |
| Operational Assurance | Reliability posture | 0–1 rubric | 0.0 | 1.0 | 0.0 | 0.0 |
| Bot & Auto-Trading Reliability Test Winners | TrendSpider 4.50 | Trade Ideas 4.00 | Tickeron 4.00 |
TC2000’s best automation use case is “structured execution,” where you still control the process and reduce mistakes—not hands-off bot farming. For many traders, that’s the safer and more sustainable approach.
AI & Algo Index
AI & Algo Index distinguishes three things: (1) algorithmic depth, (2) presence of an AI layer, and (3) transparency/validation. The practical question for readers is: Does the tool help you generate better decisions (and can you trust how it got there)?
TC2000 scores 1.50 vs Median 2.00. That’s exactly what you’d expect from a deterministic, trader-centric platform: it has logic and scripting, but no meaningful AI layer as a core capability.
| Metric | What It Measures | Calculation | TC2000 | High | Median | Low |
|---|---|---|---|---|---|---|
| Algorithmic Intelligence & AI Tier Index | Overall AI/algo tier | Algo depth + AI + transparency | 1.50 | 5.00 | 2.00 | 1.00 |
| Algo Depth | Strategy/model depth | 0–2 rubric | 1.0 | 2.0 | 1.5 | 1.0 |
| AI Layer | AI presence | 0–2 rubric | 0.0 | 2.0 | 0.0 | 0.0 |
| Transparency | Explainability | 0–1 rubric | 1.0 | 1.0 | 1.0 | 0.0 |
| AI & Algo Index Test Winners | TrendSpider 5.00 | Trade Ideas 4.50 | Tickeron 4.50 |
In Context: My audit notes frame this as a design choice: TC2000 is built for traders who want deterministic tools and personal control. If you specifically want AI-driven discovery, TC2000 isn’t built to compete there.
Alert Speed
TC2000 scores 4.00 vs Median 3.67—a meaningful edge for active traders. The platform supports a high concurrent alert capacity (1,000) and a practical mix of delivery options, which is what you need if alerts are central to your workflow.
| Metric | What It Measures | Calculation | TC2000 | High | Median | Low |
|---|---|---|---|---|---|---|
| Alert Trigger Latency & Delivery Speed | Overall alert utility | Avg of 3 scores | 4.00 | 4.67 | 3.67 | 2.30 |
| Concurrent Alerts | Capacity score | 1 point per 50 (max 5) | 5.00 | 5.00 | 5.00 | 5.00 |
| Concurrent Alert Count | Raw capacity | Count / Unlimited | 1000 | 2000 | 875 | 400 |
| Alert Streams Richness | Delivery breadth | 1 point per stream (max 5) | 3.00 | 5.00 | 2.00 | 1.00 |
| Alert Speed Rating | Practical speed | 0–5 rating | 4.00 | 5.00 | 3.00 | 1.00 |
| Alert Speed Test Winners | TradingView 4.67 | TrendSpider 4.33 | Benzinga Pro 4.33 |
Broker Connectivity & Ecosystem Depth
TC2000 scores 2.73, above the Median (2.00). The headline nuance: TC2000 strongly supports live trading, but its breadth of broker integration is limited compared to ecosystem-heavy platforms.
| Metric | What It Measures | Calculation | TC2000 | High | Median | Low |
|---|---|---|---|---|---|---|
| Asset & Data Coverage Index | Overall connectivity | Avg of scored sub-metrics | 2.73 | 5.00 | 2.00 | 0.67 |
| Live Trading | Can execute trades | 5 points if yes | 5.00 | 5.00 | 5.00 | 0.00 |
| Total number of brokers integrated | Broker breadth | Raw count | 2 | 1200 | 2 | 0 |
| Broker Integration | Broker depth score | 0.1 point per broker (max 5) | 0.20 | 5.00 | 0.20 | 0.00 |
| Asset & Data Coverage | Market breadth | Stocks/Options/FX/US/Intl | 3.00 | 5.00 | 2.00 | 2.00 |
| Broker Connectivity & Ecosystem Test Winners | TradingView 5.00 | MetaTrader 5.00 | TrendSpider 4.43 |
In Context: TC2000 is a clean execution workflow rather than a broker marketplace. If you already have a preferred broker path, that can be enough. If you constantly switch brokers or require broad routing, this won’t be a strength.
TC2000 Brokerage charges $1 per trade, which is pricier than Firstrade’s free stock trades. This service means a tight integration between the charting software and the brokerage house. Essentially, it means the holy grail, trading directly from charts visually.
Worden Brothers makes a clean sweep regarding trade management with full Broker Integration (if you choose them as your broker).
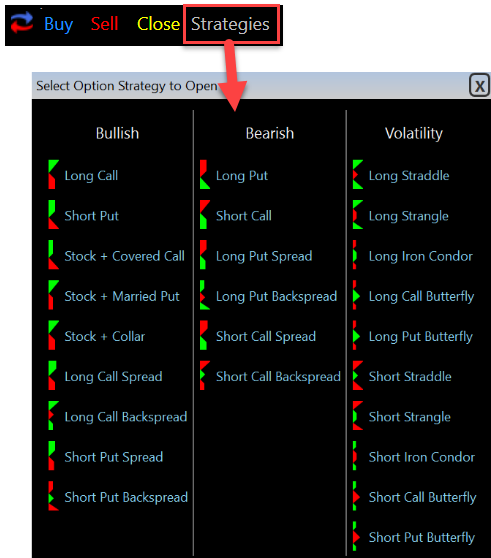
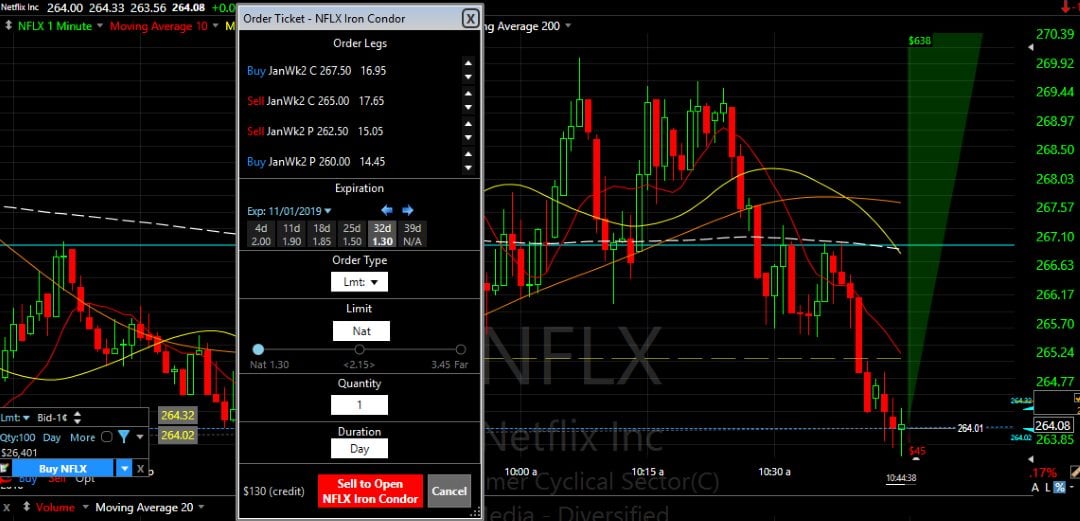
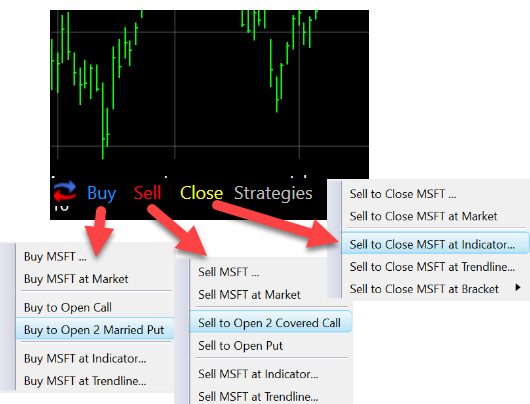
Options Strategies
Use the Options Trading button at the top of the chart to open Options Strategy tickets directly on the chart. The menu divides strategies into bullish, bearish, and volatility categories. Strategies include single-leg, multi-leg, and combinations of the underlying stock.
Multi-leg strategies then open as a single trading ticket on the chart.
TC2000 also offers a nice implementation of options trading and integration; you can scan and filter for many options strategies, then execute and follow them directly from the charts.
Good profit-and-loss tracking and reporting rounds out the package as a well-implemented solution.

Live Trading
The image below shows how well-planned the order execution is, as shown in the chart. You can open an order and execute it based on many conditions.
The interesting thing is that conditions can be any technical or fundamental criteria. So, you could theoretically execute a trade if the last quarter’s EPS exceeds 35%. Alternatively, execute a trade as the real-time price breaks through the Ichimoku cloud on higher volume.
The possibilities are limitless and mind-boggling.
Financial News Speed & Depth
News tools matter when catalysts move the price. This category measures whether the platform can deliver news in a way that’s usable for trading: alerts, filtering, watchlist relevance, and speed relative to primary wires.
TC2000 scores 3.50, well above Median (2.30). It’s not a wire terminal, but it has MT Newswire, which is meaningfully better than platforms where news is effectively an afterthought.
| Metric | What It Measures | Calculation | TC2000 | High | Median | Low |
|---|---|---|---|---|---|---|
| Financial News Speed & Quality Rating | News trading utility | Weighted rubric | 3.50 | 5.00 | 2.30 | 0.00 |
| Seconds of delay vs primary wires | Raw speed range | App vs wire feeds | 20s–60s | < 1s | 60s–120s | Hours/Days |
| Financial News Speed & Depth Test Winners | MetaStock 5.00 | Benzinga Pro 5.00 | Scanz 5.00 |
In Context: TC2000’s news value is “workflow integration”—useful context and filtering rather than ultra-low-latency scalp triggers. If you trade earnings reactions, upgrades/downgrades, or catalyst breakouts, this category matters.
TC2000 includes MT Newswire, a real-time news service, with the Premium Plus service. This is a reliable “close to real-time news” service. If real-time news is critical, you may want to look at Benzinga PRO or MetaStock R/T integration.
Community Utility Index (CUI)
Community is not about popularity—it’s about whether the community produces usable IP: scans, layouts, strategies, code, and practical workflow improvements. A strong community can reduce learning time and improve execution quality.
TC2000 scores 3.50, above Median (3.25). The community is stable and useful, but it’s not the kind of “massive open-source signal ecosystem” that scripting-social platforms dominate.
| Metric | What It Measures | Calculation | TC2000 | High | Median | Low |
|---|---|---|---|---|---|---|
| Community Utility Index | Overall community value | Avg size + contribution | 3.50 | 5.00 | 3.25 | 1.80 |
| Active Community Size | Crowd density | 0–5 scale | 3.50 | 5.00 | 3.00 | 2.00 |
| Quality of Community Contribution | Practical IP quality | 0–5 scale | 3.50 | 5.00 | 3.50 | 1.50 |
| Community Utility Index Test Winners | TradingView 5.00 | MetaTrader 5.00 | Trade Ideas 4.75 |
In Context: TC2000’s community value as “legacy bulletin boards” with experienced user guidance. If you want a community that ships constant new code/strategies, other ecosystems are stronger.
Support Infrastructure & SLA Audit
Support is an underrated trading edge: it reduces operational risk. When tools break during market hours, support quality determines whether you lose minutes, hours, or days.
TC2000 scores 5.00, decisively above Median (3.75) and at the top of the benchmark set. This is one of the clearest “trust” signals in my dataset.
| Metric | What It Measures | Calculation | TC2000 | High | Median | Low |
|---|---|---|---|---|---|---|
| Support SLA Audit: Time-to-Human Benchmarks | Overall support posture | Avg channels + response | 5.00 | 5.00 | 3.75 | 1.00 |
| Support Communication Channels | Access scale | 0–5 rubric | 5.00 | 5.00 | 3.50 | 1.00 |
| Support Response Times | Time-to-human | 0–5 rubric | 5.00 | 5.00 | 4.00 | 1.00 |
| Stated SLA & Tested Outcomes | Real-world outcome | Raw stated/tested | < 15 Minutes | – | – | – |
| Support Infrastructure & SLA Audit Winners | TrendSpider 5.00 | TC2000 5.00 | ThinkorSwim 4.75 |
In Context: This a practical buying reason: if you’re an active trader, the cost of bad support is not annoyance—it’s missed trades, broken alerts, and avoidable operational losses.
Support is excellent on the forums, via email, or on the phone. When you call, you will get straight through to skilled personnel in the US; I have never had an issue that was not resolved more or less immediately.
Summary
TC2000 is a first-class technical analysis and stock market screening platform. Its mature service offers a good selection of stock charts, indicators, and fundamental scanning tools. Voted Best Software by Stock & Commodities magazine for 25 years straight, it is a great option for US investors.
Compare to Similar Products
Our tests show that TC2000 lacks many AI and pattern recognition features compared to TradingView, TrendSpider, MetaStock, and Trade Ideas. TC2000 is better for options trading. TrendSpider is better for automated stock chart analysis, backtesting, and automated bot trading. Stock Rover is better than TC2000 for long-term growth, dividends, and value investors. Trade Ideas is better for AI-driven robotic day trading.
| Features? | TC2000 | TradingView | TrendSpider | Trade Ideas | MetaStock |
| Rating | 4.2 | 4.75 | 4.71 | 4.50 | 4.40 |
| Global Market Data | ✘ | ✔ | USA | USA | ✔ |
| Powerful Charts | ✔ | ✔ | ✔ | ✘ | ✔ |
| Stocks | ✔ | ✔ | ✔ | ✔ | ✔ |
| Futures | ✘ | ✔ | ✔ | ✘ | ✔ |
| Forex | ✘ | ✔ | ✔ | ✘ | ✘ |
| Cryptocurrency | ✘ | ✔ | ✔ | ✘ | ✘ |
| Options | ✔ | ✘ | ✔ | ✘ | ✔ |
| Social Community | ✘ | ✔ | ✘ | ✔ | ✘ |
| Real-time News | ✘ | ✘ | ✘ | ✘ | ✔ |
| Screeners | ✔ | ✔ | ✔ | ✔ | ✔ |
| Backtesting | ✘ | ✔ | ✔ | ✔ | ✔ |
| Code-Free Backtesting | ✘ | ✘ | ✔ | ✘ | ✘ |
| Automated Analysis | ✘ | ✔ | ✔ | ✔ | ✔ |
FAQ
What is TC2000?
TC2000 is an award-winning stock market charting, scanning, and technical analysis software. It provides traders and investors with a wide range of tools to analyze the stock market and identify potential investment opportunities.
How much does TC2000 cost?
TC2000 has four levels of service: Free, Silver, Gold, and Platinum, each with different features and costs. Prices range from $9.99 to $59.99 per month. These prices drop 25% with a 2-year subscription.
Does TC2000 offer real-time data?
Yes, TC2000 offers real-time data, but it comes with an additional cost of at least $9.99/mo. The price depends on the exchanges you want to access.
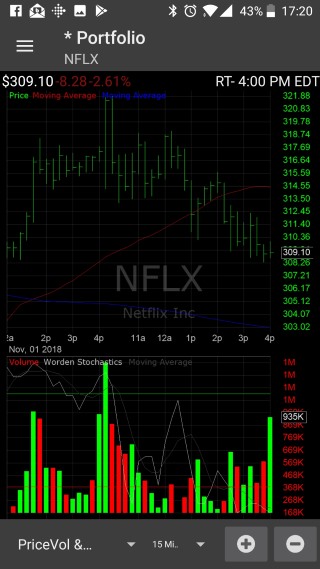
Can I use TC2000 on my mobile device?
Yes, TC2000 has a mobile app available for Android devices, but not IOS. However, you can access your charts, watchlists, and scans from any mobile device using "TC2000 Mobile" and the "Parallels" emulator software.
What kind of technical analysis tools does TC2000 offer?
TC2000 offers a variety of technical analysis tools, including trendlines, Fibonacci retracements, moving averages, Bollinger Bands, MACD, RSI, and fully customizable indicators with the Gold service.
Can I create custom scans in TC2000?
Yes, one of the key features of TC2000 is its powerful scanning engine "EasyScan." You can create custom scans using over 200 pre-set conditions or create your own.
Does TC2000 offer training or support?
Yes, TC2000 offers comprehensive training resources, including video tutorials, webinars, and a detailed user guide. They also have a responsive customer support team based in the USA.
Can I paper trade with TC2000?
Yes, TC2000 includes a paper trading function in the Silver service, allowing you to practice trading strategies without risking real money.
How many symbols can I add to a TC2000 watchlist?
You can add up to 1,000 symbols in a single watchlist in TC2000, providing ample scope to track a wide range of stocks.
Can I use TC2000 for options trading?
Yes, TC2000 specializes in options trading and analysis. You can chart, scan, plan, and trade complex options strategies directly from the charts.
Does TC2000 provide alerts?
Yes, TC2000 allows you to set price, indicator, and option alerts that can notify you via pop-up or email. With the Gold service, you get 100, and the Platinum 1,000 alerts.
Can I customize charts in TC2000?
Yes, TC2000 offers highly customizable charts, layouts, and scans. You can adjust the timeframe, chart type, indicators, scaling, and colors.
What data feeds are available in TC2000?
TC2000 provides real-time data from all major US exchanges and includes options and MT news feeds at an extra cost.
Is there a free version of TC2000?
Yes, TC2000 offers a free version that provides delayed data, charts, and basic scans. The free version is limited in features and does not include real-time data or options analysis. However, it's great for getting started with the platform.
What version of TC2000 do I need to export a text file of fundamental data such as symbol, dividend or earnings ?
Hi george, TC2000 only allows you to export the tickers. The best sw to export fundamentals is stockrover. https://www.liberatedstocktrader.com/stock-rover-review-screener-value-investors/
Does the system has “Time Series Forcast” as one of the technical indicators?
Hi Steve, yes it certainly does, I just checked and I can confirm