Imagine having a trading platform that does all the charting, scanning, backtesting, and thinking for you. That’s exactly what TrendSpider does.
My testing awards Trendspider 4.72 due to its innovation. Its powerful algorithms automatically recognize trendlines, chart patterns, and candlesticks. It also has automated trading bots, real AI LLMs, and powerful point-and-click back-testing.
I have used TrendSpider for seven years to automate my chart technical analysis and develop cutting-edge trading strategies. I have backtested over 100 indicators and strategies with TrendSpider, and in this review, I share the results of my testing.
Composite Lab Performance Score
TrendSpider’s AAA 4.72 composite score places it well above the median tool (4.21) and close to the high benchmark (4.75).
In practical terms, this is what I expect from a platform that’s engineered around automated technical discovery + strategy workflow rather than being “just another charting package.”
| Metric | Calculation | TrendSpider | High | Median | Low |
|---|---|---|---|---|---|
| Composite Lab Performance Score (CLPS) | Average for all ratings + 5× Superpower Boost for Top 5 killer features | 4.72 | 4.75 | 4.21 | 2.93 |
| Composite Lab Performance Score (CLPS) Overall Test Winners | TradingView 4.75 | TrendSpider 4.72 | Trade Ideas 4.52 |
The composite result is carried by repeatable strengths that reduce real trading friction: pattern recognition depth/accuracy, scanning criteria depth, backtesting fidelity, AI/automation posture, alerts, and broker ecosystem coverage. The score is held back primarily by signal alpha and portfolio analytics depth.
TrendSpider Test Ratings & Verdict
My research reveals that TrendSpider is an excellent choice for US traders seeking AI-driven tools for charting, pattern recognition, and backtesting across stocks, indices, futures, and currencies. The platform stands out by automatically detecting trendlines, Fibonacci levels, and candlestick patterns. With its robust backtesting capabilities and multi-timeframe analysis, TrendSpider is particularly well-suited for seasoned technical traders looking to refine their strategies.
| Test | Tier | Score | Average |
|---|---|---|---|
| Composite Lab Performance Score | AAA | 4.72 | 4.21 |
| Pricing Index: $ per Day | A | $2.70 | $2.74 |
| Value Score (VP) | A | 4.17 | 2.82 |
| Speed & Ease of Use | AA | 4.67 | 4.50 |
| Chart Analysis Depth Index | A | 4.03 | 3.17 |
| Chart Pattern Depth & Accuracy | AAA | 4.88 | 2.73 |
| Scanning Performance | AA | 4.67 | 3.38 |
| Backtesting Performance | AAA | 4.88 | 3.38 |
| Trading Bot & Auto-Trading Reliability | AA | 4.50 | 2.50 |
| AI & Algo Index | AAA | 5.00 | 2.00 |
| Alert Speed | AA | 4.33 | 3.67 |
| Trade Signal Quality | C | 0.00 | 0.00 |
| Broker Connectivity & Ecosystem Depth | AA | 4.43 | 1.55 |
| Portfolio Tool Performance | C | 2.10 | 2.80 |
| Financial News Speed & Depth | AA | 4.50 | 2.30 |
| Community Utility Index (CUI) | B | 3.75 | 3.25 |
| Support Infrastructure & SLA Audit | AA | 4.50 | 3.75 |
Tested using rating system V3.
See the 2026 v3 58-point TrendSpider test and benchmarking.
Pros
✔ 150+ chart and candle patterns recognized
✔ True AI Model Training & Deployment
✔ AAA Point-and-click backtesting
✔ Auto-trading bots
✔ Multi-timeframe analysis
✔ Real-time data included
✔ US Stocks, ETFs, Forex, Crypto, & Futures
✔ Seasonality charts, options flow
✔ News & analyst ratings change scanning
✔ 1-on-1 training included
Cons
✘ Not ideal for value or dividend investors
✘ No social community or copy-trading
✘ Limited portfolio management tools

TrendSpider stands out by leveraging AI and machine learning to streamline traders’ workflow, bringing automated trend and pattern recognition to the forefront. With TrendSpider, traders gain access to advanced analysis and strategy-testing capabilities, surpassing manual efforts in both scale and efficiency.
| ⚡ Features ? | Charts, Watchlists, Screening, Free Real-time Data |
| 🏆 Unique Features ? | AI Automated Trendlines, Fibonacci, Candlestick Pattern Recognition, Auto-Bot Trading, Code-free Powerful Backtesting, Launch and Train Personal AI Models with Strategy Lab. |
| 🎯 Best for | Stock, Options, FX & Crypto Traders |
| ♲ Subscription | Monthly, Yearly |
| 💰 Price | $54 | $214 |
| 💻 OS | Web Browser |
| 🎮 Trial | ❌ |
| ✂ Discount | Code "LST30" for 30% to 63% Off |
| 🌎 Region | USA |
Save 38% to 45% on TrendSpider
Our Top Rated 4.72 ⭐ Trading Tool
✅ Leader in AI Trading & Chart Pattern Recognition
✅ Scanning & Auto-Trading
Deal Ends In:

Trendspider is innovative and stands out in the crowded stock chart analysis software market. It solves the problem of spending too much time analyzing, drawing trendlines, tweaking indicators, and evaluating timeframes.
TrendSpider’s most powerful features are automated candlestick, trendline, and chart pattern recognition. Point-and-click backtesting and strategy development automatically plot buy and sell signals onto the chart. TrendSpider now has financial news, analyst estimates, rating changes, insider trading, and seasonality charts. Finally, the AI-powered trading assistance and automated trading Bot execution are the icing on the cake.
TrendSpider is arguably the most complete trading software on the market today.
What is TrendSpider?
TrendSpider is an innovative trading software company founded by Dan Ushman in 2016 to create a service that automates the technical analysis of stock charts. Unlike anything I have seen before, TrendSpider employs artificial intelligence to detect trends not seen by humans. I have met Dan and his team, and I can assure you this platform is the most innovative in the industry, led by a man with great integrity.
Pricing Index
TrendSpider gets an A rating for $/per day, costing $2.70. This is just below the median competitor cost of $2.74, but way below the most expensive tool at $9.99/day.
TrendSpider’s heavier computation (auto trendlines, multi-timeframe logic, automation features) explains why it rarely competes as the “cheap utility” option. The value here is less about price and more about replacing manual chart work with automated discovery. This means you get an exceptional tool for slightly less than the average price of all other software.
| Metric | Calculation | TrendSpider | High | Median | Low |
|---|---|---|---|---|---|
| Cost-per-day | $/day on an annual plan. Minimum viable plan with real-time exchange data | $2.70 | $9.99 | $2.74 | $0.74 |
| $ per feature | Effective Monthly Cost / Total Features | $5.47 | $23.37 | $5.95 | $1.94 |
| Effective Monthly Cost (EMC) | EMC = (Plan price + required real-time data fees + any required add-ons) / month | $82.00 | $303.87 | $83.82 | $22.50 |
All TrendSpider plans include real-time data, futures, AI-powered pattern recognition, backtesting, news, options, crypto, and even automated bot trading with broker integration.
- The Standard plan gives access to all features for $82 per month, which drops to $54 if you pay yearly.
- I recommend Premium, which costs $137 and drops 44% to $91 if you pay yearly.
- Adding our partner code LST30 during checkout will save an additional 30% on your first year.
| TrendSpider Pricing | Monthly | Monthly on Annual Plan |
| Standard (Casual Traders) | $82 | $54 |
| Premium (Active Traders) | $137 | $91 |
| Enhanced (Scalpers & Day Traders) | $197 | $122 |
| Advanced (Quants & Institutions) | $321 | $214 |
| Additional Year 1, 30% Discount | -30% With Code LST30 | |
TrendSpider Coupon Code Discount
Trendspider discount coupon code “LST30” is verified and valid, granting a 30% discount on all plans. Use coupon code “LST30” at checkout.
Using this coupon on a TrendSpider monthly subscription could save you over $2,400.
- Read this article for a step-by-step guide to claiming your 30% TrendSpider discount.
Value Score (VP)
TrendSpider posts a A 4.17 Value Score versus a 2.82 median, which tells me the platform’s capability quality and breadth justify its category-leading composite score—even if it’s not the cheapest.
TrendSpider’s “feature quality” win is the headline: fewer gimmicks, more purposeful automation. It loses the overall VP crown mainly because TradingView combines very high breadth + depth with full device coverage.
| Metric | Calculation | TrendSpider | High | Median | Low |
|---|---|---|---|---|---|
| Value Score (VP) | Sum of Feature Quality (60% Weight), Feature Depth (30%) & Device Support Depth (10%) | 4.17 | 4.37 | 2.82 | 1.70 |
| Value Rank | Percentile Ranking | 4.75 | 5.00 | 2.50 | 1.00 |
| Feature Quality | Average of All Feature Quality Ratings | 4.16 | 4.16 | 2.97 | 2.00 |
| Feature Breadth | Feature richness (count of meaningful core features) | 15 | 17 | 12 | 9 |
| Feature Depth | Percentile Ranking | 4.25 | 4.75 | 3.00 | 1.00 |
| Device Support Depth | Web 2 points, (PC, Android/iOS/ 1 Point each) | 4.00 | 5.00 | 2.00 | 1.00 |
| Value Score Test Winners | TradingView 4.37 | TrendSpider 4.20 | Trade Ideas 4.05 |
Speed & Ease of Use
TrendSpider scores AA 4.67, ahead of the 4.25 median, and that’s the “fast” outcome for a tool that does heavy math (automation engines) without making the interface feel slow.
| Metric | Calculation | TrendSpider | High | Median | Low |
|---|---|---|---|---|---|
| Speed & Use Index Rating | Avg of Time to Chart Performance, Multimonitor Chart Speed & 3 Click Rule: Ease of Use | 4.67 | 5.00 | 4.50 | 3.30 |
| Time to Chart Speed (Seconds) | Seconds from clicking icon to loaded chart (200 bars + 2 indicators) | 2.36 | 17.03 | 4.70 | 1.60 |
| Time to Chart Performance | Points (<5s=5; <10=4.5; <15=4; <20=3) | 5.00 | 5.00 | 4.50 | 3.00 |
| Multi-Chart Latency (ms) | Delay when syncing 4 charts | 184 | 667 | 209 | 10 |
| Multimonitor Chart Speed | Multi-chart sync points | 4.00 | 5.00 | 3.50 | 0.00 |
| 3-Click Rule Test | Clicks to place a trade or launch a scan | 2 | 6 | 3 | 2 |
| 3 Click Rule: Ease of Use | 3-click points | 5.00 | 5.00 | 3.25 | 0.30 |
| Speed & Ease of Use Test Winners | TradingView 5.00 | Stock Rover 5.00 | Seeking Alpha 5.00 |
Customers can request free personal training sessions from the TrendSpider team, which are unique in the industry and help you get up to speed quickly.
TrendSpider’s innovations require a bit of time to understand what the software tells you. For example, seeing hourly, daily, and weekly trendlines plotted on the same chart might be confusing initially.
However, after applying a little effort, you might find you cannot live without them—still an excellent score on usability.
I have tested the customer support and confirmed it is excellent, and you have a human to chat with during US office hours.
Chart Analysis Depth Index
TrendSpider scores A 4.03, above the 3.17 median, driven by a balanced combination of chart types, indicator depth, and—critically—custom indicator capability.
TrendSpider’s differentiator is not “more chart types,” it’s what the platform does with the chart (automation overlays and multi-timeframe logic). Its scripting availability keeps it in the top tier, even if TradingView still leads on total depth and ecosystem scale.
| Metric | Calculation | TrendSpider | High | Median | Low |
|---|---|---|---|---|---|
| Chart Analysis Depth Index | Avg of Chart Depth, Indicator Depth & Custom Coding scores | 4.03 | 5.00 | 3.17 | 0.50 |
| Chart Types | Total count | 12 | 38 | 10 | 1 |
| Chart Depth | 0.3 points per chart type | 3.60 | 5.00 | 3.00 | 0.30 |
| Indicators | Total count | 140 | 400 | 116 | 0 |
| Indicator Depth | 0.025 points per indicator | 3.50 | 5.00 | 2.90 | 0.00 |
| Custom Indicator Coding | Available = 5 points | 5.00 | 5.00 | 2.50 | 0.00 |
| Chart Analysis Depth Index Test Winners | TradingView 5.00 | MetaStock 5.00 | Optuma 5.00 |
TrendSpider’s automated chart trendline detection and plotting do a better job than a human can; using algorithms, the system can detect thousands of trendlines and flag the most important ones with the highest backtested probability of success.
Multi-timeframe analysis means viewing multiple timeframe charts on a single chart with the trendlines plotted automatically. Another great feature is the advanced plotting of support and resistance lines into a subtly integrated chart heatmap.
| Technical Charting | Rank | Chart Types | Indicators |
| TradingView | #1 | 21 | 400 |
| MetaStock | #2 | 15 | 300 |
| TrendSpider | #3 | 12 | 140 |
| Finviz | #4 | 5 | 125 |
| Trade Ideas | #5 | 6 | 80 |
Packed with innovative technical analysis tools, TrendSpider is for serious market analysts because it helps you find trading opportunities quickly.
Chart Pattern Depth & Accuracy
This is TrendSpider’s flagship lab result: AAA 4.88, far above the 2.73 median, and essentially at the high watermark benchmark. In live workflows, this matters because it reduces the “manual grind” of finding and validating setups across many symbols/timeframes.
| Metric | Calculation | TrendSpider | High | Median | Low |
|---|---|---|---|---|---|
| Pattern Recognition Efficacy & Accuracy | Avg of Pattern Recognition Depth & Accuracy scores | 4.88 | 4.88 | 2.73 | 0.00 |
| Total Patterns | Count of unique patterns recognized | 226 | 226 | 57.5 | 0 |
| Pattern Recognition Depth | 0.33 points per pattern recognized | 5.00 | 5.00 | 1.90 | 0.00 |
| Candle Patterns Recognized | Count | 172 | 172 | 20 | 0 |
| Chart Price & Trend Patterns Recognized | Count | 54 | 54 | 16 | 0 |
| Accuracy | Percent accurate | 95% | 95% | 89% | 0% |
| Pattern Recognition Accuracy | 0.05 point per 1% accurate | 4.75 | 4.75 | 4.48 | 0.00 |
| Chart Pattern Recognition & Accuracy Test Winners | TrendSpider 4.88 | Trade Ideas 4.62 | TradingView 3.98 |
Automated Trendline Detection
TrendSpider’s automated trendline detection saves traders a lot of time, speeds up morning trade review preparation, and improves accuracy. Its algorithm correlates all the bars on a chart and draws the trendlines automatically, ready for your review.
As a technical analyst, this is how you should do it; the more times a price touches the trendline and reverses, the stronger the trend. Therefore, it is more predictive if a price breaks through strong support and resistance areas.
If you dislike a trend the AI has used, you can manually delete it or fine-tune it. This capability lets you quickly complete a trendline analysis on any chart.
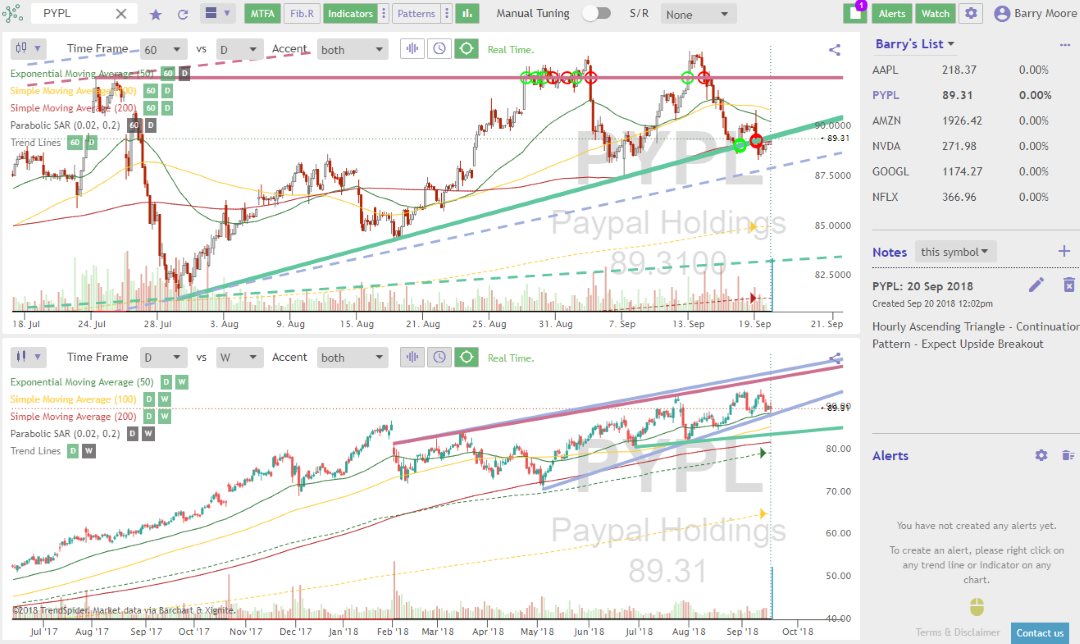
Using the drop-down selector “S/R Trends” enables a heat map, which shows hundreds of potential trendlines. The darker the red area, the more touches and concentration of trendlines there are. See the chart below for reference.
Multi-Timeframe Chart Analysis
It gets even more interesting here: the multi-timeframe analysis can superimpose trendlines or indicators from different timeframes onto a single chart. It may seem a little complex initially, but it makes sense when you get used to it. Instead of continually switching timeframes and redrawing trendlines, it is simply there.
The multi-timeframe analysis is not just for trendlines; it works with all stock chart indicators to ensure you do not miss anything. Dan Ushman, the company founder, uses it in his trading, especially with indicators like Bollinger Bands and trendlines that help expose things other traders miss when focused on one timeframe or indicator at a time.
I also like the price indicator analysis; you can let the application plot, name, and highlight your candlestick patterns of choice. Want to find Evening Doji Stars, Hammers, or Engulfing Patterns? Just turn on the pattern recognition; it is that easy.
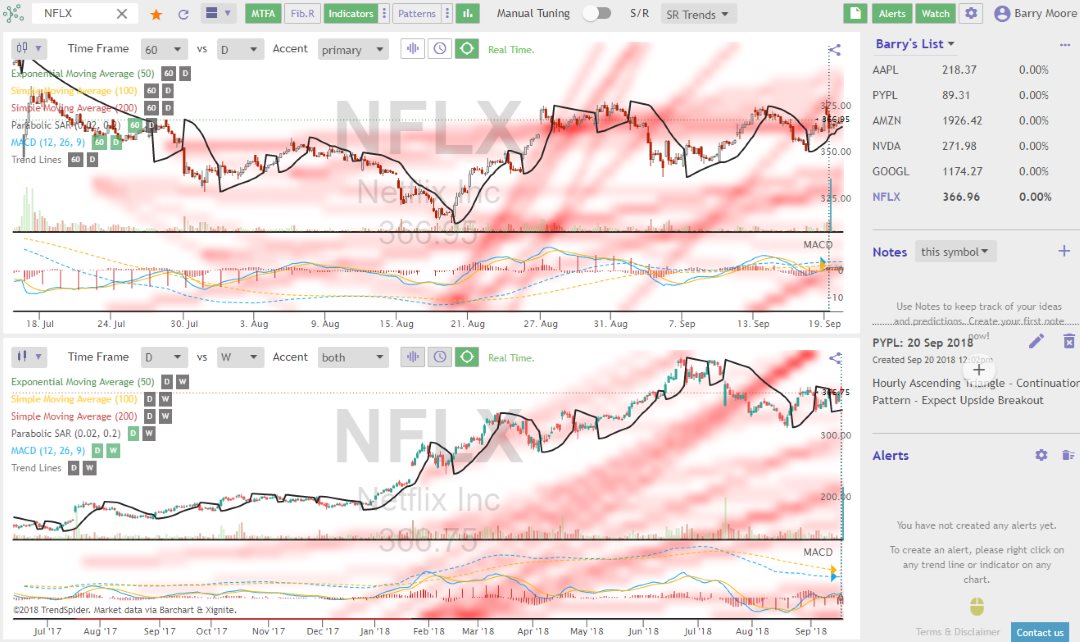
How Does Automatic Trendline Detection Work in TrendSpider?
To show the power of the software, I set up two charts. The top pane shows the 60-minute versus the daily chart, and the bottom pane shows the daily versus the weekly chart for Netflix (Ticker: NFLX). The first thing that grabbed my attention was that you could immediately see that Netflix’s shorter-term trend is an ascending triangle. This is a continuation pattern, so we expect the price to break out of the triangle upwards. Trendspider nailed the trendlines perfectly on this.
While reviewing the lower pane, you can see the trend for the last year, and Netflix is still in a solid uptrend on both the daily and weekly timeframes, with four timeframes compared in seconds.
Automatic Candlestick Pattern Recognition
As I mentioned, Trendspider is designed to do the hard work for you; if you want to use candlesticks correctly, you must learn hundreds of candlestick formations and understand if they are bullish or bearish.
Learning this can take years, or you can use TrendSpider to detect over 150 candlestick patterns automatically.
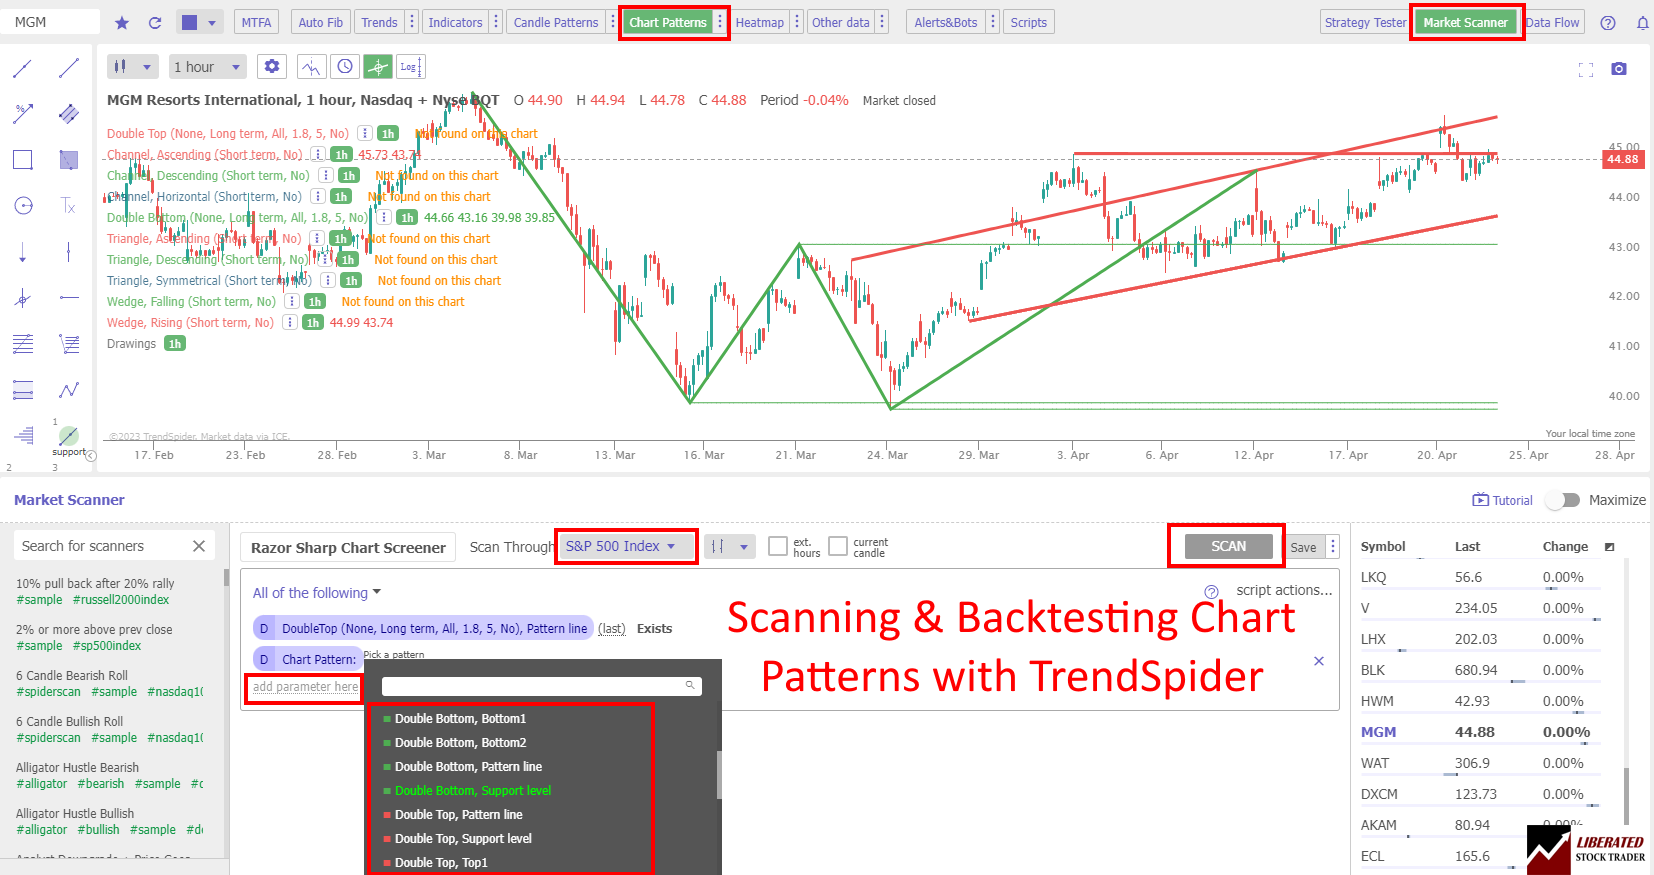
To enable candlestick pattern recognition in TrendSpider is easy. Click patterns, select your pattern, and click apply.
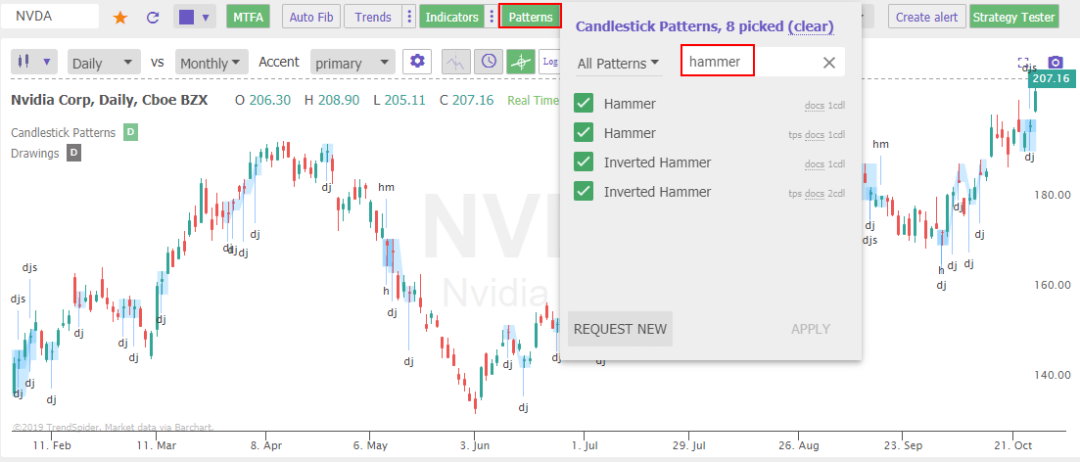
On the chart, you can see the annotated candlestick pattern DJ for Doji. Now, you do not need to spend months learning every pattern or spend hours on a chart trying to locate the patterns; it is all seamlessly done for you.
| Pattern Recognition Software | TrendSpider | TradingView | Finviz |
| # Candle Patterns Recognized | 172 | 44 | 11 |
| # Chart Patterns Recognized | 54 | 53 | 12 |
| Trendline Recognition | ✔ | ✘ | ✔ |
| Backtesting Patterns? | ✔ | ✔ | ✔ |
Table: TrendSpider vs. The Competition – Pattern Recognition. See the In-depth Best Pattern Recognition Software Review
Scanning Performance
TrendSpider scores AA 4.67, versus a median of 3.38. The key takeaway is that TrendSpider is very fast; it’s built for depth: criteria richness plus custom logic.
| Metric | Calculation | TrendSpider | High | Median | Low |
|---|---|---|---|---|---|
| Market Scanning Latency & Depth | Avg of Scanning Speed, Criteria & Custom Code scores | 4.67 | 5.00 | 3.38 | 0.80 |
| Scanner Performance (ms) | Milliseconds to scan S&P 500 across 5 criteria | 375 | 2500 | 300 | 7 |
| Scanning Speed (ms) | Points (<100=5; <200=4.5; <500=4; <1000=3; <2000=2) | 4.00 | 5.00 | 4.00 | 1.00 |
| Scanner Auto-Refresh Rate (seconds) | Auto-refresh speed (not scored) | — | 60 | 1 | 0 |
| Scanning Criteria & Depth | Total criteria count | 420 | 675 | 200 | 30 |
| Scanning Criteria & Depth | Points (0.0125 points per criteria) | 5.00 | 5.00 | 2.50 | 0.80 |
| Custom Code Scanning | Exists = 5 points | 5.00 | 5.00 | 5.00 | 0.00 |
| Scanning Performance Test Winners | Stock Rover 5.00 | TradingView 4.83 | TrendSpider 4.67 |
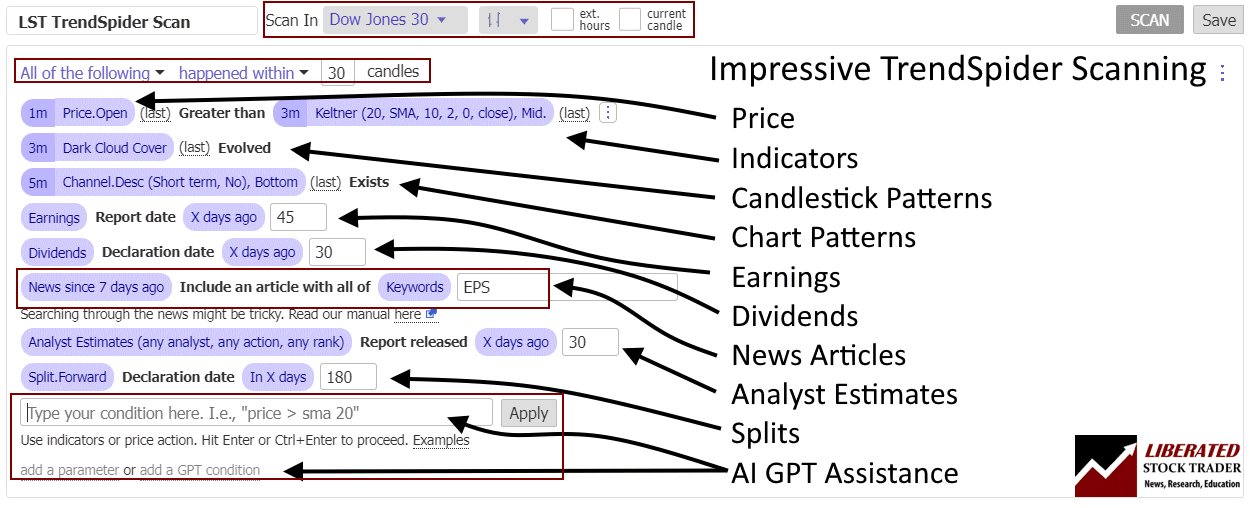
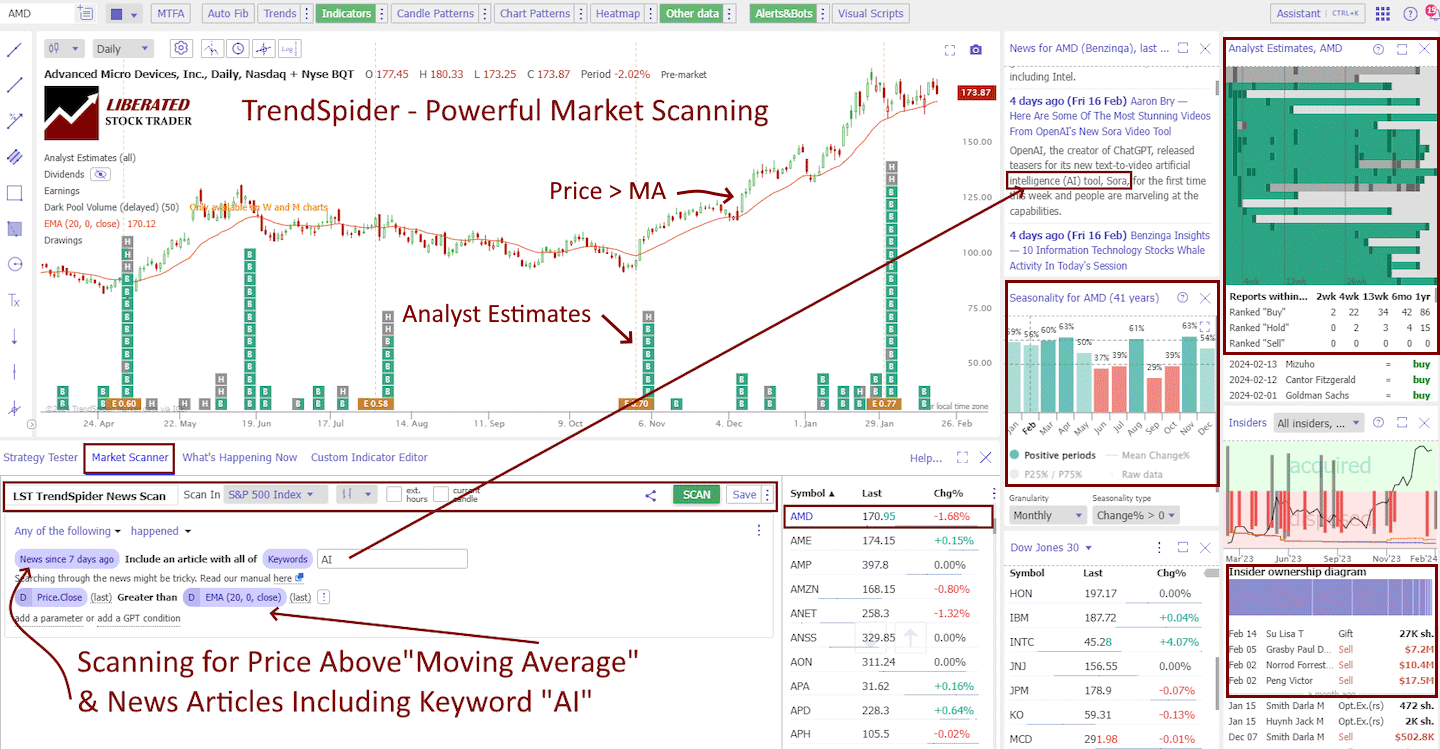
The Market Scanner enables you to scan a specific stock and the entire market for stocks that match your technical criteria; combining AI trend detection and analysis with the ability to scan the entire stock market is powerful.
TrendSpider wins due to its multilayered point-and-click scanning interface. It is so smart that it can scan for financials, chart patterns, analyst estimates, and even news events. TrendSpider scanning takes it to a new level.
Backtesting Performance
TrendSpider scores AAA 4.88, significantly above the 3.38 median, and close to the high benchmark. This category is about turning ideas into evidence without friction.
In my audit notes, TrendSpider is one of the clearest “no-code backtesting” leaders, and it pairs that with top reporting quality. It narrowly trails Portfolio123 on the composite only because Portfolio123 is a quant-first research environment, while TrendSpider is a trader-first automation platform.
| Metric | Calculation | TrendSpider | High | Median | Low |
|---|---|---|---|---|---|
| Quantitative Backtesting Fidelity | Avg of Speed, No-Code, Flexible Coding, Report Quality, Basket Backtesting | 4.88 | 4.90 | 3.38 | 0.00 |
| Backtesting Speed (ms) | Time to run 10y daily or ~2 months 5-min simulation | 167 | 6000 | 302 | 7 |
| Backtesting Speed | Points (<200=5; <500=4.5; <10000=4; <20000=3) | 4.50 | 5.00 | 4.25 | 0.00 |
| No Coding Required | Zero-code backtesting (5 points) | 5.00 | 5.00 | 5.00 | 0.00 |
| Flexible Coding Backtesting | Exists = 5 points | 5.00 | 5.00 | 5.00 | 0.00 |
| Backtesting Report Quality | Report quality percent | 100% | 100% | 70% | 0% |
| Backtesting Report Quality | Points (0.05 points per 1%) | 5.00 | 5.00 | 2.25 | 0.00 |
| Multi-Stock Basket Backtesting | If exists = 5 points | 5.00 | 5.00 | 5.00 | 0.00 |
| Backtesting Performance Test Winners | Optuma 4.94 | TrendSpider 4.88 | MetaStock 4.81 |
TrendSpider takes a unique approach to backtesting because the platform is built from the ground up to automate technical analysis. Therefore, backtesting is already built into the heart of the code.
The highest probability trendlines are automatically flagged, and you can adjust the algorithm’s sensitivity to show more or fewer lines.
They have also implemented an AI-powered strategy tester that allows you to type what you want to test freely, and the AI will do the coding for you. This smooth and simple implementation allowed me to develop a strategy in minutes.
Integrated backtesting of automated trendlines, showing win rate, profitability, and drawdown, is a new addition and warmly welcome; the team has propelled TrendSpider into one of the leading technical analysis packages in the industry.
| Backtesting Software? | Backtesting | No-Code Backtesting | Auto-Trading |
|---|---|---|---|
| TrendSpider | ✔ | ✔ | ✔ |
| Trade Ideas | ✔ | ✔ | ✔ |
| TradingView | ✔ | ✘ | ✔ |
| MetaStock | ✔ | ✘ | ✘ |
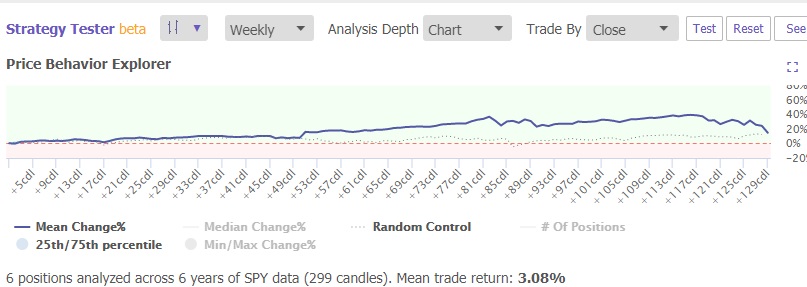
I like the ability to adjust your backtest conditions on the fly, and the “Price Behaviour Explorer” and “System Performance Chart” automatically update. You can jump into coding if you want to, but the key here is that you do not have to.
Ichimoku Cloud Analysis
The latest TrendSpider innovation is the multi-timeframe Ichimoku Cloud indicator. As a certified technical analyst, I have studied Ichimoku, so I was interested in testing its effectiveness and profitability when backtested.
In the chart below, you can see Ichimoku in action. I have plotted it on a weekly chart, but I am also using the multi-time-frame analysis to overlay the monthly data simultaneously.
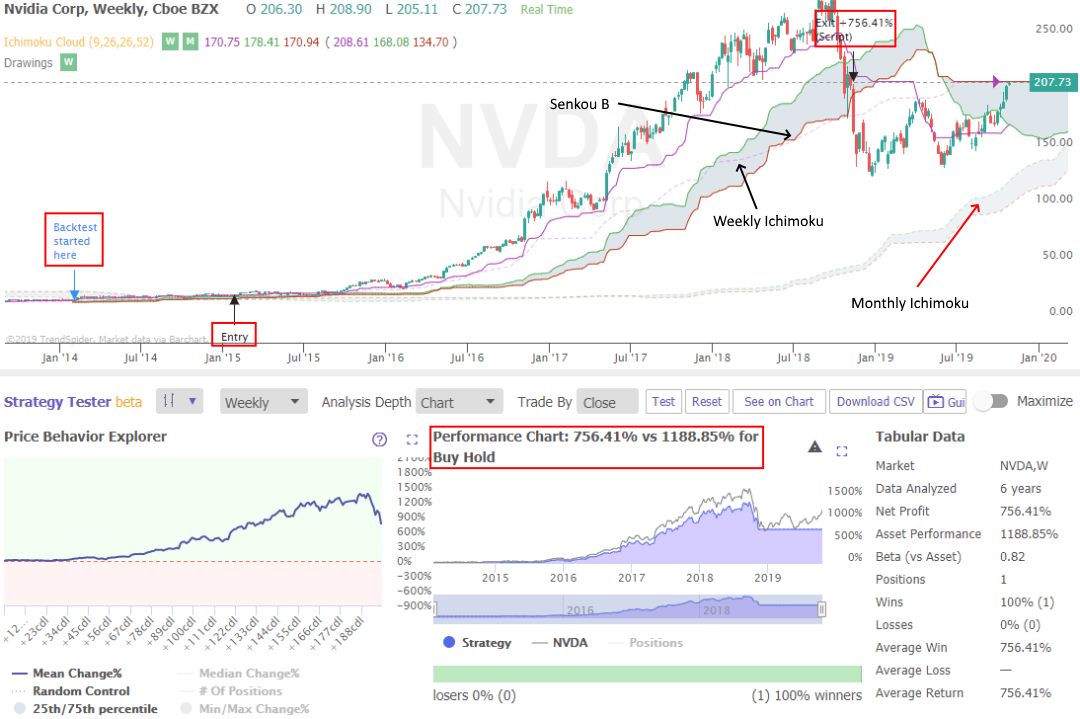
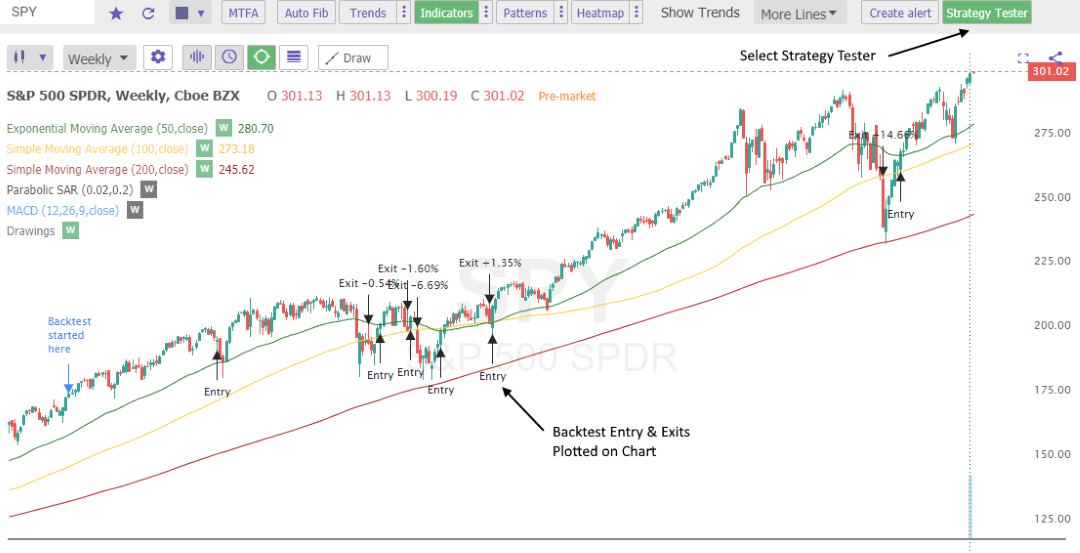
This backtest on NVIDIA (Ticker: NVDA) ran in under 1 second for five years of data from January 2014. The timing was good as the system secured a 756% win over the 4.5 years.
I also like how you can instantly see the system’s performance versus a buy-and-hold strategy. In this instance, simply holding the stock over the entire period would have yielded 1,188%. So, in the blink of an eye, you can see that Ichimoku on a weekly chart would not have been the best system for this stock. TrendSpider helped me to identify that Ichimoku Cloud charts are not profitable.
This is the beauty of backtesting: you can test multiple technical indicators on multiple timeframes and see which works best.
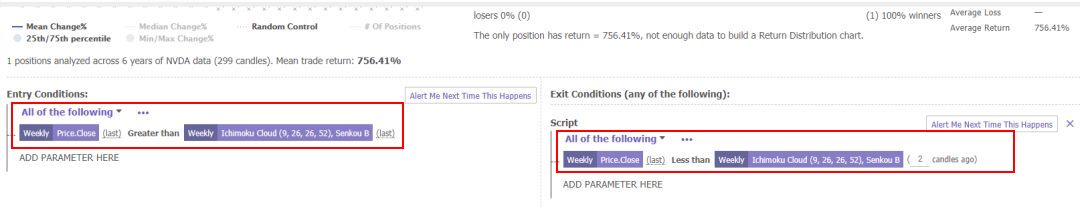
Here is how I implemented the TrendSpider Ichimoku backtest.
- Select Strategy Tester
- Entry Condition: Weekly Price Close Greater than Weekly Ichimoku Senkou B
- Exit Condition: Weekly Price Close Less than Weekly Ichimoku Senkou B
Trading Bot & Auto-Trading Reliability
TrendSpider scores AA 4.50, versus a median of 2.50, which is a major separation. Importantly, this measure is not “AI hype”—it’s about whether there’s a credible path from analysis to automation with operational assurances.
In my audit notes, TrendSpider’s reliability posture stands out because it pairs automation tooling with an explicit SLA stance (“Trader’s Bill of Rights” and credit posture). This is one of the few platforms where automation isn’t just “possible”—it is treated as a reliability-controlled product.
| Metric | Calculation | TrendSpider | High | Median | Low |
|---|---|---|---|---|---|
| Automated Execution & Bot Reliability | Sum of Automation Path, Sophistication, Operational Assurance | 4.50 | 4.50 | 2.50 | 0.00 |
| Automation Path | 0.5 none; 1.0 alerts; 1.5 webhook/API; 2.0 native/broker-linked execution | 1.50 | 2.00 | 1.00 | 0.00 |
| Strategy/Bot Sophistication | 0.5 simple; 1.0 multi-condition; 1.5 scripting+test; 2.0 bot-platform depth | 2.00 | 2.00 | 1.50 | 0.00 |
| Operational Assurance | 0.5 public status; 1.0 explicit SLA/credits/uptime promise | 1.00 | 1.00 | 0.00 | 0.00 |
| Bot & Auto-Trading Reliability Test Winners | TrendSpider 4.50 | Trade Ideas 4.00 | Tickeron 4.00 |
TrendSpider publicly positions an SLA (“Trader’s Bill of Rights”) and provides incident-linked credit language and a status channel, both of which are rare in retail trading tooling.
| Trading ? | Brokers Integrated | Exchanges | Ranking |
| TradingView | 50 | Global | #1 |
| TrendSpider | 33 | USA | #2 |
| Trade Ideas | 2 | USA | #3 |
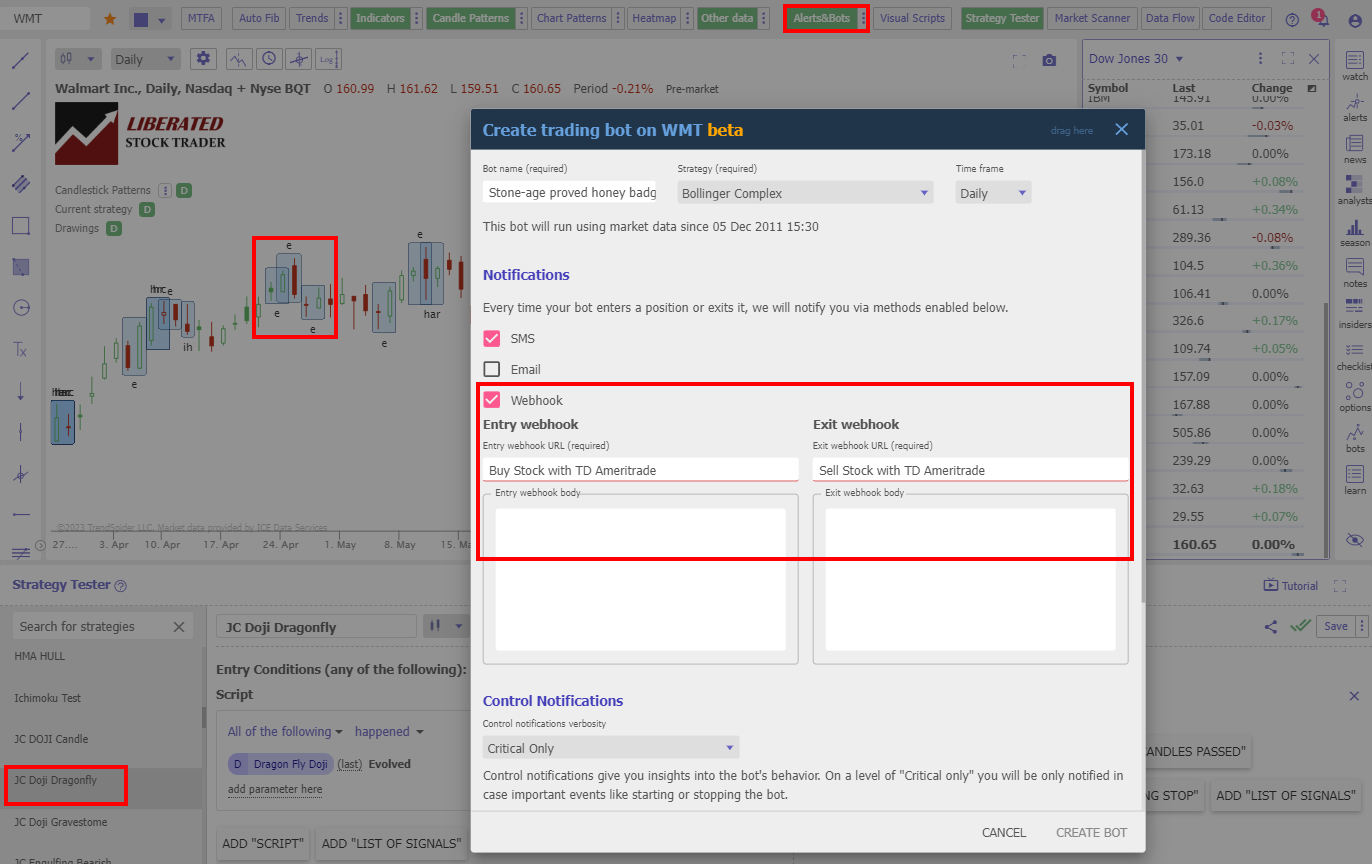
TrendSpider enables automated trade execution via its “Alerts & Bots” system (image below); traders can connect to their broker’s API to buy and sell stocks automatically based on the strategy they create with the strategy tester.
AI & Algo Index
TrendSpider scores a perfect AAA 5.00, well above the median of 2.00. The lab framing here is: does AI/algorithmic intelligence materially improve decision workflows with enough transparency and practical utility?
In my audit notes, TrendSpider’s edge is that the AI/automation layer is not an add-on; it’s central to the workflow (strategy lab, automated reasoning overlays, execution bridge). That is why it reaches the maximum 5.00 where many tools top out as “strong algorithms, no AI layer.”
| Metric | Calculation | TrendSpider | High | Median | Low |
|---|---|---|---|---|---|
| Algorithmic Intelligence & AI Tier Index | Sum of Algo Depth, AI Layer & Transparency points | 5.00 | 5.00 | 2.00 | 1.00 |
| Algo Depth | 0.5 alerts only; 1.0 rules strategies; 1.5 backtesting+factor/portfolio rules; 2.0 advanced quant platform | 2.00 | 2.00 | 1.50 | 1.00 |
| AI Layer | 0.0 none; 1.0 assistive; 1.5 ML signals core; 2.0 AI-native decisioning | 2.00 | 2.00 | 0.00 | 0.00 |
| Transparency | 0.0 black-box; 0.5 some; 1.0 clear methodology + validation artifacts | 1.00 | 1.00 | 1.00 | 0.00 |
| AI & Algo Index Test Winners | TrendSpider 5.00 | Trade Ideas 4.50 | Tickeron 4.50 |
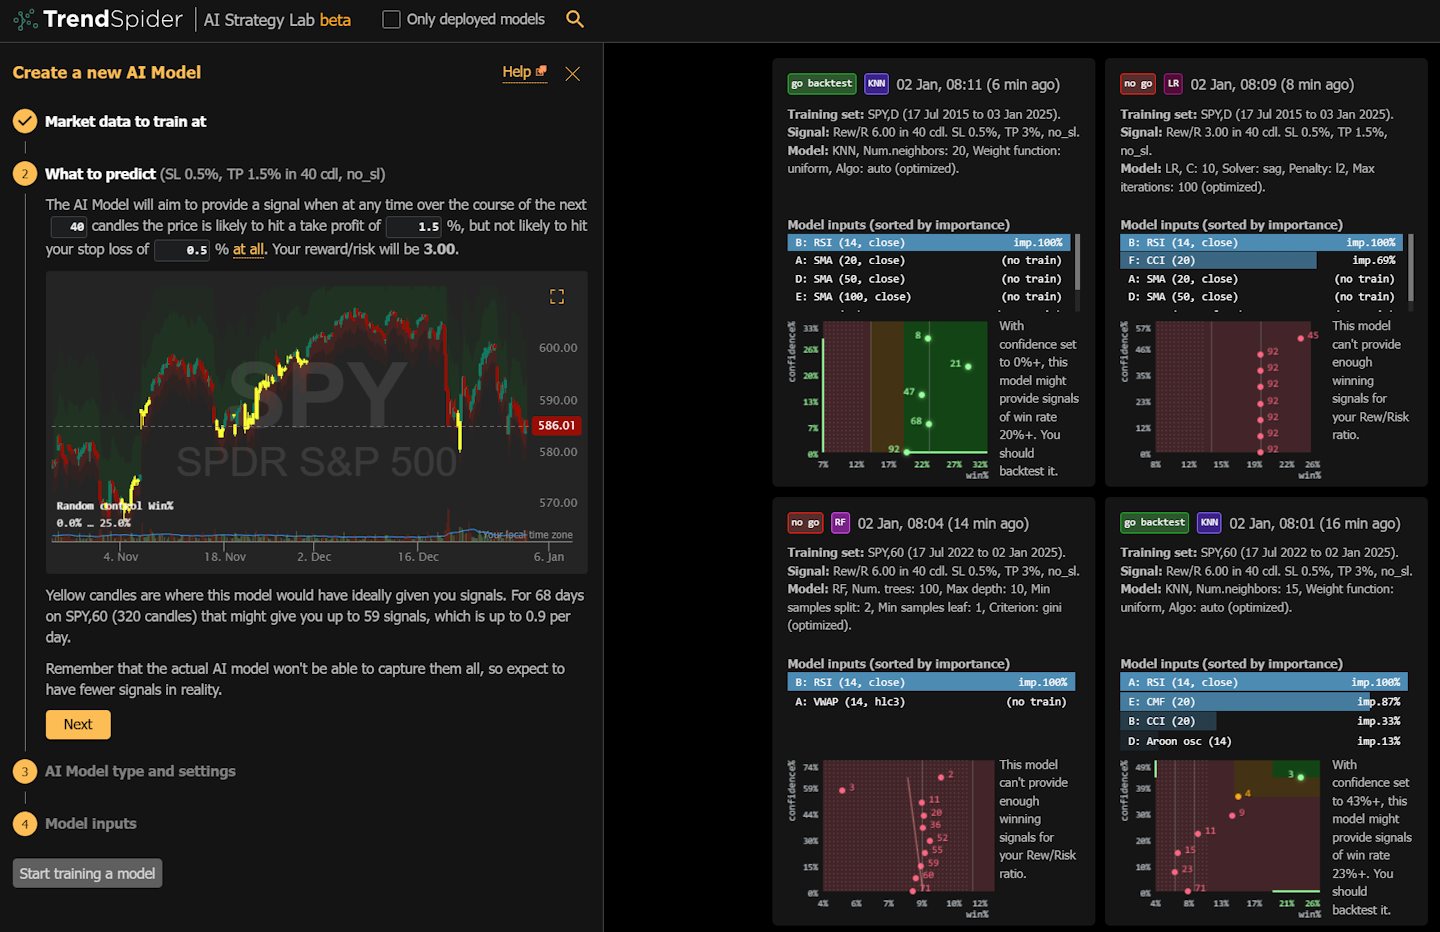
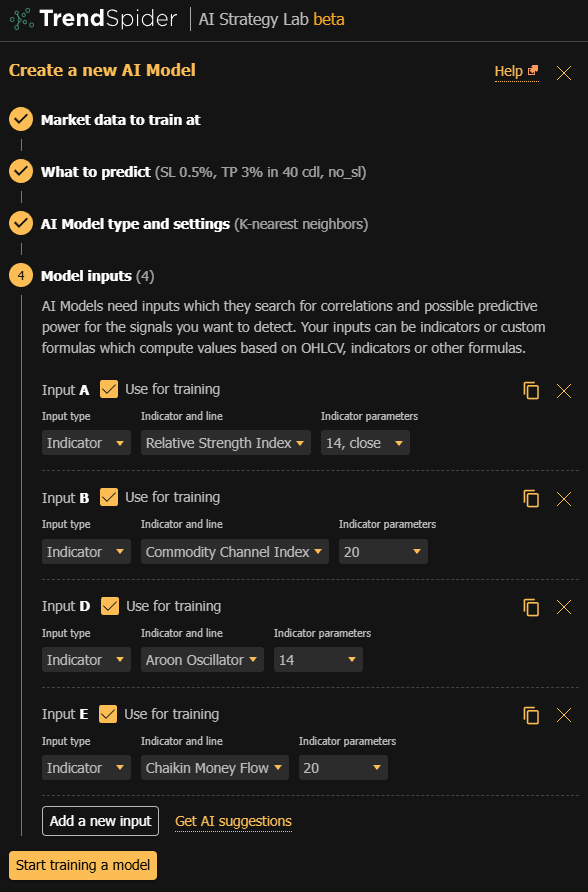
Real AI Trading Models
I tested TrendSpider’s AI Strategy Lab, and I must say, it has revolutionized how I approach trading. Through its advanced AI capabilities, I was able to analyze multiple indicators and timeframes simultaneously, which gave me a more comprehensive view of the market. This tool saved me countless hours that I would have otherwise spent manually backtesting different strategies across various conditions.
One of the standout features of the AI Strategy Lab is its ability to create custom trading algorithms. I found this particularly useful because it allowed me to tailor strategies to suit my unique trading style. The flexibility and control it provided me over the backtesting process were unmatched, enabling me to refine my strategies with precision.
The tool’s user-friendly interface made it easy for me to experiment with various scenarios and optimize my strategies. The visual representations of data and outcomes were clear and helped me quickly understand a strategy’s potential success before deploying it.
In addition to strategy development, the AI Strategy Lab provided powerful risk management tools. These were crucial in helping me set appropriate stop-loss levels and position sizes, which are vital for protecting my portfolio against significant losses. The peace of mind I gained from having these safeguards in place was invaluable.
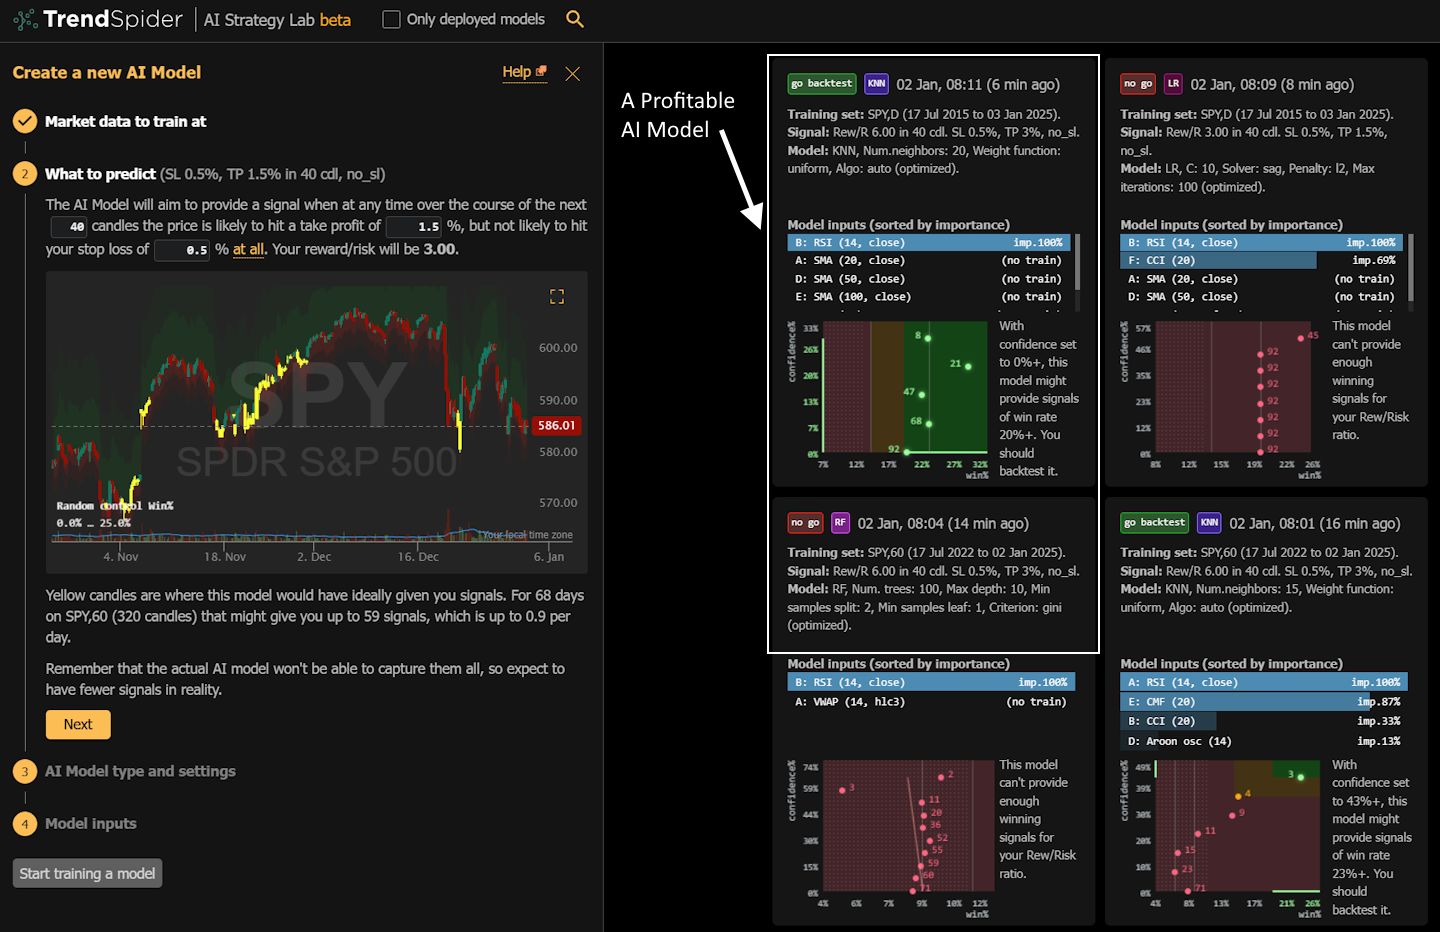
Furthermore, I was impressed by the AI Strategy Lab’s backtesting speed and accuracy. It processed historical data rapidly, which meant I could test multiple strategies in a short amount of time. This efficiency allowed me to iterate and improve my trading approaches swiftly, keeping me ahead in a fast-paced market environment.
Overall, TrendSpider’s AI Strategy Lab has been an essential tool in enhancing my trading performance. Its combination of advanced AI technology, user-friendly design, and comprehensive risk management has empowered me to trade with confidence and achieve better results. I genuinely believe this tool is a game-changer for anyone looking to elevate their trading strategies.
Alert Speed
TrendSpider’s AA 4.33 score beats the 3.67 median, primarily on alert capacity + delivery channel richness, with a mid-pack “latency rating” component.
In my audit notes, TrendSpider’s alerting is strongest on delivery breadth (it is the only tool here that maxes the alert-stream richness score). The trade-off is cadence/speed rating versus the “newsroom” tools and real-time scanner-first platforms, which are optimized for catalyst reaction.
| Metric | Calculation | TrendSpider | High | Median | Low |
|---|---|---|---|---|---|
| Alert Trigger Latency & Delivery Speed | Avg of Concurrent Alerts, Alert Streams & Alert Speed Rating scores | 4.33 | 4.67 | 3.67 | 2.30 |
| Concurrent Alerts | 1 point per 50 (max 5 points) | 5.00 | 5.00 | 5.00 | 5.00 |
| Concurrent Alert Count | Raw capacity | 400 | 2000 | 875 | 400 |
| Alert Streams Richness | 1 point per stream (email/webhook/SMS/app; max 5) | 5.00 | 5.00 | 2.00 | 1.00 |
| Alert Speed Rating | Speed rating points | 3.00 | 5.00 | 3.00 | 1.00 |
| Alert Speed Test Winners | TradingView 4.67 | TrendSpider 4.33 | Benzinga Pro 4.33 |
Dynamic price alerts on indicators and trendlines free you from staring at charts waiting for them to set up. They also help you avoid emotional traps like trading out of boredom rather than choosing the exact time to trade. The alarms can be configured on indicator or trendline breakthroughs, bounces, or touches on any timeframe.
Broker Connectivity & Ecosystem Depth
TrendSpider scores AA 4.43, far above the 2.00 median, indicating a strong ecosystem posture: live trading support, meaningful broker coverage, and full asset/data coverage.
| Metric | Calculation | TrendSpider | High | Median | Low |
|---|---|---|---|---|---|
| Asset & Data Coverage Index | Avg of Live Trading, Broker Integration & Asset/Data Coverage | 4.43 | 5.00 | 2.00 | 0.67 |
| Live Trading | 5 points | 5.00 | 5.00 | 5.00 | 0.00 |
| Total number of brokers integrated | Raw broker count | 33 | 1200 | 2 | 0 |
| Broker Integration | 0.1 point per broker (max 5 points) | 3.30 | 5.00 | 0.20 | 0.00 |
| Asset & Data Coverage | Stocks, Options, FX, US Exchanges, International Exchanges (1 point each) | 5 | 5 | 2 | 2 |
| Broker Connectivity & Ecosystem Test Winners | TradingView 5.00 | MetaTrader 5.00 | TrendSpider 4.43 |
TrendSpider maintains a broker integrations directory and positions the platform as broker-agnostic while supporting direct integrations where available. TrendSpider’s broker directory is real (33 listed), but it does not publish the maximum tested broker API order latency. Practically, it’s “strong connectivity, limited published latency guarantees,” which is typical outside of broker-native platforms.
Financial News Speed & Depth
TrendSpider scores AA 4.50, well above the 2.30 median, reflecting strong integration and usability of news in the trading workflow.
TrendSpider benefits from high-speed integrations (notably Benzinga linkage and automation-driven workflows), which is why it scores near the ceiling. It still trails true “wire-speed” terminal-style delivery, where sub-second latency is the defining feature.
| Metric | Calculation | TrendSpider | High | Median | Low |
|---|---|---|---|---|---|
| Financial News Speed & Quality Rating | Weighted rubric (news scanning, plots, watchlist, filtering, providers, alerts, real-time) | 4.50 | 5.00 | 2.30 | 0.00 |
| News Delay vs Primary Wires | Seconds of delay vs Bloomberg/Reuters (range) | 15–45 s | < 1 s | 60–300 s | Hours/Days |
| Financial News Speed & Depth Test Winners | MetaStock 5.00 | Benzinga Pro 5.00 | Scanz 5.00 |
Community Utility Index (CUI)
TrendSpider’s B 3.75 score is modestly above the 3.25 median—solid, but not “global community powerhouse” territory.
TrendSpider’s community is “a growing, tech-focused hub” centered on automation templates and workflow sharing—valuable, but smaller than the “global default” communities. Where it performs well is contribution quality: users tend to share actionable automation logic rather than low-signal chatter.
| Metric | Calculation | TrendSpider | High | Median | Low |
|---|---|---|---|---|---|
| Community Utility Index | Avg of Active Community Size & Quality of Contribution scores | 3.75 | 5.00 | 3.25 | 1.80 |
| Active Community Size | Active users / community density rating | 3.50 | 5.00 | 3.00 | 2.00 |
| Quality of Community Contribution | Quality of shared IP/code/research rating | 4.00 | 5.00 | 3.50 | 1.50 |
| Community Utility Index Test Winners | TradingView 5.00 | MetaTrader 5.00 | Trade Ideas 4.75 |
Support Infrastructure & SLA Audit
TrendSpider scores AA 4.50, above the 3.75 median, and this is one of the most practically meaningful “risk reducers” in the entire lab when you rely on alerts/automation.
| Metric | Calculation | TrendSpider | High | Median | Low |
|---|---|---|---|---|---|
| Support SLA Audit: Time-to-Human Benchmarks | Avg of Support Communication Channels & Support Response Times scores | 5.00 | 5.00 | 3.75 | 1.00 |
| Support Communication Channels | Access scale | 5.00 | 5.00 | 3.50 | 1.00 |
| Support Response Times | SLA scale | 5.00 | 5.00 | 4.00 | 1.00 |
| Stated SLA & Tested Outcomes | Practical benchmark | < 5 Minutes |
| Support Infrastructure & SLA Audit Winners | TrendSpider 5.00 | TC2000 5.00 | ThinkorSwim 4.75 |
TrendSpider’s support posture is unusually strong for a SaaS trading tool because it is treated like an operational promise, not “best effort.” With your update, it becomes a top-tier support leader (especially for time-to-human), even though TOS still sets the pace on the most aggressive sub-minute benchmark line item.
Compare to Similar Products
Comparing TrendSpider versus TradingView, MetaStock, and Trade Ideas, our tests show that TrendSpider is the best overall stock analysis software, passing 10/12 tests. For automated stock chart analysis, backtesting, and automated bot trading, TrendSpider is our top pick. TradingView is better for a global trading community. Stock Rover is better than TrendSpider for long-term growth, dividend, and value investors. For AI-driven robotic day trading, Trade Ideas is better. For trading real-time news, MetaStock is a better alternative.
| Features | TrendSpider | TradingView | Trade Ideas | MetaStock |
| Rating | 4.72 | 4.87 | 4.5 | 4.4 |
| Awards | ||||
| Pricing | $54 | $214 | $0 | $15 | $35 | $70 | $89 | $178 | $100 | $265 |
| Global Market Data | USA | ✔ | USA | ✔ |
| Powerful Charts | ✔ | ✔ | ✘ | ✔ |
| Stocks | ✔ | ✔ | ✔ | ✔ |
| Futures | ✔ | ✔ | ✘ | ✔ |
| Forex | ✔ | ✔ | ✘ | ✘ |
| Cryptocurrency | ✔ | ✔ | ✘ | ✘ |
| Social Community | ✘ | ✔ | ✔ | ✘ |
| Real-time News | ✘ | ✘ | ✘ | ✔ |
| Screeners | ✘ | ✔ | ✔ | ✔ |
| News Scanning | ✔ | ✘ | ✘ | ✔ |
| Backtesting | ✔ | ✔ | ✔ | ✔ |
| Code-Free Backtesting | ✔ | ✘ | ✘ | ✘ |
| Automated Analysis | ✔ | ✔ | ✔ | ✔ |
Mobile App
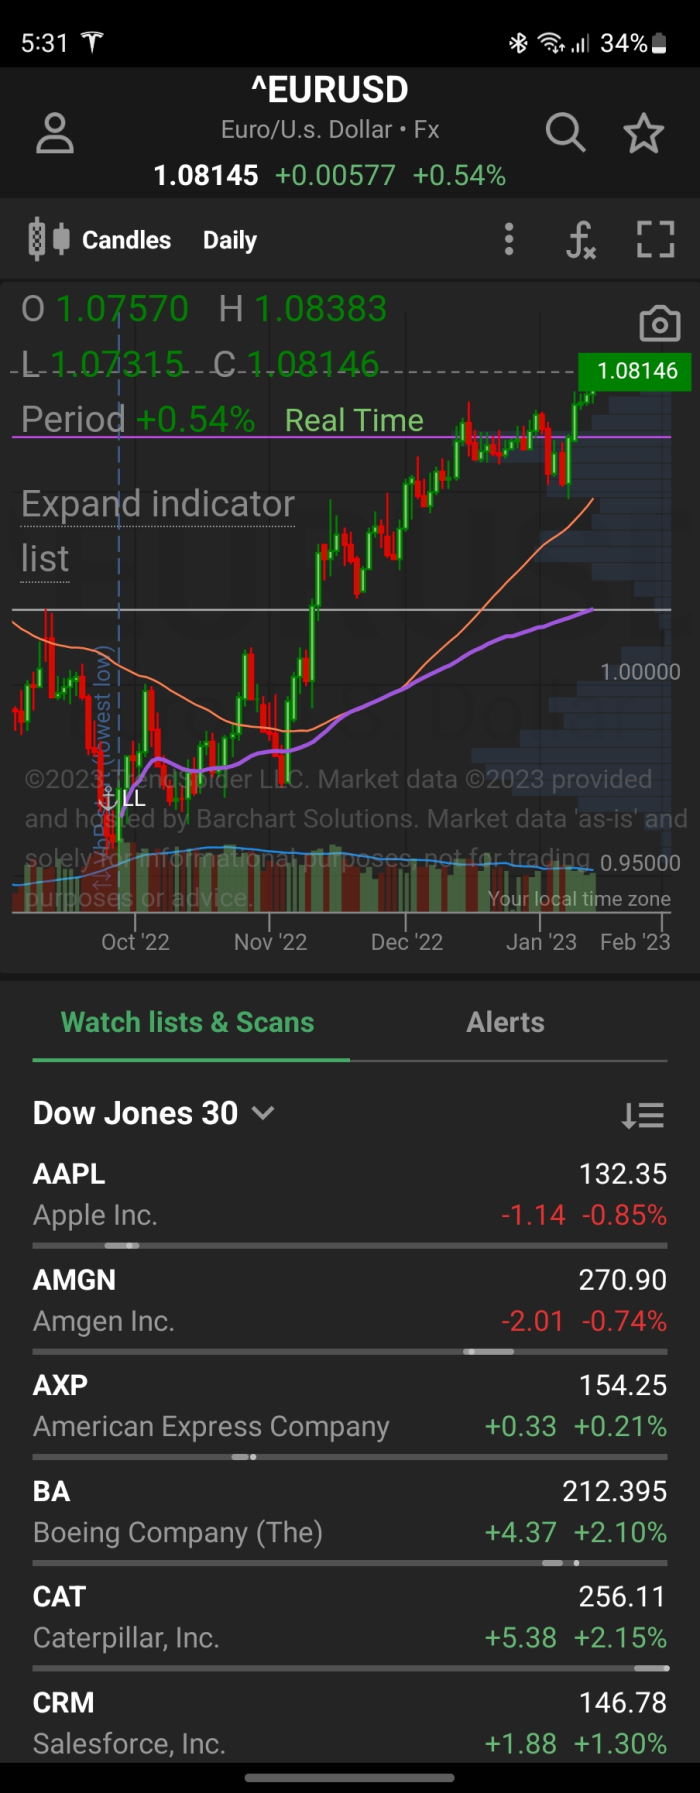
Trendspider’s mobile app is fast and harnesses about 80% of the functionality of a desktop. TrendSpider is the hottest and most powerful new Android app for serious stock analysis.
It includes stock chart pattern recognition, scanning, insider trades, options flow, news, seasonality charts, and dynamic watchlists. No other mobile app has all these high-end features.
Final Thoughts
TrendSpider leverages AI and machine learning to revolutionize trading, saving time and giving traders a competitive edge. Its innovative platform offers unparalleled capabilities for analysis and strategy testing, setting a new industry standard.
Watch The Video Overview: TrendSpider Review, AI & Automation Test & Rating Video
Hi Larry. TradingView covers commodites
Barry
Hi Karim, great I am happy it is working for you now :) FYI the code is LIB40 in all caps.
Barry
I have verified with TrendSpider that the 40% discount code is fully working and valid. In fact it is used by our readers multiple times every single day.
Try again.
Thanks
Barry
Hi. I tried signing up for the annual membership through your affiliate link today, and used the coupon code “Lib40”. It works now. It applied the discount after placing the order. I guess they must have fixed the glitch with the code. Just an FYI, the discount is not reflected on the initial order page. It is reflected on the confirmation page after placing the order. Thanks!
I have contacted trendspider to resolve the issue. I will let you know as soon as they reply.
thanks for letting me know.
Barry
I tried using this link and discount code to sign up for Trendspider and it didn’t work. When I contacted Trendspider about this, they replied “I don’t see this code in our system.”. Please fix this. Thank you.
interested in grain & livestock futures only, what is cost for system information and all data.