Bearish chart patterns form when stock prices decline after a period of bullish movement. They signify the market sentiment is changing from positive to negative and often indicate a possible downtrend.
Traders need to know that most bearish patterns are unreliable.
Decades of research have shown that the most predictable bearish patterns are the inverted cup-and-handle (average price decrease of 17%), the rectangle top (-16%), the head-and-shoulders (-16%), and the descending triangle (-15%).
Discover eight powerful bearish chart patterns backed by meticulously researched, published academic data and our video guides.
Due to the stock market’s inherent bull bias, short-selling based on bearish chart patterns is risky, and rewards and profits are not as large as those from the most bullish chart patterns.
Bearish Chart Pattern Reliability & Profitability
This table shows the bearish pattern success rates (the probability of a price decrease) and the average price decrease after emerging from pattern support. For example, the Inverted Cup and Handle pattern has a 82% chance of a price decline (success rate), and the average price decrease is -17%.
| Bearish Chart Pattern | Success Rate | Average Price Decrease |
| Inverted Cup and Handle | 82% | -17% |
| Rectangle Top | 85% | -16% |
| Head and Shoulders | 81% | -16% |
| Descending Triangle | 87% | -15% |
| Ascending Triangle | 38% | -13% |
| Bearish Flag | 45% | -9% |
| Rising Wedge | 51% | -9% |
| Bearish Pennant | 54% | -6% |
All statistics in this article are sourced with permission from Tom Bulkowski in his excellent book The Encyclopedia of Chart Patterns.
How to Automatically Identify Bearish Chart Patterns?
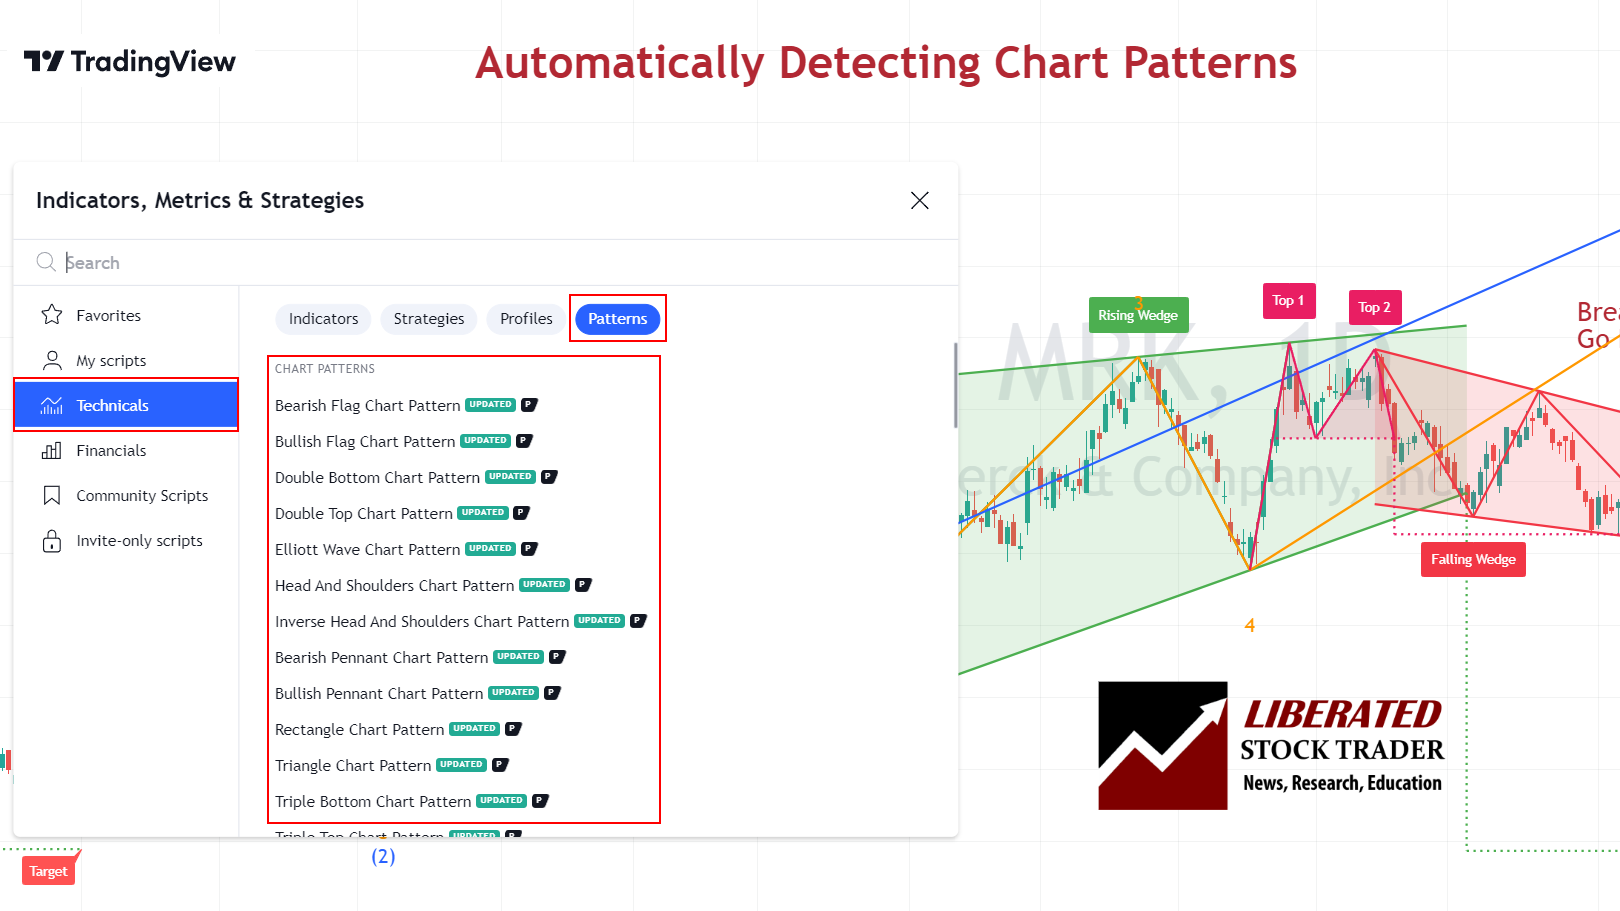
You can automatically identify bearish patterns using TradingView. Go to TradingView and click Indicators > Technicals > Patterns. Next, select Bearish Patterns. Now, any bear pattern formations will be clearly marked on the chart.
Scanning for Bearish Chart Patterns
There are currently two trading platforms offering bearish chart pattern scanning and screening. TrendSpider and FinViz enable complete market scanning for bullish and bearish patterns. Finviz is a fast and free pattern scanner, whereas TrendSpider enables full backtesting, scanning, and strategy testing for chart patterns.
How to Scan For Bearish Patterns with TrendSpider
Scanning for bearish patterns with TrendSpider is easy.
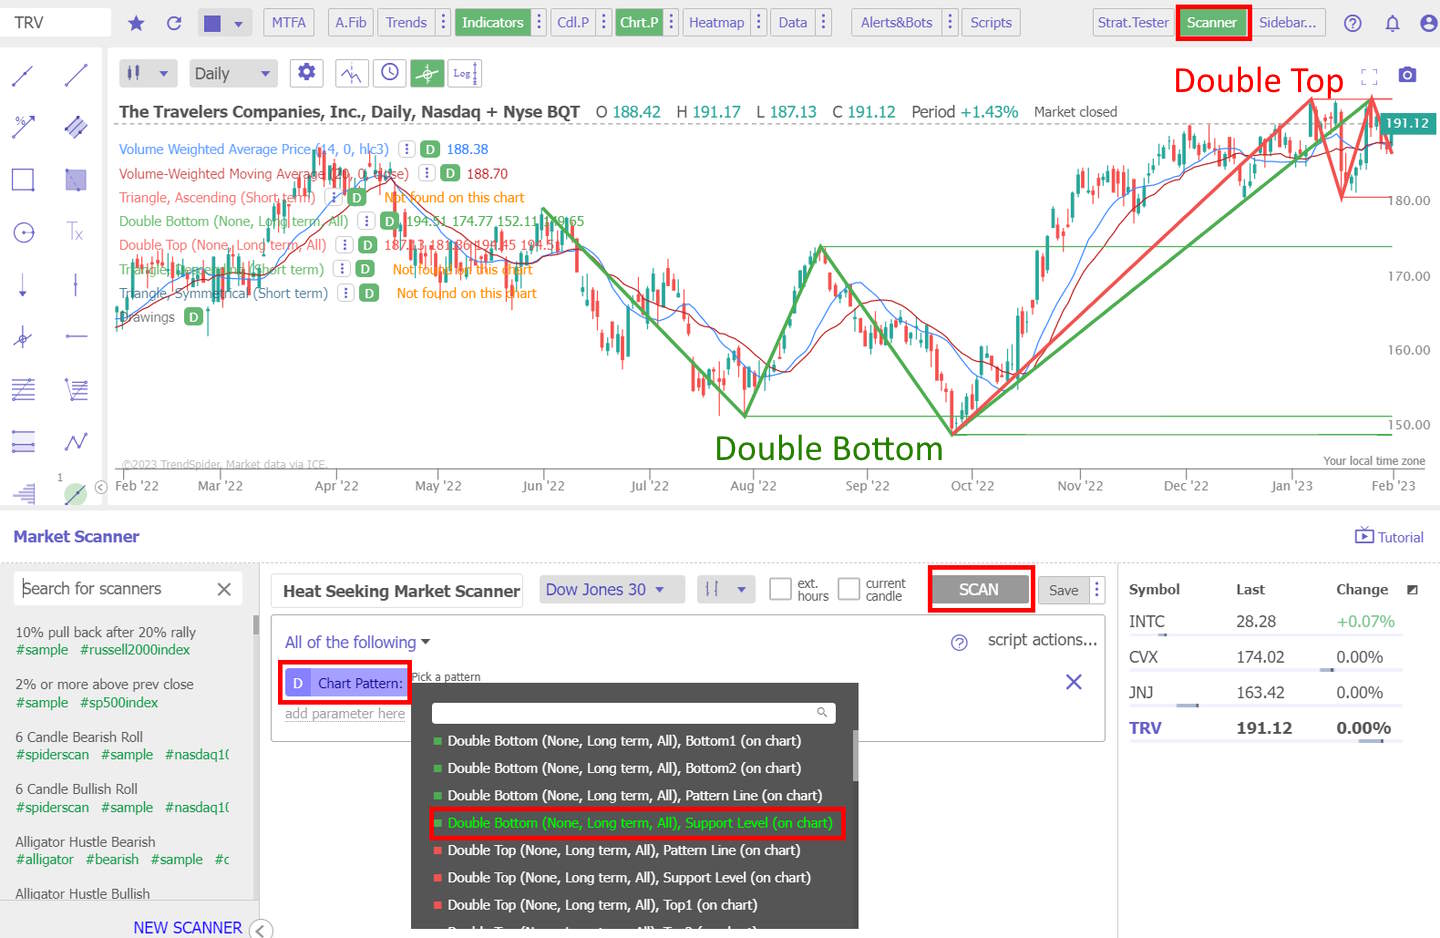
Visit TrendSpider, select Market Scanner > All of the Following > Chart Pattern > Select Pattern > Scan. You will be presented with a list of stocks with bearish patterns.
The benefit of AI-driven technical analysis tools, like TrendSpider, is the ability to backtest historical data. This allows traders to compare the performance of their strategy across different periods and markets. With TrendSpider, you can identify stocks with bearish patterns and use its advanced analytics to assess their historical performance.
TradingView 4.8/5⭐ : The Best Trading Platform I’ve Tested in 20+ Years
With lightning-fast charts, powerful pattern recognition, smart screening, backtesting, and a global community of 20+ million traders — it’s a powerful edge in today’s markets.

If you want one platform that gives you an edge, this is it.
How to Scan For Bearish Patterns with FinViz
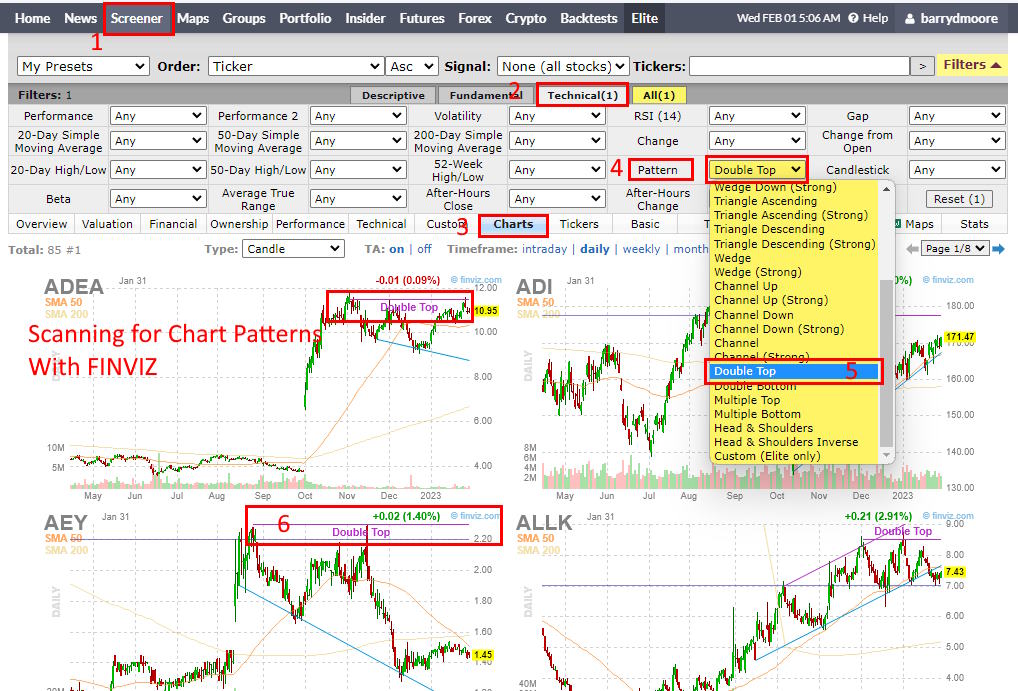
FinViz has a great feature for scanning bullish patterns. You can easily find stocks exhibiting this pattern by selecting Screener > Technical > Charts > Pattern > Select Pattern. This is extremely useful to traders who want to monitor potential bull trade opportunities.
FinViz offers a range of pre-defined filters and sorting options, enabling traders to quickly narrow their search by sector, industry, market capitalization, and more. After selecting the desired criteria, traders can apply the filter to the Finviz screener.
8 Bearish Patterns Proven Reliable & Profitable
1. Inverse Cup and Handle: -17%
Research shows that the inverse cup-and-handle boasts an impressive 82% success rate. This continuation pattern comprises two key features: the inverted cup and the handle. The “inverse cup” element of the pattern creates an inverted U-shape in price, followed by a decline that finishes near the price level where it started. The “handle” emerges when the price rallies once more, usually by 5-20%, near the low of the inverse cup, before resuming its downtrend.
| Bearish Chart Pattern | Success Rate | Average Price Decline |
| Inverted Cup and Handle | 82% | -17% |
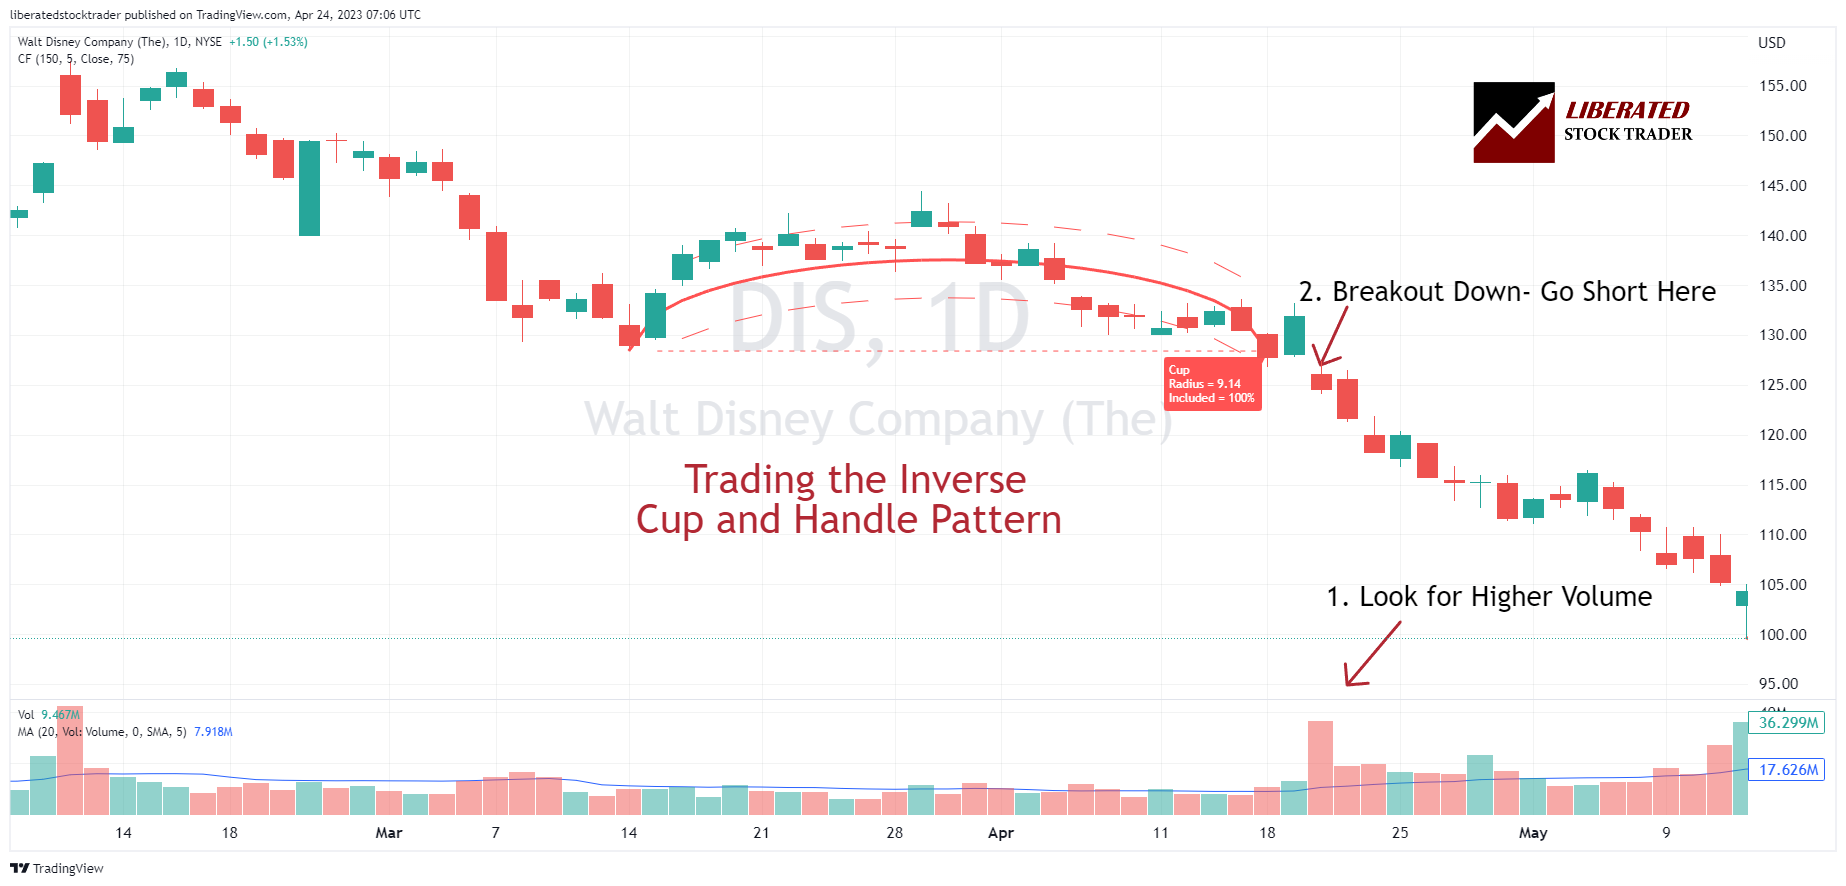
To trade inverse cup-and-handle chart patterns, look for a price breakdown below the inverse cup’s rim and at the bottom of the handle. After the price closes below the rim, enter a short trade and place a stop-loss above the breakout. Verifying a high trade volume at the breakout increases pattern reliability.
2. Rectangle Top Pattern: -16%
A rectangle is a well-established technical analysis pattern with an 85% predictive accuracy. This flexible pattern can break out up or down, making it bearish or bullish. A rectangle is bearish when the price breaks downwards through the support line.
A rectangle chart pattern has an 85% success rate on an upside breakout, achieving an average 51% profit in a bull market. If the price breaks downwards, the move is 76% successful, with an average price decrease of -16%.
| Bearish Chart Pattern | Success Rate | Average Price Decline |
| Rectangle Top | 85% | -16% |

A bearish rectangle usually forms after a price decrease. It is known as a “rectangle bottom” because it appears at the bottom of the downtrend. The bearish rectangle is confirmed when the price breaks out of it downwards through the support line.
3. Head and Shoulders: -16%
Detailed research shows that the head-and-shoulders is an extremely reliable bearish pattern, with an 81% success rate and an average price move of -16% during a bull market. In short, it is every short-seller’s favorite pattern.
| Bearish Chart Pattern | Success Rate | Average Price Decline |
| Head and Shoulders | 81% | -16% |
The head-and-shoulders pattern has been used for decades as a reliable indicator of potential reversals. The pattern is highly reliable because it requires three tests of the same resistance and a neckline break before it can be considered valid. This increases the signal’s accuracy and improves its reliability.
Additionally, the pattern is easy to spot and can be used in short-term trading and long-term investing. As such, it is a handy tool to accurately time market moves.
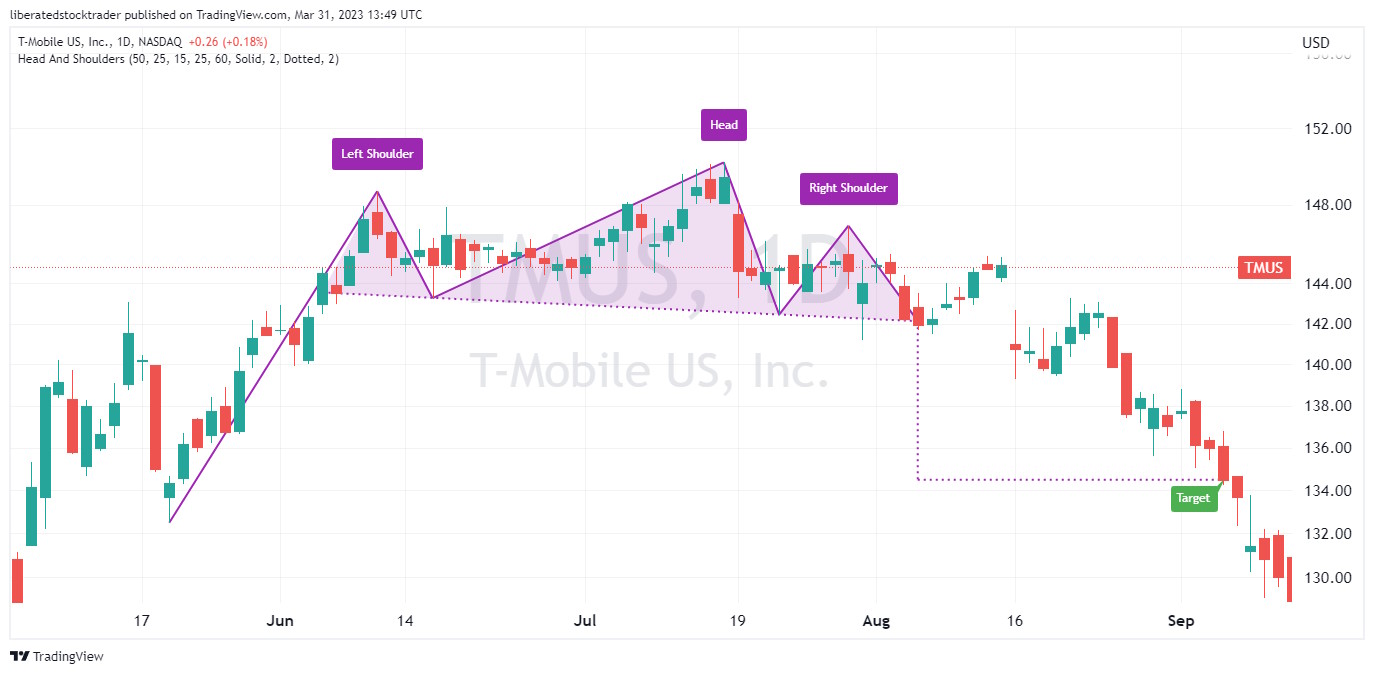
This bearish head-and-shoulders chart was automatically detected and plotted, and TradingView’s automated pattern recognition set the target.
It is also important to note that head-and-shoulders patterns can form in both bullish and bearish markets. This can provide traders with a great way to enter or exit positions based on the market’s direction.
4. Descending Triangle: -15%
A bearish triangle, also known as a descending triangle, is a powerful technical analysis pattern with a predictive accuracy of 87%. The pattern is flexible and can break out up or down, and it is a continuation or a reversal pattern.
A descending triangle has one declining trendline that connects a series of lower highs and a second horizontal trendline that connects a series of lows. A descending triangle can be bearish or bullish or a reversal or continuation pattern, depending on the direction of the price breakout.
We only know a descending triangle is bearish if the price breaks downwards. See the chart below.
| Bearish Chart Pattern | Success Rate | Average Price Decline |
| Descending Triangle | 87% | -15% |
When a descending triangle is formed during a bear market, it typically signals a continuation of the downtrend. In the chart above, the price breaks down through the support line and hits its price target of -25%. It is critically important for traders to trade only in the direction of the breakout, not try to guess the direction preemptively.
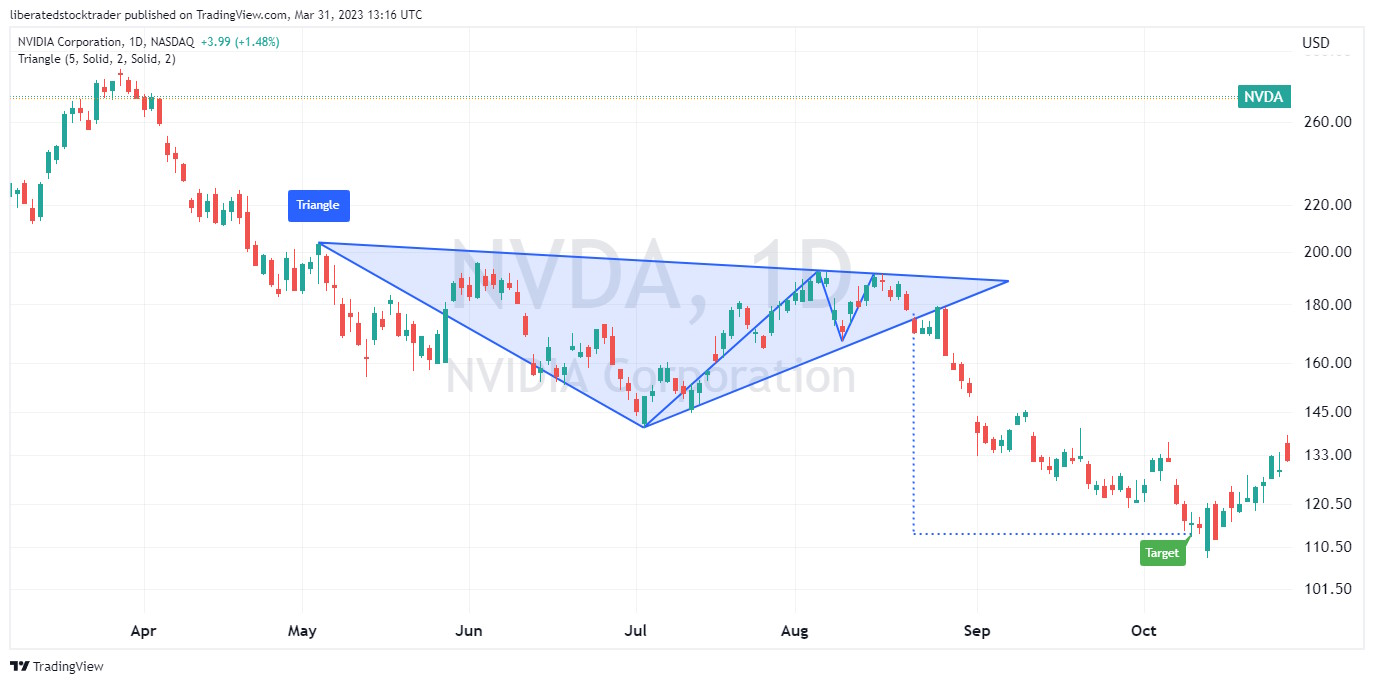
5. Ascending Triangle: -13%
The ascending triangle pattern is bearish or bullish, depending on the breakout direction. An ascending triangle is bearish when it occurs in a bear market during a price downtrend. In this case, the pattern acts as a continuation pattern.
When formed in an uptrend during a bull market, it can be either bullish or bearish, leading to a trend reversal or continuation. It all depends on how the price responds.
| Bearish Chart Pattern | Success Rate | Average Price Decline |
| Ascending Triangle | 38% | -13% |
According to testing, an ascending triangle breaks out upward 64% of the time and downward 36% of the time. Traders must wait for the price to exit the triangle before trading.
6. Bear Flag: -9%
A bearish flag is a popular yet widely misunderstood technical analysis pattern characterized by a strong downward price trend followed by a period of parallel price consolidation. The price decrease resembles an inverse flagpole, while the price consolidation is the flag.
| Bearish Chart Pattern | Success Rate | Average Price Decline |
| Bearish Flag | 45% | -9% |
The chart below shows a classic bear flag that failed. Contrary to expectations, the stock did not move lower; instead, it broke out to the upside and reached a small new high before consolidating.
Research indicates that after a breakout, bear flags typically lead to only a 9% price decrease. This is very low compared to inverse head-and-shoulders or double-bottom patterns.
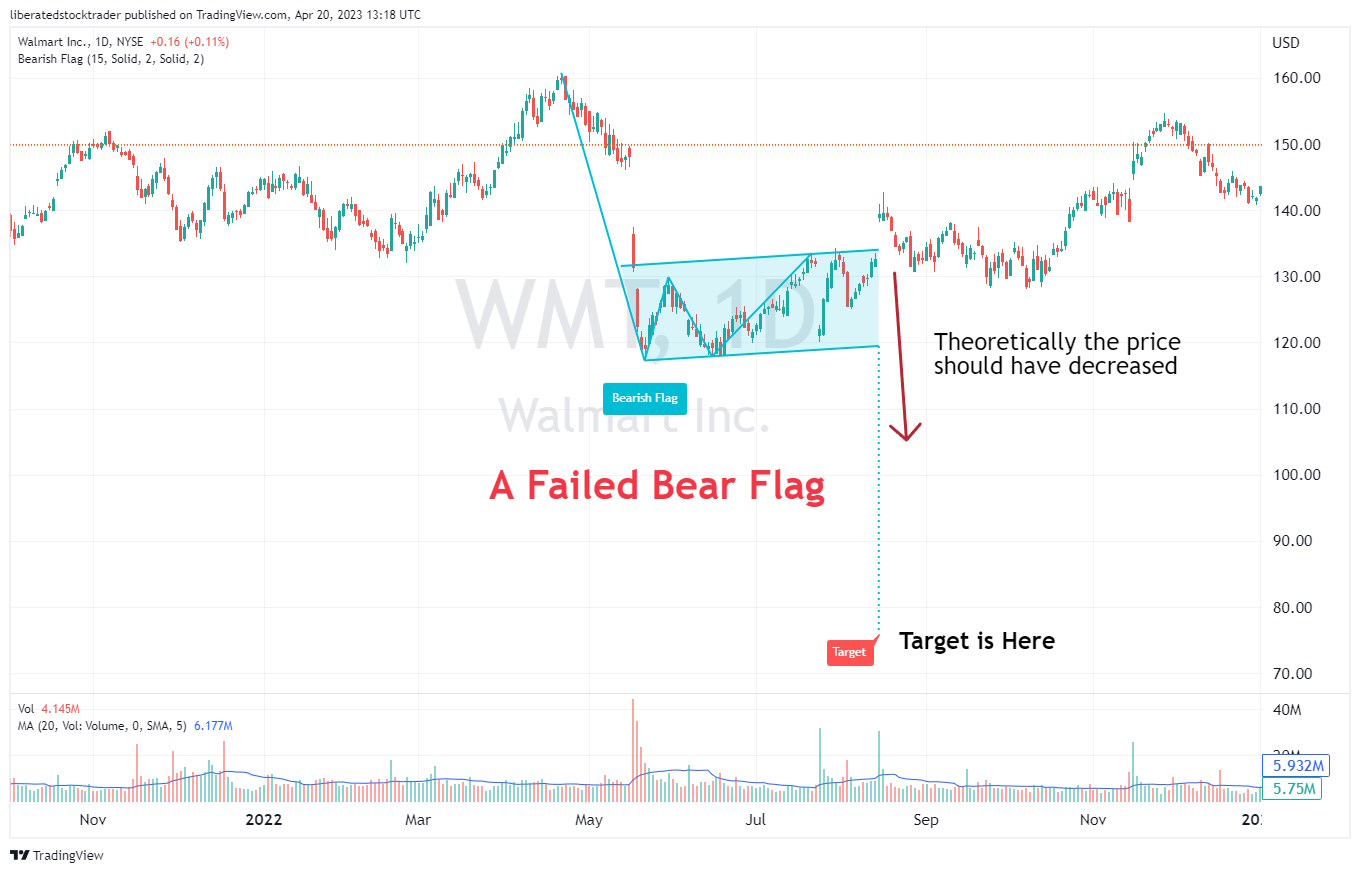
Be careful when trading bearish flags. According to published research, the bear flag pattern has a low success rate of 45%. This means you are flipping a coin when trading this pattern, as the odds are not in your favor. The high-tight bear flag is the only flag pattern you should trade.
A lot has been written about bear flags, but academic research into flag patterns suggests that only the bullish high-tight flag is successful.
7. Rising Wedge: -9%
A bearish wedge, also called a rising wedge, is a formidable technical analysis pattern with an accuracy rate of 81%. While it can break out in either direction, it is primarily seen as a bearish pattern.
| Bearish Chart Pattern | Success Rate | Average Price Decline |
| Rising Wedge | 51% | -9% |
A rising wedge forms when a stock’s price rises, but instead of continuing its upward trajectory, it begins to contract as the trading range tightens. This contraction manifests as the slope of two converging, rising trendlines plotted below and above the price action.
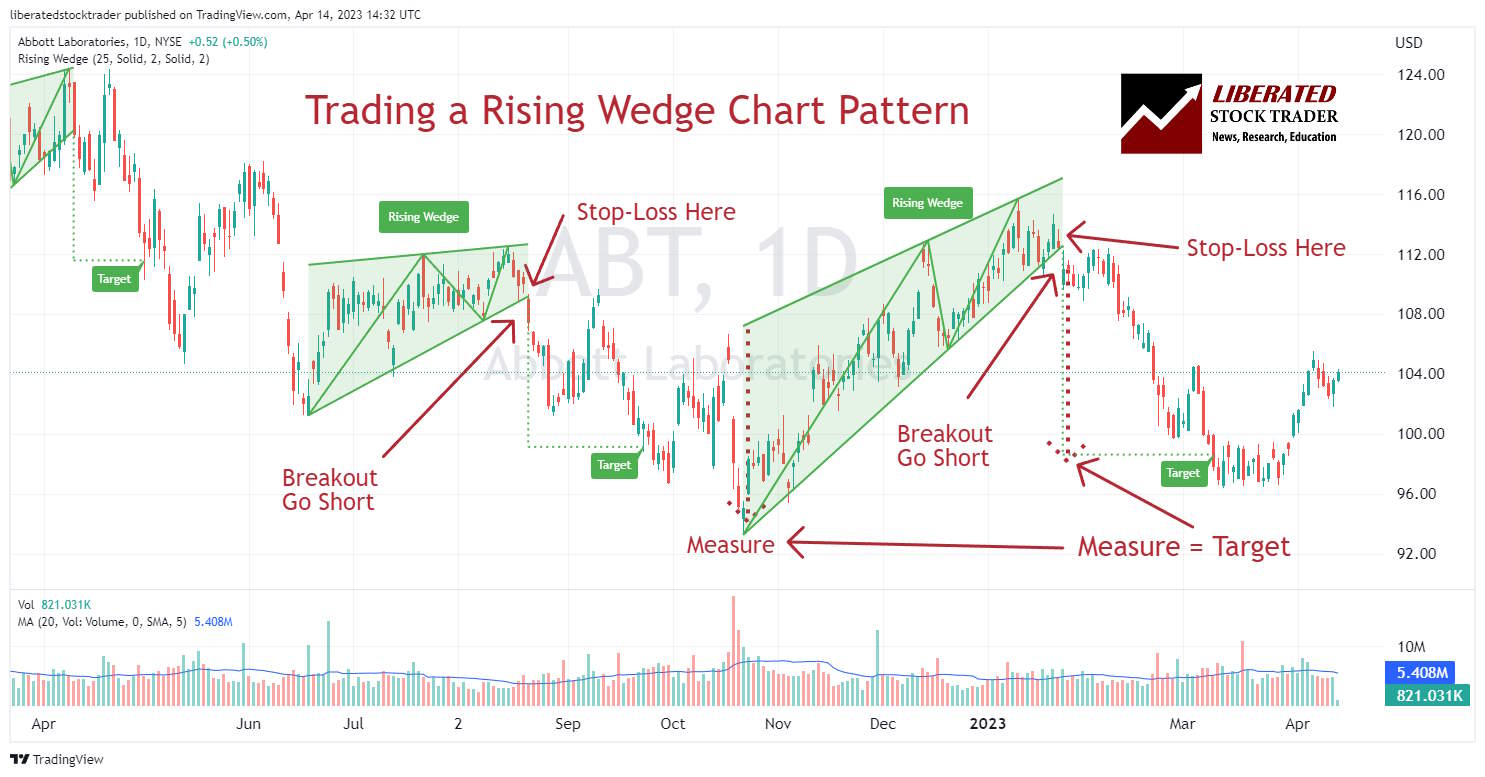
Auto-detect this Chart Pattern with TradingView
When trading a rising wedge chart pattern, setting your stop loss inside the wedge pattern and adjusting your target level based on the breakdown size is important. You can expect a target of 50% up to 100% of the distance from the entry point to the wedge resistance line.
8. Bear Pennant: -6%
A bearish pennant pattern is a chart formation that resembles a triangle with two converging trend lines. It often follows a downtrend and signals a possible continuation of the current trend.
Though some traders may see the bearish pennant pattern as an opportunity to capitalize on a potential downward price movement in an asset, academic research suggests that these patterns can be unpredictable and thus risky. There is a 54% chance the breakout will continue downwards and a small average price decrease of 6%.
| Bearish Chart Pattern | Success Rate | Average Price Decline |
| Bearish Pennant | 54% | -6% |
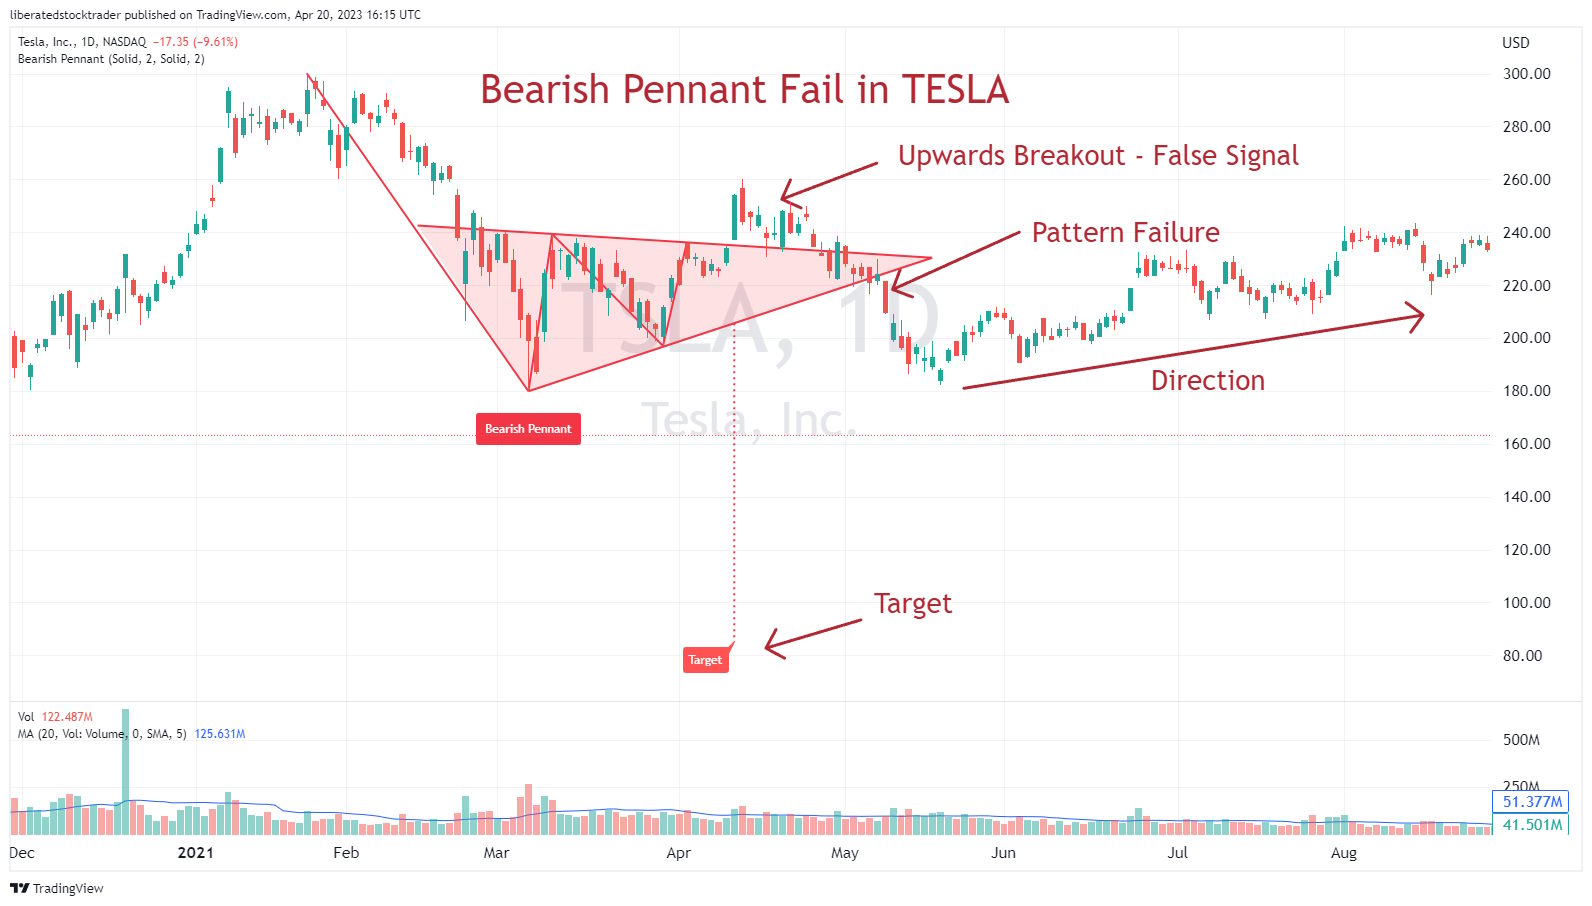
The price action in this chart pattern typically begins with a sharp decline, followed by a period of consolidation, during which the stock’s highs and lows converge. The consolidation period is typically followed by another sharp decrease, indicating the start of the bearish trend.
Summary
Bearish patterns in technical analysis indicate a potential fall in an asset’s value. Common bearish chart patterns include flags, wedges, rectangles, and triangles. Given the stock market’s inherent bull bias, using bearish patterns for short selling can be risky and should only be undertaken by experienced traders.
Before attempting to short-sell using any of these patterns, traders should research historical and current market data for a full picture of price movements before making any decisions. Additionally,
FAQ
Is a head and shoulders pattern bearish?
Yes, according to research, a head and shoulders pattern is a bearish pattern 81 percent of the time. This pattern occurs at the top of a bull market and signals a price reversal averaging -16 percent.
What are bearish patterns?
Bearish patterns are chart formations indicating that the trend will likely decline in the future. Bearish patterns include the inverse cup and handle, ascending triangle, double top, and triple top. These patterns generally indicate buyers are exiting the market, and prices will likely decrease.
What is a bearish stock pattern?
Bearish stock patterns are technical analysis patterns that indicate a probable decrease in the price of a stock. Investors and traders can use these patterns to identify potential selling opportunities. They include the inverse cup and handle, ascending triangle, double bottom, and inverse head and shoulders.
What is the most bearish chart pattern?
The most bearish chart pattern is the inverse cup and handle, which has an exceptional bullish success rate of 82 percent. With a potential average price decline of -17 percent. The inverse cup and handle is the best bear pattern.
Is a bearish pattern good?
Yes, a bearish pattern is good for short-sellers and those buying put options contracts. However, bearish patterns are not good for long-term investors or pension funds as they signal a price deterioration.
What are the risks when trading bearish patterns?
When trading bearish chart patterns, there is always a risk of loss due to unexpected events. It is important to use a stop-loss order and to be aware of the price movement relative to support and resistance levels. Bearish patterns should not be traded without prior knowledge or experience of the financial markets, as losses can be large if the trader does not understand the risks. Additionally, bearish patterns should never be traded on margin or with leverage, as this amplifies the downside risk.
Is a double bottom pattern bearish?
No, a double bottom pattern is not bearish; it is bullish. This formation occurs when the price tests a resistance level twice and then rallies upwards. While it can be traded bearishly, this is generally not recommended due to the high probability of a pattern failure.
What is a bearish reversal pattern?
A bearish reversal is a pattern that signals the end of an uptrend and the beginning of a downtrend. Examples of common bearish reversal patterns include head and shoulders, double tops, triangles, and wedges.
Is the megaphone pattern bullish or bearish?
The megaphone pattern is typically seen as a bearish reversal pattern. This formation occurs when the price action forms a series of lower highs and higher lows in an ascending or descending channel, then breaks out below the lower trendline. This signals the start of a significant downtrend.
How to find bearish patterns?
You can automatically find bearish chart patterns with TradingView's pattern recognition algorithms. If you want to scan entire markets for bearish patterns, I would recommend TrendSpider or Finviz.
Learn the Success Rates of 65 Chart Patterns
The Encyclopedia of Chart Patterns by Tom Bulkowski details the reliability and success rates of 65 chart patterns and shows you how to trade them. It is an indispensable resource for traders and investors seeking to enhance their profitability by leveraging stock chart patterns. This comprehensive reference book provides in-depth explanations and detailed illustrations of over 65 different patterns, including Head and Shoulders, Double Tops, Wedges, Flags, Gaps, and more.
