I conducted 56,680 test trades on 30 Jow Jones stocks spanning 10,199 years of data to find the most profitable candlestick patterns for traders. Each candle pattern is fully researched and has a video trading guide.
My rigorous testing shows the most reliable candle patterns are the Inverted Hammer (60% success rate), Bearish Marubozu (56.1%), Gravestone Doji (57%), and Bearish Engulfing (57%). The inverted hammer is the most profitable candle pattern, with a 1.12% profit per trade.
After hundreds of hours of backtesting with TrendSpider, I’ve gained valuable insights into the success and profitability of 25 popular candlestick patterns.
Candle Pattern Reliability Test Methodology
I tested 25 candle formations on 30 Dow Jones Industrial Average stocks over 20 years. This amounted to 56,680 trades, spanning 10,199 years of data. The table below shows two key candle pattern success metrics. The % Profit per trade is the average profit per trade, including all winning and losing trades across bull and bear markets. The % Winner denotes the percentage of the trades that made a profit by increasing in value. All tests were long trades over ten days; no short-selling was tested.
Top 10 Candle Patterns Results
The Inverted Hammer shows the highest reliability with a 1.12% profit per trade and a 60.0% success rate. Following closely are the Bearish Marubozu, Gravestone Doji, and Bearish Engulfing patterns.
| Best Candle Patterns | % Profit/Trade | % Winners |
| Inverted Hammer | 1.12% | 60.0% |
| Bearish Marubozu | 0.80% | 56.1% |
| Gravestone Doji | 0.65% | 57.0% |
| Bearish Engulfing | 0.62% | 57.0% |
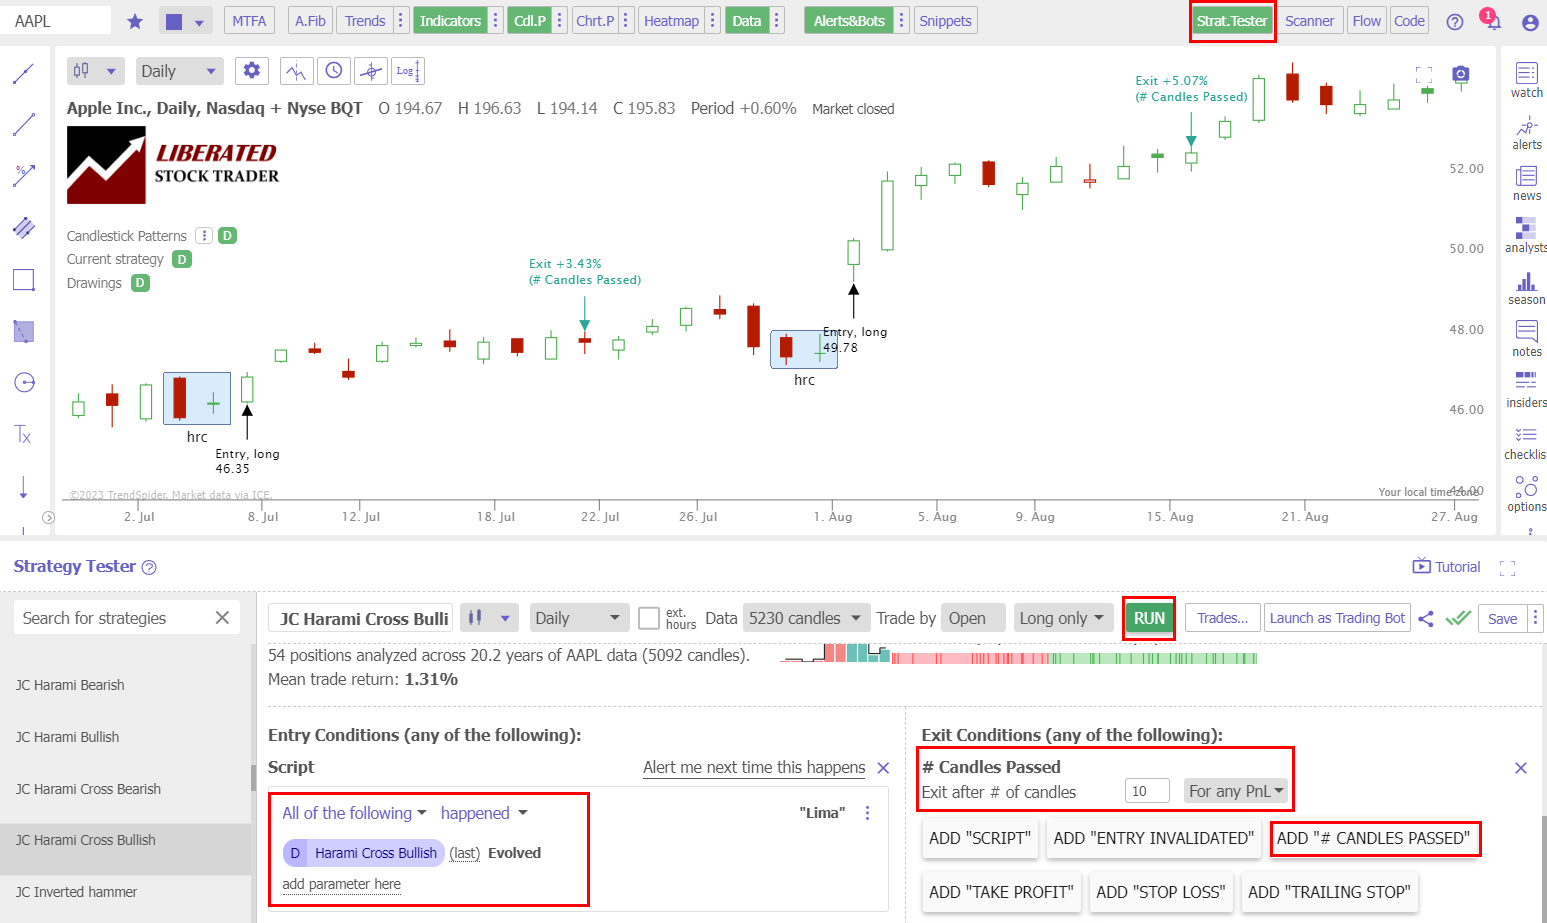
| Bullish Harami Cross | 0.58% | 55.3% |
| Bearish Harami Cross | 0.57% | 57.0% |
| Shooting Star | 0.56% | 57.1% |
| Doji Candle | 0.51% | 55.6% |
| Bullish Harami | 0.50% | 55.2% |
| Spinning Top | 0.49% | 55.9% |
Performance Data © Barry D. Moore – LiberatedStockTrader.com.
How to Identify Candlestick Patterns?
Previously, you needed to find each candlestick pattern on a stock chart manually, draw trendlines, and plot target prices. Today, TrendSpider can automatically detect, plot, and backtest all candlestick patterns.
TrendSpider is my favorite tool for AI-powered pattern recognition, strategy testing, and stock trading; I highly recommend trying it.
Save 38% to 45% on TrendSpider
Our Top Rated 4.72 ⭐ Trading Tool
✅ Leader in AI Trading & Chart Pattern Recognition
✅ Scanning & Auto-Trading
Deal Ends In:
TrendSpider 4.8/5⭐: My Pick for AI-Power & Auto-Trading
I’ve used TrendSpider for 7 years for my research and testing. It auto-detects trendlines, patterns, and candlesticks, backtests ideas, and lets you use AI to create unique strategies and launch trading bots—with no code.

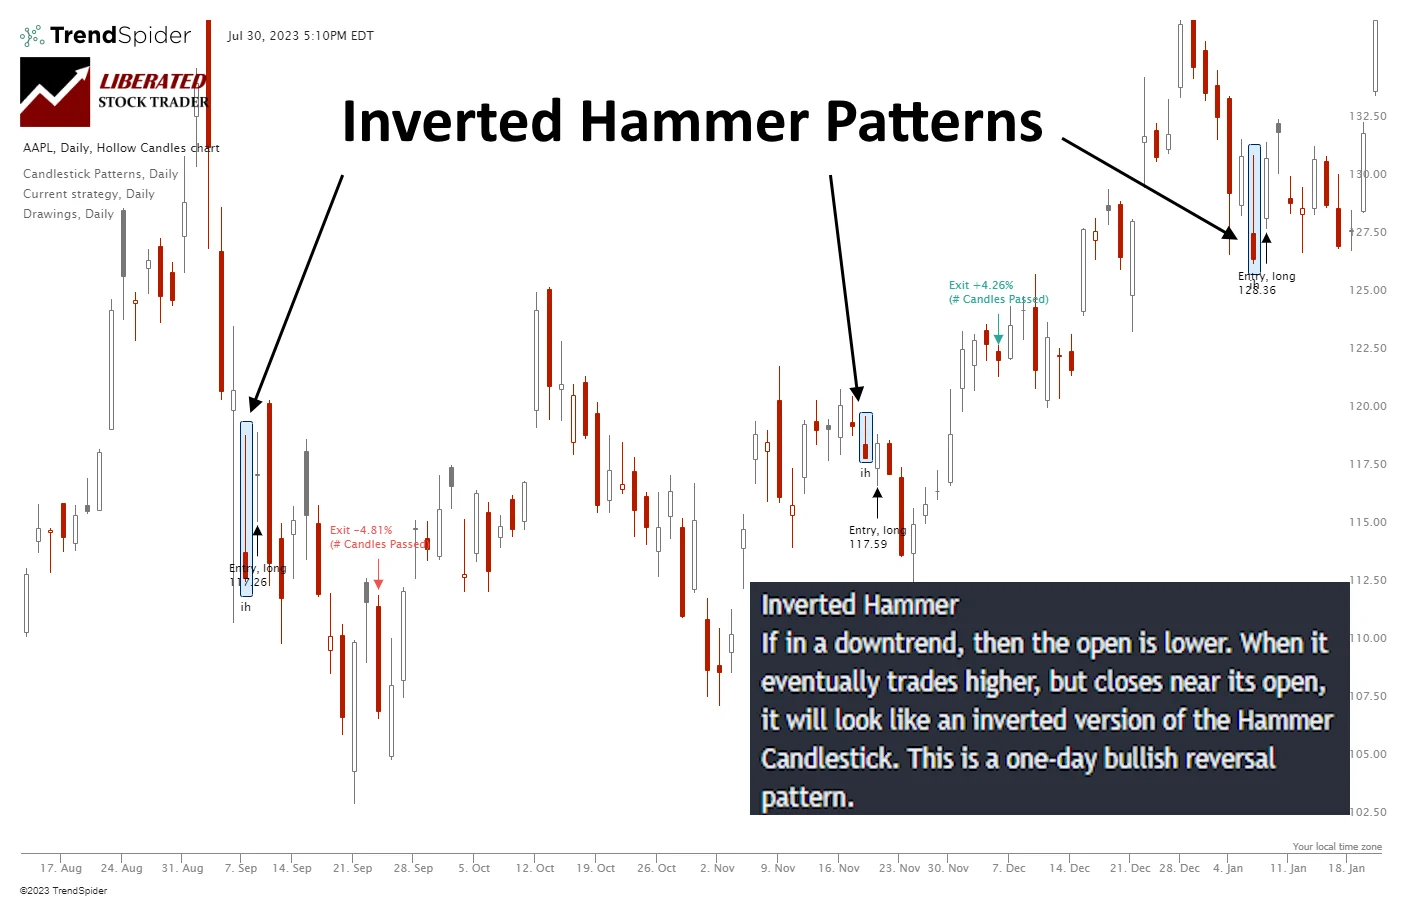
1. Inverted Hammer: 60% Win Rate
After conducting 1,702 trades on 588 years of data, we confirm the Inverted Hammer profit per trade to be 1.12%. A 1.12% win rate means that trading an Inverted Hammer long will net you an average of 1.12% profit per trade if you sell after ten days. Conversely, when short-selling an Inverted Hammer, you should expect to lose 1.12% per trade. This proves this pattern is strongly bullish.
The percentage of Inverted Hammer winning trades was 60% versus 40% losing trades, significantly higher than the 55.8% average performance across all candlestick types. The Max Drawdown was -29.6%, versus the stock’s drawdown of -59.4%, which shows less volatility than a buy-and-hold strategy.
| Test Results | Inverted Hammer |
| # Trades Tested | 1,702 |
| Average Return | 1.12% |
| Reward/Risk Ratio | 1.28 |
| % Wins | 60.0% |
| Average Win | 4.2% |
| Average Loss | -3.50% |
Identifying an Inverted Hammer
The Inverted Hammer typically appears at the bottom of a downtrend, indicating a potential shift in the price trajectory. It signals a bullish sentiment, denoting that the market is trying to increase prices, as the extended upper wick indicates. However, the sellers regain control by the close of the trading period, pushing the price down to close near the opening level, thus creating a small body at the bottom.
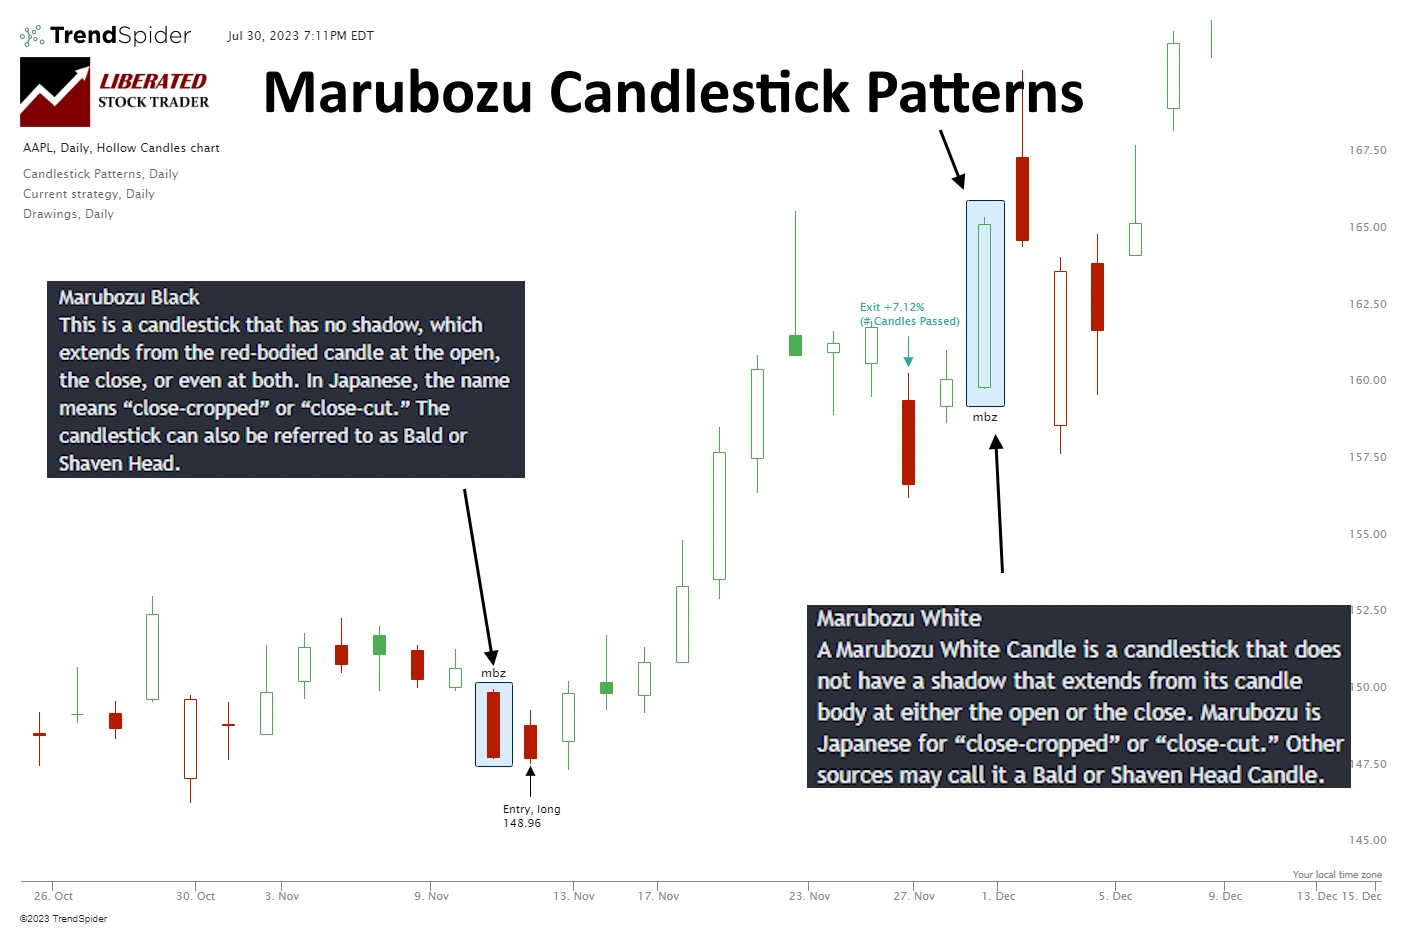
2. Bearish Marubozu: 56.1% Win Rate
The percentage of Bearish Marubozu winning trades was 56.1%, with an average winning trade equalling 4.1%, significantly higher than the average performance across all candlestick types. The Max Drawdown was -31%, versus the stock’s drawdown of -59.7%, which shows less volatility than a buy-and-hold strategy.
The average winning trade was 4.1% over ten days, and the average losing trade was -3.5%; this represents a reasonable profit margin, especially when combined with the 56.1% successful trades. The average win for all trades was 0.8% per trade.
The Bearish Marubozu’s reward-to-risk ratio is 1.21, the highest of the 25 candles we tested. We have only seen better rard/risk ratios in our testing of the “inverted hammer“
| Test Results | Bearish Marubozu |
| # Trades Tested | 2,360 |
| Average Return | 0.80% |
| Reward/Risk Ratio | 1.21 |
| % Wins | 56.1% |
| Average Win | 4.1% |
| Average Loss | -3.48% |
Identifying a Bearish Marubozu
A Bearish (Black) Marubozu signals a strong downward price movement. It forms when the open price is the highest for the period (day, hour, etc.) and the close price is the lowest. In other words, bears controlled the price from the start to the end of the timeframe, reflecting the dominance of selling pressure throughout the entire period.
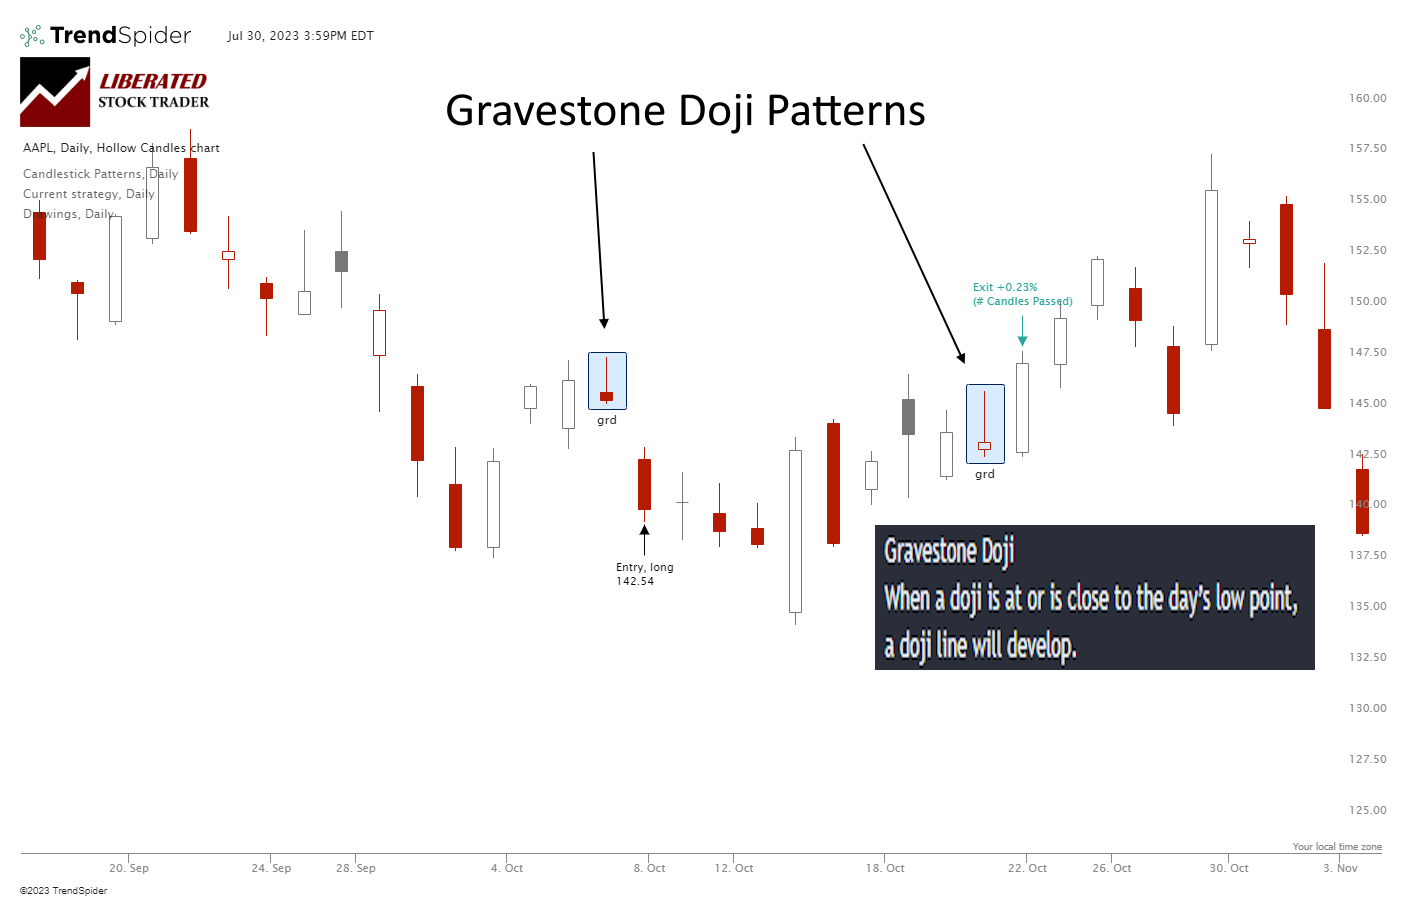
3. Gravestone Doji: 57% Win Rate
After conducting 1,553 trades on 575 years of data, we confirm the win rate to be 0.65% per trade. A 0.65% win rate means that trading a Gravestone Doji long will net you an average of 0.65% profit per trade if you sell after ten days. Conversely, when short-selling a Gravestone Doji, you should expect to lose 0.65% per trade.
The percentage of Gravestone Doji winning trades was 57% versus 43% losing trades, higher than the 55.8% average performance across all candlestick types, in fact, the third best. The Max Drawdown was -28.6%, versus the stock’s drawdown of -59.3%, which shows less volatility than a buy-and-hold strategy.
| Test Results | Gravestone Doji |
| # Trades Tested | 1,553 |
| Average Return | 0.65% |
| Reward/Risk Ratio | 1.12 |
| % Wins | 57.0% |
| Average Win | 3.8% |
| Average Loss | -3.57% |
Identifying a Gravestone Doji
The Gravestone Doji candlestick pattern takes shape when a trading session’s opening, closing, and low prices are almost identical. This kind of candle looks like a gravestone, with a tall wick on the top. It indicates that buyers failed to push the prices up, and the sellers were able to bring them back down to around the opening price at the end of the trading session.
4. Bearish Engulfing: 57% Win Rate
After conducting 4,096 trades on 568 years of data, we confirm the Bearish Engulfing profit per trade to be 0.62%. A 0.62% win rate means trading a Bearish Engulfing long will net you an average of 0.62% profit per trade if you sell after ten days. Conversely, short-selling a Bearish Engulfing will result in a loss of -0.62% per trade. This proves that this pattern is strongly bullish.
The percentage of Bearish Engulfing winning trades was 57% versus 43% losing trades, significantly higher than the 55.8% average performance across all candlestick types. The Max Drawdown was -39.7%, versus the stock’s drawdown of -59.3%, which shows less volatility than a buy-and-hold strategy.
The average winning trade was 3.7% over ten days, and the average losing trade was -3.5%; this represents a reasonable profit margin, especially when combined with the 57% successful trades.
| Test Results | Bearish Engulfing |
| # Trades Tested | 4,096 |
| Average Return | 0.62% |
| Reward/Risk Ratio | 1.06 |
| % Wins | 57.0% |
| Average Win | 3.7% |
| Average Loss | -3.52% |
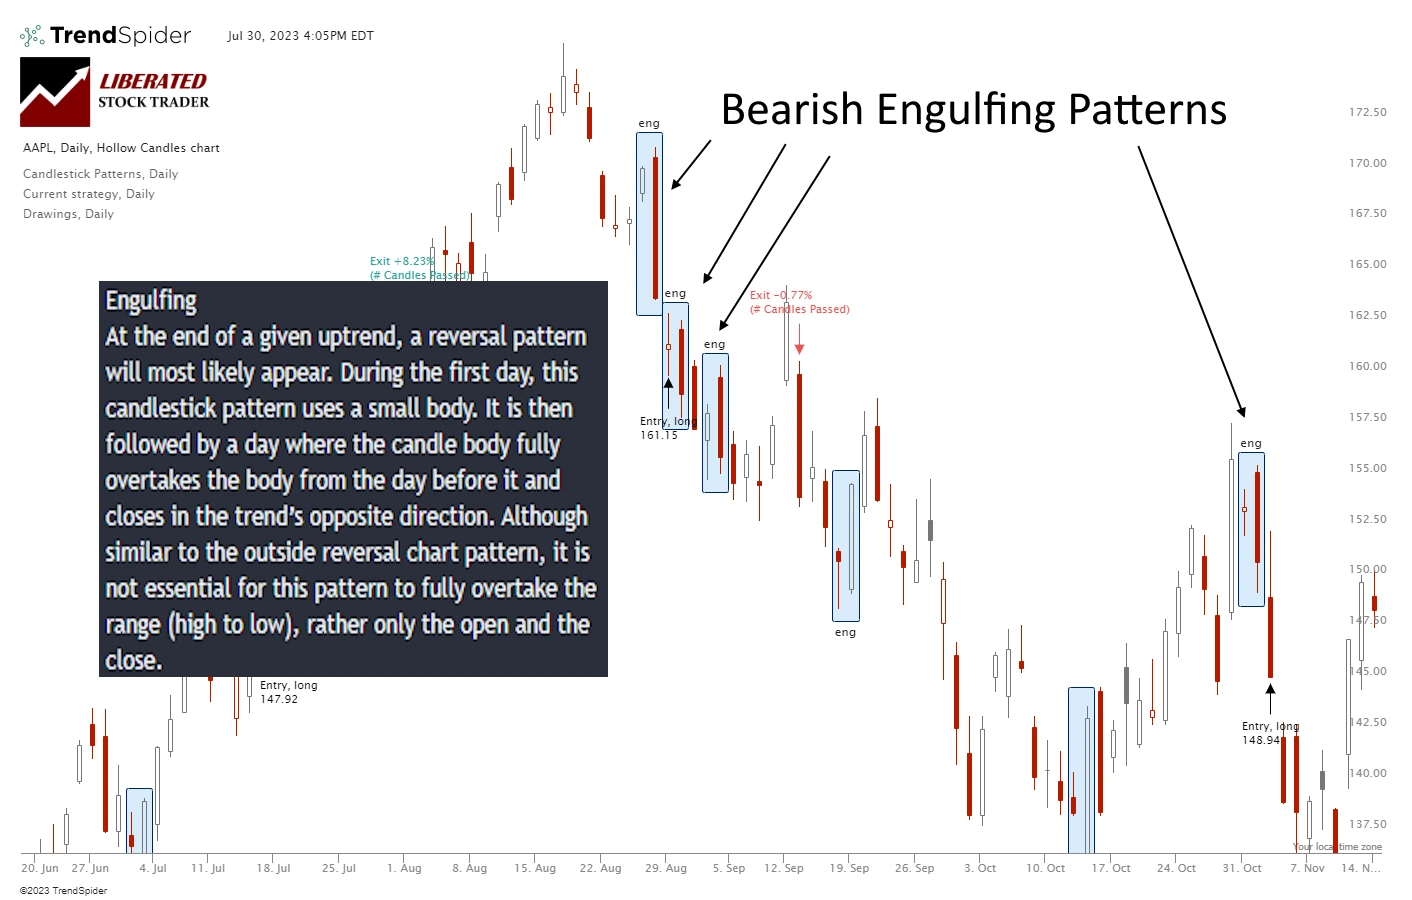
Identifying a Bearish Engulfing Candle
The data suggests a Bearish Engulfing candle can occur during an uptrend or downtrend and can be a reversal or continuation pattern. The image below shows four Bearish Engulfing candles, three of which occur during a downtrend, thus accelerating the price decline, and one occurs during an uptrend, signifying a reversal.
5. Bullish Harami Cross: 55.3% Win Rate
The percentage of Bullish Harami Cross winning trades was 55.3%, with an average winning trade equalling 4.0%, significantly higher than the average performance across all candlestick types. The Max Drawdown was -31.7%, versus the stock’s drawdown of -59.3%, which shows less volatility than a buy-and-hold strategy.
The average winning trade was 4.0% over ten days, and the average losing trade was -3.7%; this represents a reasonable profit margin, especially when combined with the 56.1% successful trades. The average win for all trades was 0.58% per trade.
| Test Results | Bullish Harami Cross |
| # Trades Tested | 1,609 |
| Average Return | 0.58% |
| Reward/Risk Ratio | 1.17 |
| % Wins | 55.3% |
| Average Win | 4.0% |
| Average Loss | -3.65% |
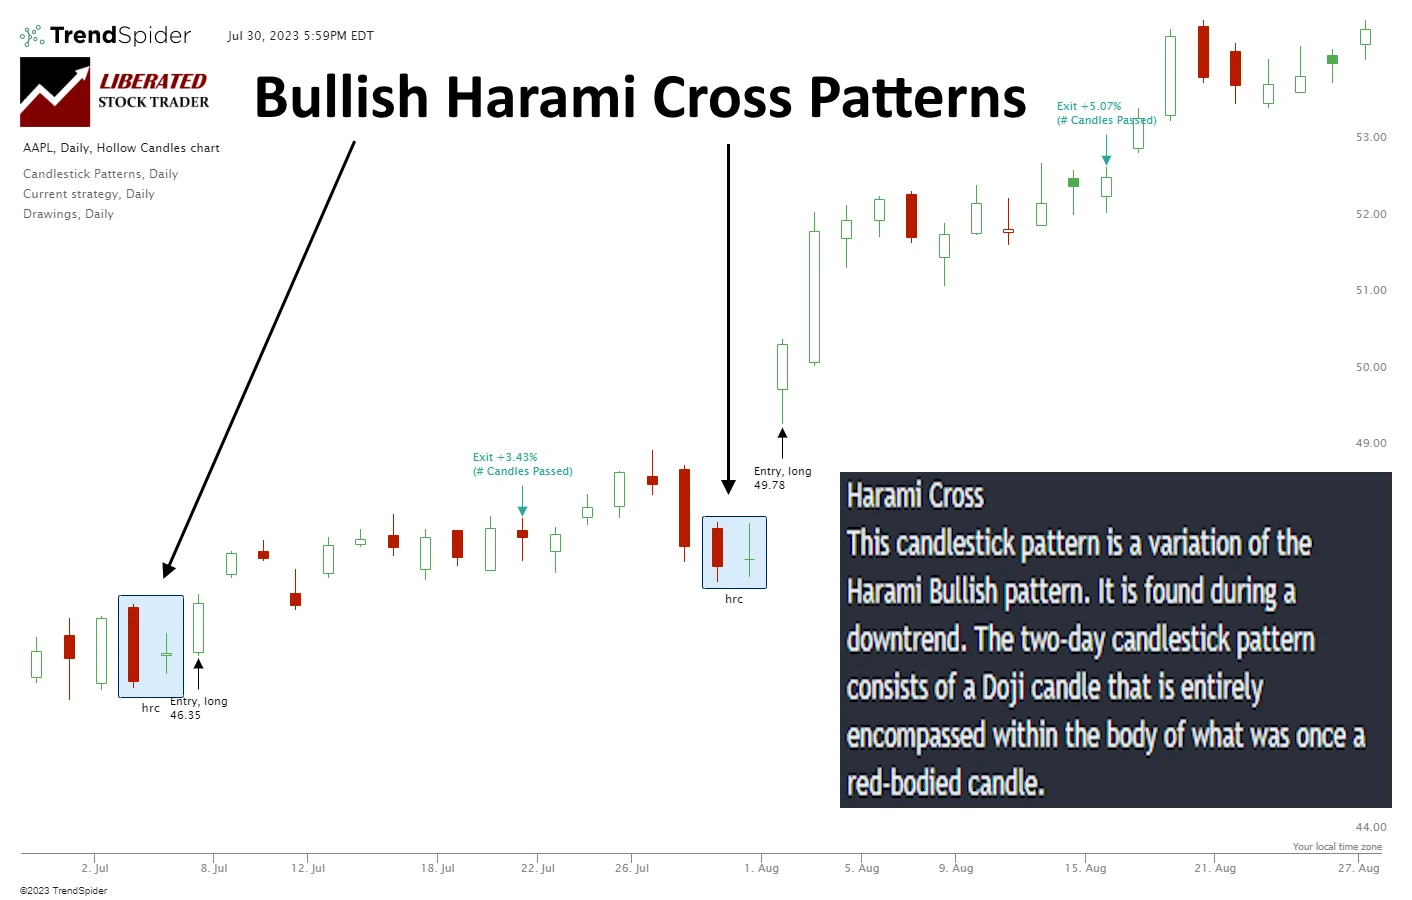
Identifying a Bullish Harami Cross
The Bullish Harami Cross pattern is similar to the Bullish Harami as it also signals a possible end to a bearish trend and the commencement of a bullish trend. While the first candle is still a bearish pattern with a significant move down, the second candle is usually a spinning top or Doji, meaning the open and close prices are similar and still contained within the bounds of the first candle.
6. Bearish Harami Cross: 57% Win Rate
The percentage of Bearish Harami Cross winning trades was 57%, with an average winning trade equalling 3.6%, significantly higher than the average performance across all candlestick types. The Max Drawdown was -28.9%, versus the stock’s drawdown of -59.30%, which shows less volatility than a buy-and-hold strategy.
The average winning trade was 3.6% over ten days, and the average losing trade was -3.5%; this represents a tight profit margin, but when combined with the 57% successful trades, the strategy is profitable. The average profit for all trades was 0.57% per trade.
| Test Results | Bearish Harami Cross |
| # Trades Tested | 1,651 |
| Average Return | 0.57% |
| Reward/Risk Ratio | 1.06 |
| % Wins | 57.0% |
| Average Win | 3.6% |
| Average Loss | -3.53% |
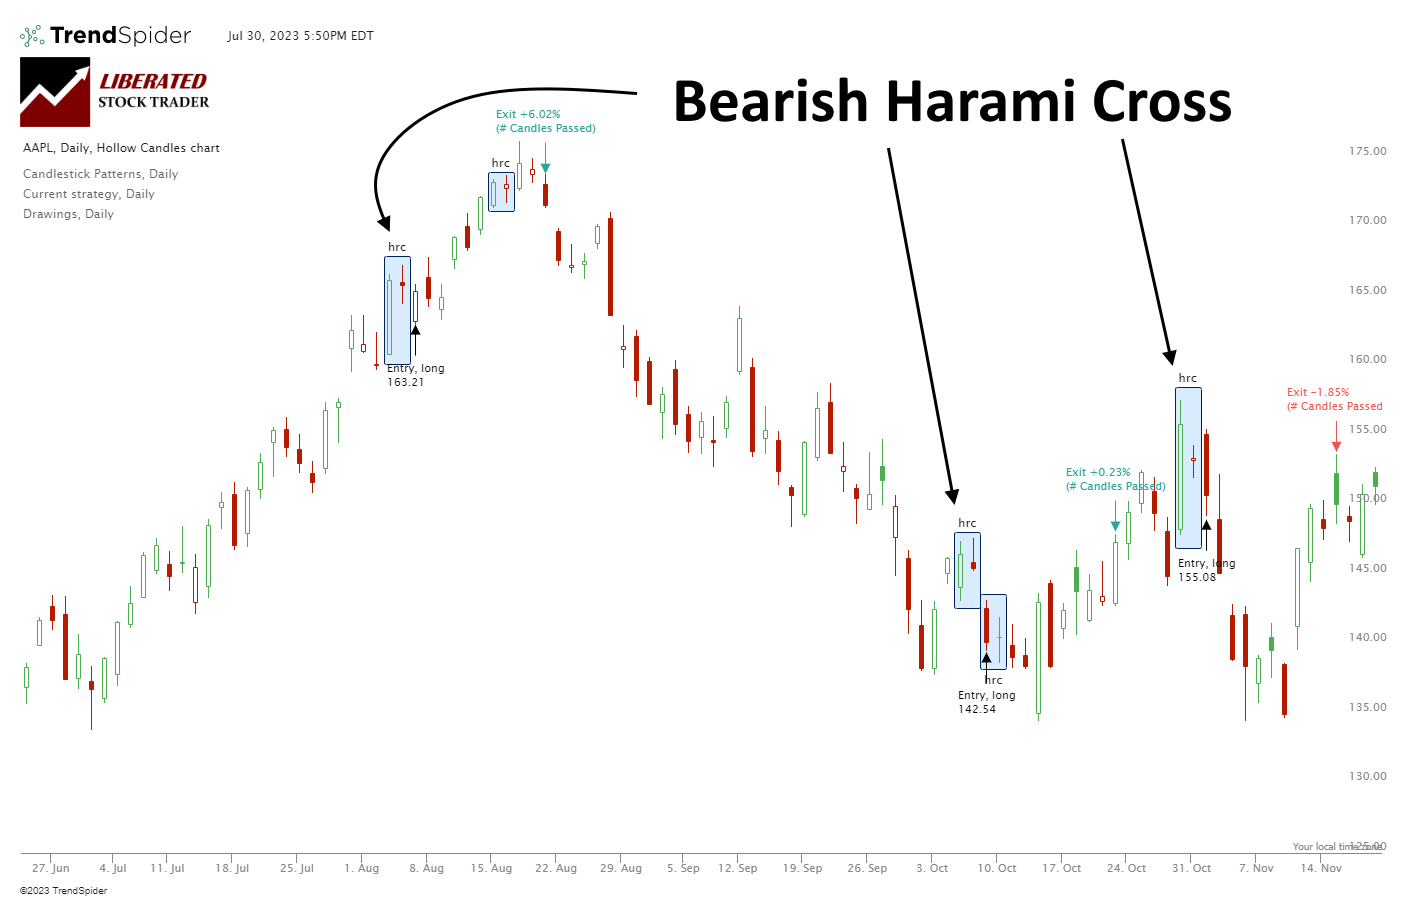
Identifying a Bearish Harami Cross
The Bearish Harami Cross pattern is a two-candlestick chart pattern that supposedly signifies the end of a bullish trend and the potential onset of a bearish trend. The first candlestick will often be a bullish bar, indicating that the market has increased significantly during that period. The second candle is bearish, indicating buyers have stepped in and pushed prices back down from their earlier highs.
7. Shooting Star: 57.1% Win Rate
The Shooting Star candle pattern achieved an overall success rate of 57.1% and returned an average gain of 0.56% with a reward/risk ratio of 1.11. The average win was 3.4%, while the average loss was -3.19%. With a solid reward/risk ratio of 1.11, this supposedly bearish pattern is strongly bullish.
| Test Results | Shooting Star |
| # Trades Tested | 1,680 |
| Average Return | 0.56% |
| Reward/Risk Ratio | 1.11 |
| % Wins | 57.1% |
| Average Win | 3.4% |
| Average Loss | -3.19% |
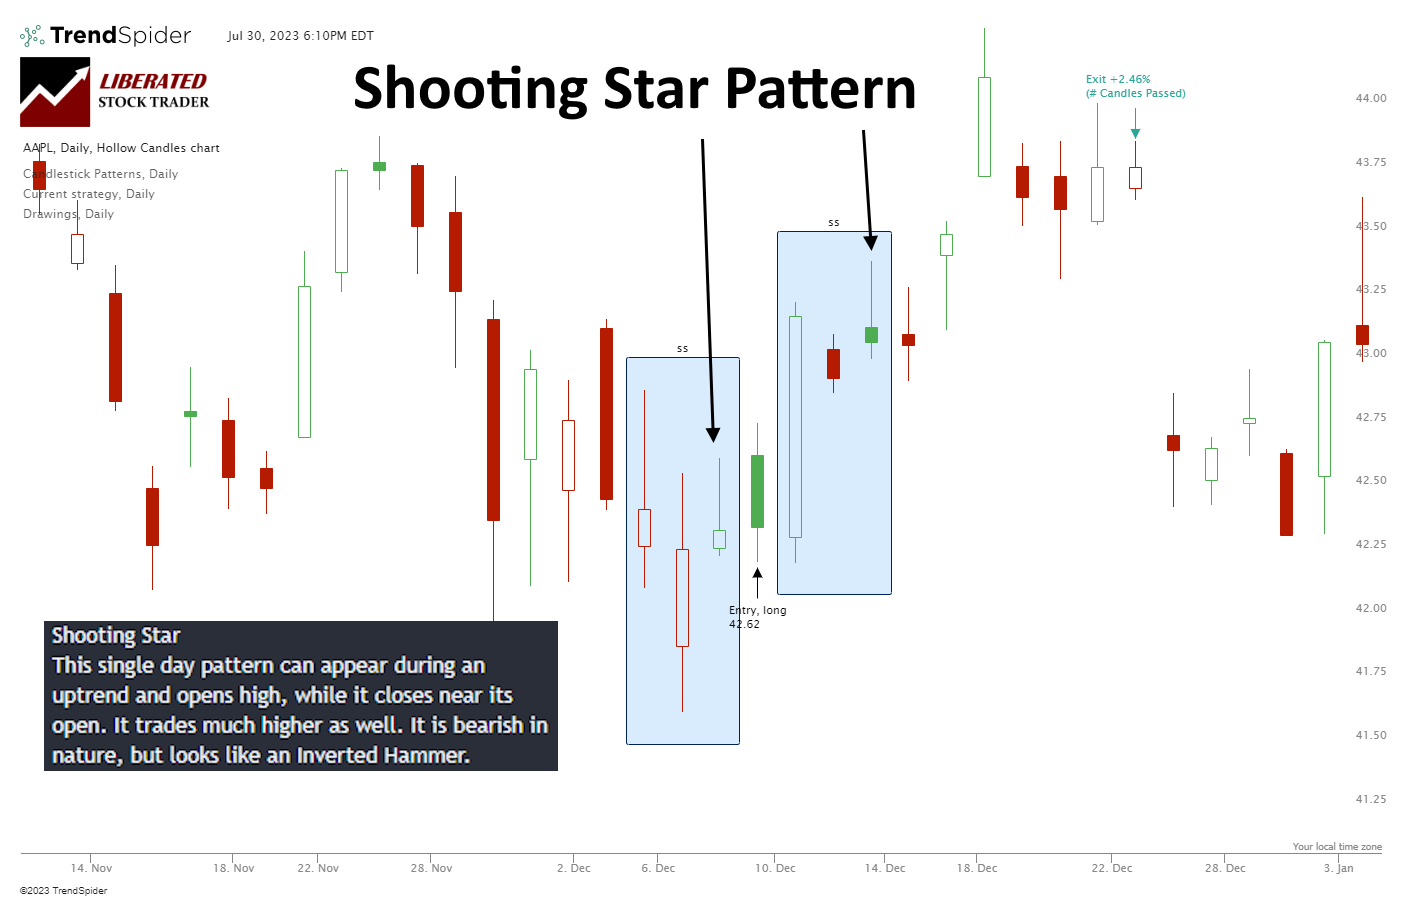
Identifying a Shooting Star Candle Pattern
The Shooting Star is the third candle in a three-candle pattern. With a long tail and a small green body with open and close prices near the day’s lows, it resembles a shooting star falling from the sky. Traditionally perceived as a bearish reversal pattern, our data shows this candle is 57-1% bullish across all market conditions.
8. Doji Candle: 55.6% Win Rate
After conducting 8029 trades, on 548 years of data, we confirm the Doji Win Rate to be 0.52% per trade. The 0.52% win rate means that trading a Doji candle long will net you an average of 0.52% profit per trade if you sell after ten days. Conversely, when short-selling a Doji candle, you should expect to lose 0.52% per trade.
The percentage of winning trades was 55.6% versus 44.4% losing trades; this is about average for the performance across all candlestick types. The Max Drawdown was -47.5%, versus the stock’s drawdown of -59.2%, which shows less volatility than a buy-and-hold strategy.
| Test Results | Doji Candle |
| # Trades Tested | 8,029 |
| Average Return | 0.51% |
| Reward/Risk Ratio | 1.07 |
| % Wins | 55.6% |
| Average Win | 3.7% |
| Average Loss | -3.48% |
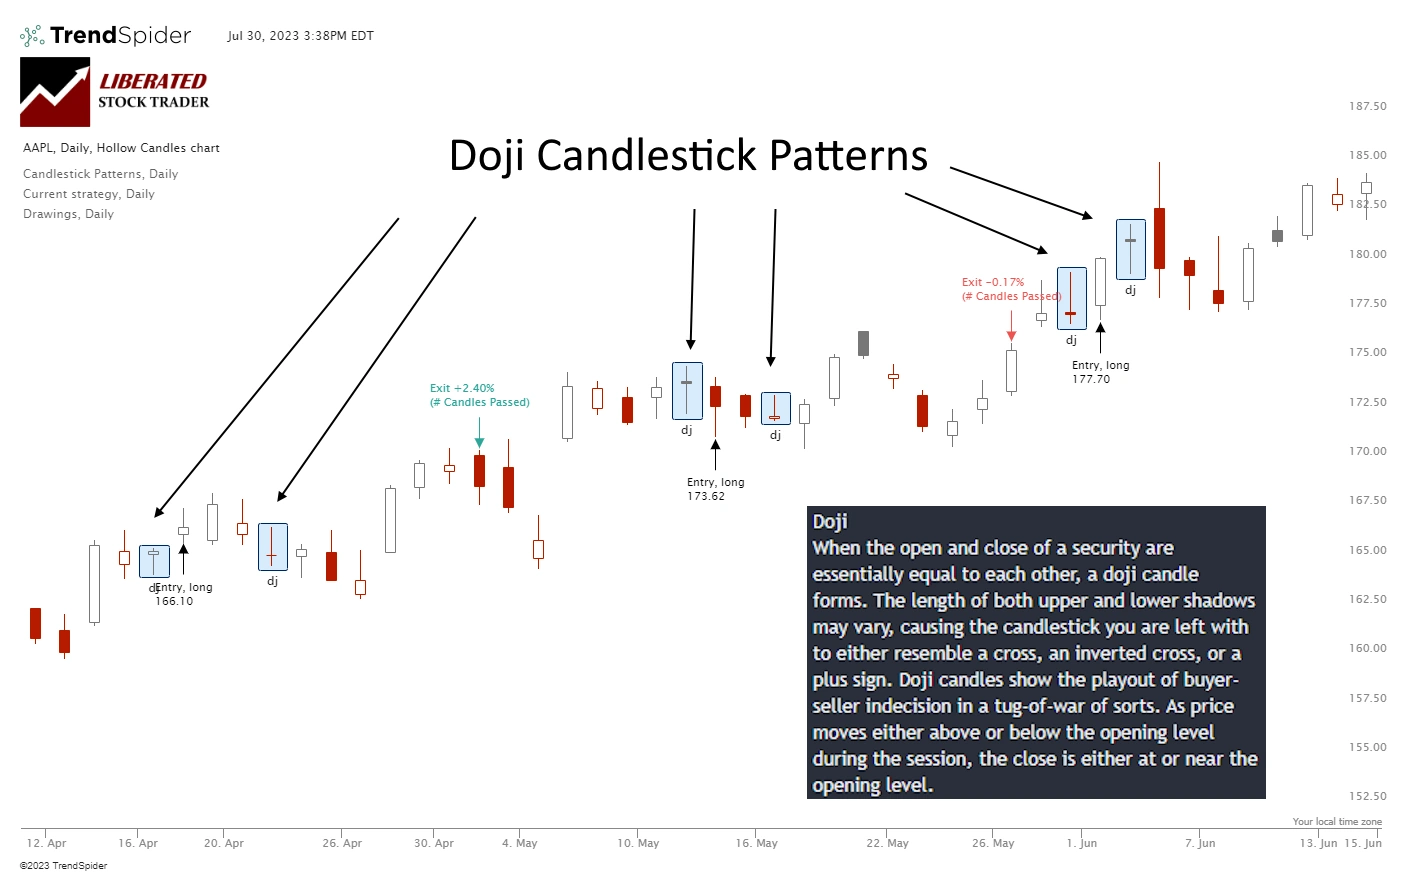
Identifying a Doji
A Doji Candle is a distinctive pattern in candlestick charting used in technical analysis. Its hallmark is that it has virtually the same opening and closing price, giving it a skinny line or “cross” appearance. This pattern indicates a balance of forces, suggesting that a change in the market direction might be imminent.
Doji candles indicate market indecision, which could signal potential trend reversals or continuation, depending on the recent price action. Investors should always monitor these formations for confirmation before taking any positions in the market.
9. Bullish Harami: 55.2% Win Rate
The Bullish Harami is less reliable than the Bullish Harami Cross. The percentage of Bullish Harami winning trades was 55.2% versus 44.8% losing trades, lower than the 55.8% average performance across all candlestick types. The Max Drawdown was -41.5%, versus the stock’s drawdown of -59.6%, which shows less volatility than a buy-and-hold strategy.
The average winning trade was 3.9% over ten days, and the average losing trade was -3.6%, suggesting razor-thin profit margins, especially when combined with the 55.2% successful trades. The average win for all trades was 0.50% per trade, which ranks the Bullish Harami 9th best in our testing.
| Test Results | Bullish Harami |
| # Trades Tested | 4,015 |
| Average Return | 0.50% |
| Reward/Risk Ratio | 1.09 |
| % Wins | 55.2% |
| Average Win | 3.9% |
| Average Loss | -3.63% |
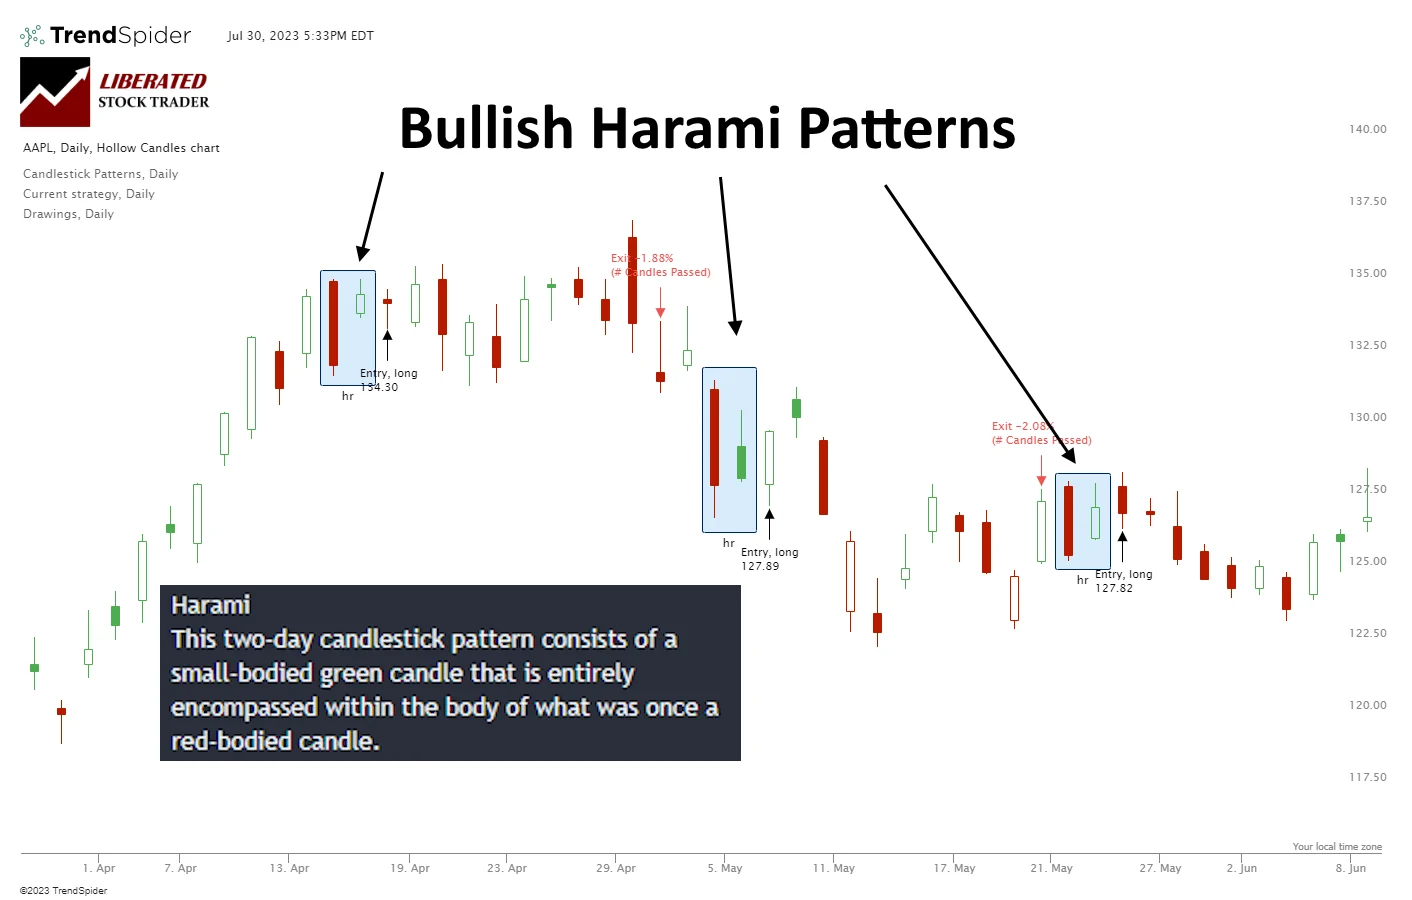
Identifying a Bullish Harami
A Bullish Harami pattern is a two-candlestick chart pattern that signifies the end of a bearish trend and the potential onset of a bullish trend. The first candlestick will often be a bearish bar, indicating that the market has dropped significantly during that period. The second candle is bullish, indicating buyers have stepped in and pushed prices back up from their earlier lows.
10. Spinning Top: 55.9% Win Rate
The Spinning Top pattern had an overall success rate of 55.9%, with an average return of 0.49% and a reward/risk ratio of 1.04. It was successful in 5,535 out of 9,894 trades, yielding an average win of 3.7%. The Average Loss for this pattern was -3.59%.
| Test Results | Spinning Top |
| # Trades Tested | 9,894 |
| Average Return | 0.49% |
| Reward/Risk Ratio | 1.04 |
| % Wins | 55.9% |
| Average Win | 3.7% |
| Average Loss | -3.59% |
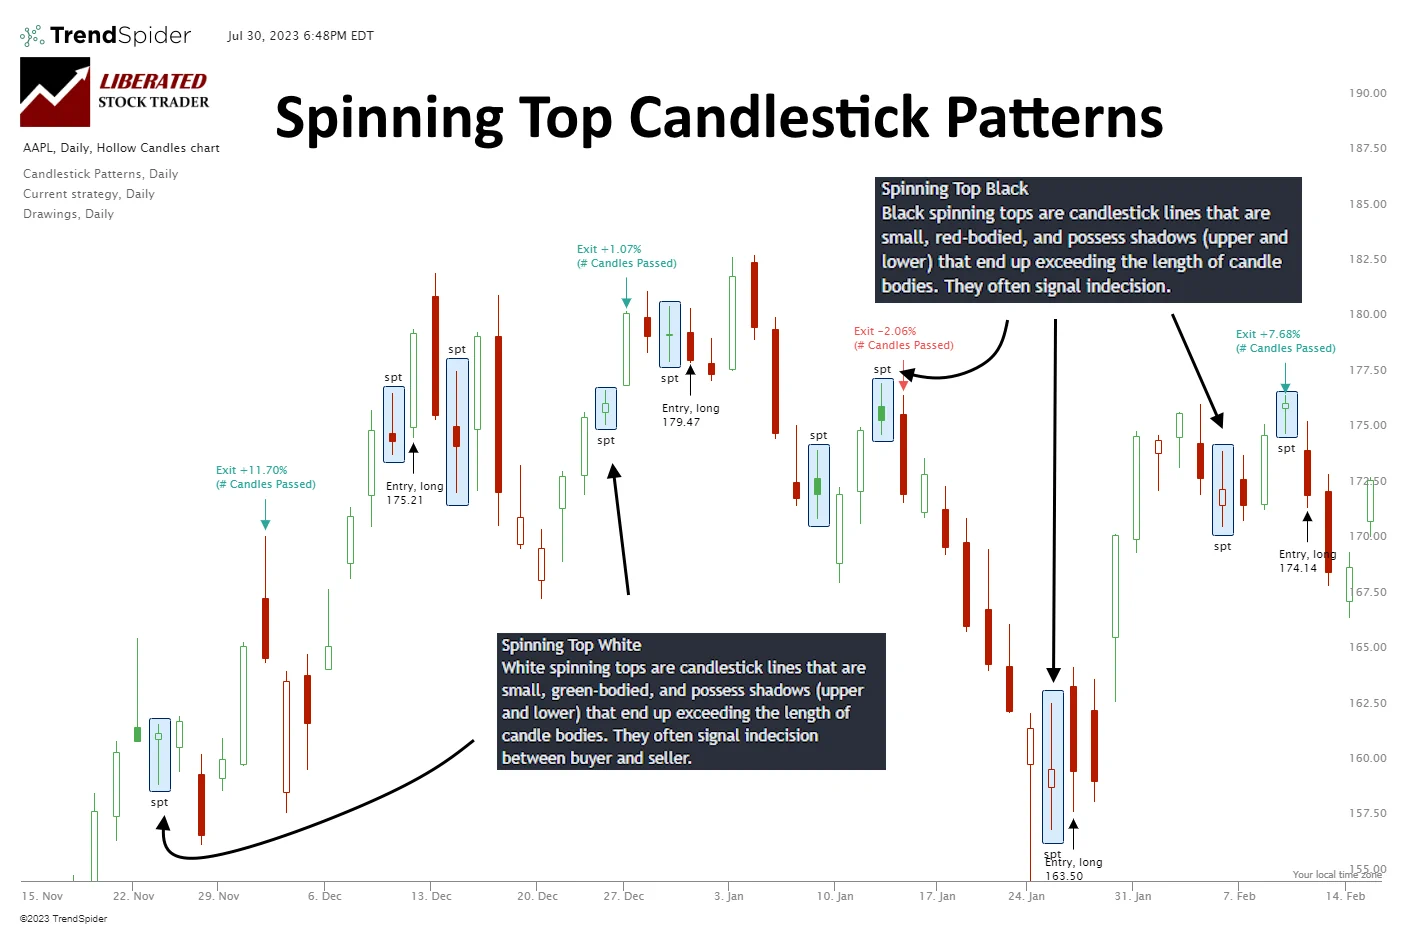
Identifying a Spinning Top
The Spinning Top candle is identified by a relatively small body in the context of the trading range. The upper and lower shadows are longer than the body, giving it a “spinning top” appearance. Spinning Tops indicate indecision on the part of traders and can indicate a trend reversal or consolidation.
When trading this pattern, traders should look for entry points near resistance or support. It’s best to trade this pattern only when the market is trending. Traders can also wait for a confirmation candle before entering a position. This helps reduce the risk of false signals and unprofitable trades.
Summary
Based on our 58,680 test trades, the most accurate candle patterns are the Inverted Hammer (a 60% success rate), followed by the Bearish Marubozu (56.1%), Gravestone Doji (57%), and Bearish Engulfing (57%).
The Inverted Hammer is the most profitable candle pattern, with a 1.12% profit per trade.
Thanks to this research, we have proof that candlestick patterns work. However, the profit margins are slim with candlestick patterns because they are only predictive for a maximum of 10 days. Each of these ten reliable and profitable chart patterns has a greater than 50% chance of success and an average profit potential of 0.51% per trade.
FAQ
What is the best software for candle pattern trading?
The best software for candle pattern trading is TrendSpider because it has a complete solution for pattern recognition, backtesting, and even Bot integration for auto-trading. Plus, you do not need coding skills to use it; the entire system is point-and-click simplicity.
What are the most profitable candlestick signals for trading?
The most profitable candlestick signals for trading are the Inverted Hammer (60% success rate), Bearish Marubozu (56.1%), Gravestone Doji (57%), and Bearish Engulfing (57%). The Inverted Hammer is the most profitable pattern, generating a remarkable 1.12% profit per trade.
What is the success rate of candlestick patterns?
The success rate of candlestick patterns can vary depending on the pattern but generally hover around 54-60%. The most successful is the Inverted Hammer, which has a 60% success rate. It also has an average profit potential of 1.12% per trade.
Are there any risks with trading candlestick patterns?
Yes, there are always risks with trading. Candlestick signals carry the same risks as any other form of technical analysis. As such, practicing due diligence and research is important before entering a trade.
What are some must-know candlestick patterns for successful trades?
Some must-know candlestick patterns for successful trades are the Inverted Hammer, the Bearish Marubozu, and the Gravestone Doji. Each of these patterns has unique characteristics that can indicate potential bullish breakouts.
Which candlestick patterns have the highest performance?
The candles with the highest performance per trade over a 20-year test period are the Inverted Hammer (1.12%), the Bearish Marubozu (0.8%), and the Gravestone Doji (0.65%).
Why are candlestick patterns important in day trading?
Candlestick patterns are important in day trading because they can provide useful insights into the strength and direction of a security's price action. For example, a bullish continuation pattern may indicate that a stock's trend will likely continue upward. In contrast, a bearish reversal signal could indicate that the trend is about to reverse downwards.
What is the most reliable candle pattern in trading?
The Inverted Hammer is the most reliable candle pattern in trading, which predicted 60% accurate bullish trades over 1,702 trades based on 588 years of backtested data. Additionally, it returned an average of 1.12% per trade.
How many candlestick patterns are there?
There are 82 common variations of candlestick patterns. The most popular are the Inverted Hammer, Hanging Man, Bullish Engulfing, Bearish Engulfing, Piercing Pattern, Dark Cloud Cover, Doji Star, Shooting Star, and Harami Cross.
Which timeframe is best for candle patterns?
The best timeframe for candlestick patterns is daily. Japanese Candlesticks were originally designed with daily charts in mind; 200 years ago, the technology was not available for trading on intraday charts. Most candlestick reliability testing is performed on daily charts.
Which candle pattern is most bullish?
The most bullish candle patterns are the Inverted Hammer (60% bullish), the Shooting Star (57.1% bullish), and the Bearish Engulfing and Bearish Marubozu (57% bullish). The most profitable is the Inverted Hammer, with a 1.12% win per trade.
Is candle pattern trading profitable?
Yes, candlestick pattern trading can be profitable when done properly. Candle pattern traders must recognize the pattern, wait for the breakout, understand the probability of success, and set a realistic target. These steps balance the risk (success probability) and reward (price target).
Why do candle patterns fail in trading?
Successful candle patterns fail in trading because market sentiment changes quickly. Breaking financial news can disrupt the market and cause a candle to fail. Also, candle patterns are predictive for only 3 to 10 days, making them prone to market fluctuations, meaning candles only predict successfully 60% of the time.
Thanks for this unique research. Not many people doing the backtesting to find out what actually works in candlestick trading.
Hi Dom, you are correct. The margins for these short-term trades are very tight. The methodology is that you need to choose the high probability trades and trade them often, in small amounts to make an overall profit over time. However, stock chart patterns can have a much better win probability. Check this article on Chart pattern success rates out.
It seems like some of the risk reward ratios and percent chances of increase are quite slim? Are candlestick patterns really worth trading.