Best of all, the automated trading algorithms have been audited and backtested for performance results. Tickeron offers hundreds of in-house and community-developed strategies and scans for you to try.
Composite Lab Performance Score (CLPS)
Tickeron’s CLPS is essentially “pulled up” by signal quality + AI depth + strong usability speed, and “pulled down” by thin charting depth and below-median scanning/backtesting breadth.
| Metric | Tickeron | High | Median | Low |
|---|---|---|---|---|
| Composite Lab Performance Score (CLPS) | 4.19 | 4.75 | 4.21 | 2.93 |
| Composite Lab Performance Score (CLPS) Overall Test Winners | TradingView 4.75 | TrendSpider 4.72 | Trade Ideas 4.52 |
Tickeron is designed to generate and operationalize AI trade ideas (patterns, trend calls, robot-style workflows) rather than replace a pro charting terminal.
Tickeron Ratings & Verdict
My Tickeron testing confirms impressive AI-powered chart pattern recognition and prediction algorithms for stocks, ETFs, Forex, and Cryptocurrencies. Tickeron provides reliable thematic model portfolios, specific pattern-based trading signals, success probability, and AI confidence levels.
| Test | Tier | Score | Median |
|---|---|---|---|
| Lab Test Composite Score (CLPS) | A | 4.19 | 4.21 |
| Pricing Index: $ per Day | A | $4.11 | $2.74 |
| Value Score (VP) | B | 3.26 | 2.82 |
| Speed & Ease of Use | AAA | 4.83 | 4.50 |
| Chart Analysis Depth Index | C | 0.77 | 3.17 |
| Chart Pattern Depth & Accuracy | B | 3.43 | 2.73 |
| Scanning Performance | C | 2.05 | 3.38 |
| Backtesting Performance | C | 1.88 | 3.38 |
| Trading Bot & Auto-Trading Reliability | A | 4.00 | 2.50 |
| AI & Algo Index | AA | 4.50 | 2.00 |
| Alert Speed | A | 4.00 | 3.67 |
| Trade Signal Quality | AAA | 5.00 | 0.00 |
| Broker Connectivity & Ecosystem Depth | B | 3.17 | 2.00 |
| Portfolio Tool Performance | B | 3.00 | 2.80 |
| Financial News Speed & Depth | C | 2.80 | 2.80 |
| Community Utility Index (CUI) | C | 2.75 | 3.25 |
| Support Infrastructure & SLA Audit | C | 2.75 | 3.75 |
Pros
✔ 45 Streams of Trade Ideas
✔ AAA 5.00 Trade Signals
✔ Real-Time Pattern Recognition for Stocks, ETFs, Forex, and Crypto
✔ AI Trend Prediction Engines
✔ Investing Portfolios with Audited Track Records
✔ Build Your Portfolios with AI
Cons
✘ Custom Charting Limited
✘ Cannot Plot Indicators
✘ Complicated Pricing

Tested using benchmarking system v3.
See the 2026 v3 58-point Tickeron test and benchmarks.
Tickeron’s trading platform is unique and innovative. It combines artificial intelligence and human intelligence based on the community of traders, so you can compare what humans think versus what machines think.
Key Features
| ⚡ Tickeron Features ? | Portfolios, Watchlists, Screening, 45 Streams of Trade Ideas |
| 🏆 Unique Features ? | Real-time AI Trading Signals for ETF, Forex & Crypto & Pattern Recognition, AI Portfolios |
| 🎯 Best for | Day & Swing Traders |
| ♲ Subscription | Monthly, Yearly |
| 💰 Price | $0 | $250 | $125 |
| 💻 OS | Web Browser, PC |
| 🎮 Trial | 14-Day Free Trial |
| ✂ Discount | 50% Discount on Yearly Plan |
| 🌎 Region | USA |
What is Tickeron?
Tickeron is a wholly owned subsidiary of SAS Global, a leader in data analytics whose services are used by most Fortune 500 companies.
Tickeron vs. Competitors
Our tests compare Tickeron to Trade Ideas, TrendSpider, and TradingView. Trade Ideas is the best for black box AI-driven robotic day trading. TrendSpider is better for automated stock chart analysis, backtesting, and automated trading. Stock Rover is better than Tickeron for long-term investors. Benzinga Pro is a better alternative for trading real-time news.
| Features? | Tickeron | Trade Ideas | TrendSpider | TradingView | MetaStock |
| Rating ? | 4.19 | 4.52 | 4.72 | 4.75 | 42.00 |
| Pricing | $0 | $250 | $125 | $89 | $178 | $54 | $214 | $0 | $15 | $35 | $70 | $100 | $265 |
| Global Market Data | USA | USA | USA | ✔ | ✔ |
| Black Box AI Algorithms* | ✔ | ✔ | ✘ | ✘ | ✘ |
| Powerful Charts | ✘ | ✔ | ✔ | ✔ | ✔ |
| Stocks | ✔ | ✔ | ✔ | ✔ | ✔ |
| Futures | ✘ | ✘ | ✔ | ✔ | ✔ |
| Forex | ✔ | ✘ | ✔ | ✔ | ✘ |
| Cryptocurrency | ✔ | ✘ | ✔ | ✔ | ✘ |
| Social Community | ✔ | ✔ | ✘ | ✔ | ✘ |
| Real-time News | ✘ | ✘ | ✘ | ✘ | ✔ |
| Screeners | ✔ | ✔ | ✔ | ✔ | ✔ |
| Backtesting | ✔ | ✔ | ✔ | ✔ | ✔ |
| Code-Free Backtesting | ✘ | ✘ | ✔ | ✘ | ✘ |
| Automated Analysis | ✔ | ✔ | ✔ | ✔ | ✔ |
Pricing Index
On price-to-capability, Tickeron sits above the median cost-per-day ($2.74) and the median EMC ($83.32), so it’s not a budget tool. But the pricing makes more sense when you interpret the platform as AI research + signal generation rather than charting. The $/feature number ($8.93) is also above the median ($5.95), indicating that what you’re paying for is not “more checkboxes” but higher-cost compute and proprietary models. Bottom line: pricing is reasonable if you actually use the AI modules; expensive if you just want charts.
| Metric | Calculation | Tickeron | High | Median | Low |
|---|---|---|---|---|---|
| Cost-per-day | $/day on annual plan (minimum viable plan w/ real-time exchange data) | $4.11 | $9.99 | $2.74 | $0.74 |
| $ per feature | Effective Monthly Cost / Total Features | $8.93 | $23.37 | $5.95 | $1.94 |
| Effective Monthly Cost (EMC) | (Plan price + required data fees + key add-ons) / month | $125.00 | $303.87 | $83.32 | $22.50 |
Tickeron’s paid value lives in its AI modules (robots, predictive scans, pattern engines) and the workflows around them—screening, signal delivery, and performance tracking. These are typically the product areas that justify higher effective monthly costs because they depend on centralized computation and ongoing model operations.
Tickeron offers a free Beginner plan that enables portfolio creation, alerting, and AI investment ideas. The premium Tickeron plans are overly complex, with services aimed at swing traders, day traders, and investors.
Tickeron’s beginner service enables you to create portfolios based on industries, sectors, and your risk profile. The Tickeron system will create a diversified portfolio within a few clicks and assign you a diversification score (DIV Score). Tickeron’s free service is a good place to begin exploring the wealth of information and tools.
All Tickeron Intermediate One plans cost $25-50/mo annually and include access to one AI Robot, the AI Pattern Search Engine, and the AI Prediction Engine. This plan also includes AI trade ideas and the full suite of portfolio management tools.
The Tickeron Intermediate Two plan costs $60-105/mo annually and includes access to the AI Pattern Search Engine, the AI Prediction Engine, and the AI screener. The patterns include real-time, Forex, and crypto, specifically for day traders.
The Tickeron Expert plan includes access to all AI Bots, signals, backtesting, time machine, and real-time data for all services. If you are serious about using AI for trading and investing, I recommend the Expert service on an annual plan.
Tickeron has made the service plans very difficult to understand, but if you opt for the Expert plan, you get everything for $250/mo or $125/mo on an annual plan.
Tickeron 50% Discount
You can immediately save 50% on all Tickeron’s plans by signing up for a single annual payment rather than paying monthly. This radically reduces the cost of the Expert plan from $250 per month to $125, which makes it a very cost-effective AI trading service.
Value Score (VP)
Tickeron’s Value Score (3.26) is above the median (2.82) and driven by feature depth (3.75) and feature quality (3.22), not device coverage (device support depth = 2). The breadth count (14) is also comfortably above the median benchmark (12). Practically, this means users get a meaningful set of tools (signals, AI screening, pattern modules, alerting) that feel “complete” for their intended job—idea generation and evaluation —while still lacking the universal accessibility of truly cross-platform charting leaders. Value here is strongest for users who treat Tickeron as a daily decision assistant.
| Metric | Calculation | Tickeron | High | Median | Low |
|---|---|---|---|---|---|
| Value Score | 60% Feature Quality + 30% Feature Depth + 10% Device Support | 3.26 | 4.37 | 2.82 | 1.70 |
| Value Rank | Percentile ranking | 3.25 | 5.00 | 2.50 | 1.00 |
| Feature Quality | Average of all feature-quality ratings | 3.22 | 4.16 | 2.97 | 2.00 |
| Feature Breadth | Count of meaningful core features | 14 | 17 | 12 | 9 |
| Feature Depth | Percentile ranking | 3.75 | 4.75 | 3.00 | 1.00 |
| Device Support Depth | Web=2 pts; PC/Android/iOS=1 pt each | 2.00 | 5.00 | 2.00 | 1.00 |
| Value Score Test Winners | TradingView 4.37 | TrendSpider 4.20 | Trade Ideas 4.05 |
Tickeron’s “value” is concentrated in AI-first workflows: AI screeners, pattern engines, and AI Robots with performance visibility. That aligns with our feature depth score (3.75): there’s enough operational substance to keep users inside the ecosystem rather than exporting everything elsewhere. The trade-off is device depth: much of the platform experience is optimized around the core web workflow rather than being universally seamless across all device classes.
Is Tickeron Worth The Money?
Yes. Tickeron is worth the money if you are an active day or swing trader because it provides high-probability AI-backtested trading signals and fully audited performance results. Tickeron is a professional company developing strategies to help traders improve their performance.
You will need a trading account balance of at least $25K to engage in active pattern day trading.
Tickeron is worth the subscription if:
- You are an active day trader or swing trader.
- You want to become a full-time day trader.
- You can maintain a minimum trading account balance of $25,000 (if you are a US resident).
- You want the power of AI on your side to beat the market.
Speed & Ease of Use
Tickeron’s Speed & Use Index AAA 4.83 is near the top of our dataset, showing a 0.95s time-to-chart, a 5.0 performance score, 99ms multi-chart latency, and 4.5 multi-monitor sync—these are “fast workflow” numbers. Ease of use is also strong: the 3-click rule score is 5.0 with only 3 clicks in our test. Interpretation: the platform is optimized for rapid idea consumption—scan → evaluate → act—rather than slow, complex workstation configuration. Users who value immediacy (signals, setups, lists) will quickly notice this advantage.
| Metric | Calculation | Tickeron | High | Median | Low |
|---|---|---|---|---|---|
| Speed & Use Index Rating | Avg of Time-to-Chart, Multimonitor Speed & 3-Click Rule | 4.83 | 5.00 | 4.50 | 3.30 |
| Time to Chart Speed (seconds) | Seconds to fully loaded chart (200 bars + 2 indicators) | 0.95 | 17.03 | 4.70 | 1.60 |
| Time to Chart Performance (points) | <5s=5; <10=4.5; <15=4; <20=3 | 5.00 | 5.00 | 4.50 | 3.00 |
| Multi-Chart Latency (ms) | Delay syncing multiple charts | 99 | 667 | 209 | 10 |
| Multimonitor Chart Speed (points) | Sync points by ms threshold | 4.50 | 5.00 | 3.50 | 0.00 |
| 3-Click Rule Test (clicks) | Clicks to place trade or launch scan | 3 | 6 | 3 | 2 |
| 3-Click Rule: Ease of Use (points) | 5 points; each click >3 deducts 1 | 5.00 | 5.00 | 3.00 | 2.00 |
| Speed & Ease of Use Test Winners | TradingView 5.00 | Stock Rover 5.00 | Seeking Alpha 5.00 |
This speed profile aligns with the product design: Tickeron emphasizes prebuilt AI outputs (bots, screeners, pattern calls) that reduce time spent building charts and scripts. Instead of forcing users into extensive customization, it guides them through decision panels and ranked candidates.
Overall, Tickeron is easy to use and provides enough power for demanding traders. You do not need to install software or configure data feeds. The most difficult element of Tickeron is figuring out the pricing model, which is overly complex and granular. I spoke with my contact at Tickeron, who told me they are working to simplify the pricing structure.
Trade Signal Quality
Tickeron earns the maximum here AAA 5.00, indicating it delivers audited, explicit trade signals rather than vague sentiment gauges. That matters because signal platforms often fail on verifiability—plenty of “ideas,” little specificity.
| Metric | Calculation | Tickeron | High | Median | Low |
|---|---|---|---|---|---|
| Signal Alpha & Predictive Efficacy | 5 = audited specific trade signals; 2.5 = gauges | 5.00 | 5.00 | 0.00 | 0.00 |
| Trade Signal Quality Test Winners | Trade Ideas 5.00 | Seeking Alpha 5.00 | Tickeron 5.00 | Motley Fool 5.00 |
In our dataset, Tickeron is categorized as the opposite: concrete outputs that can be judged (entries/exits/targets or comparable explicit actions), which is why the score is perfect even though charting depth is weak. So the platform’s edge isn’t analysis flexibility; it’s signal actionability and repeatable decision-making outputs.
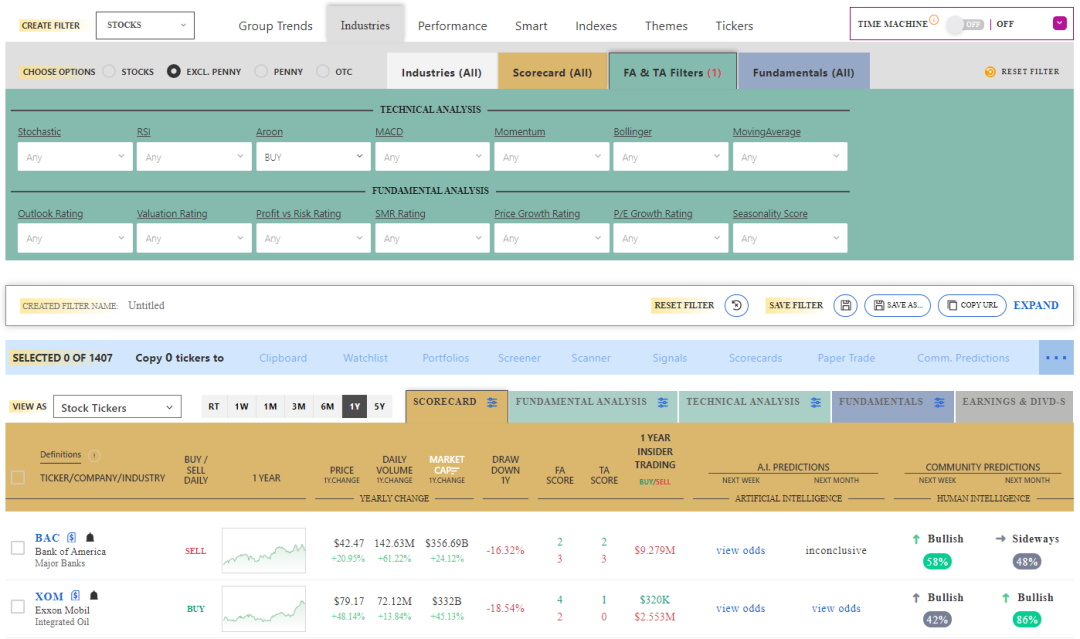
Tickeron has implemented a powerful feature called AI Confidence Level. Based on the stock’s history, the success rate of a particular pattern, and the market’s current direction, Tickeron can assign a confidence level to a trade prediction.
The screenshot below shows that the Tickeron AI predicts that ABUS has an 88% chance of declining in value and ACET has an 81% chance of increasing in value.
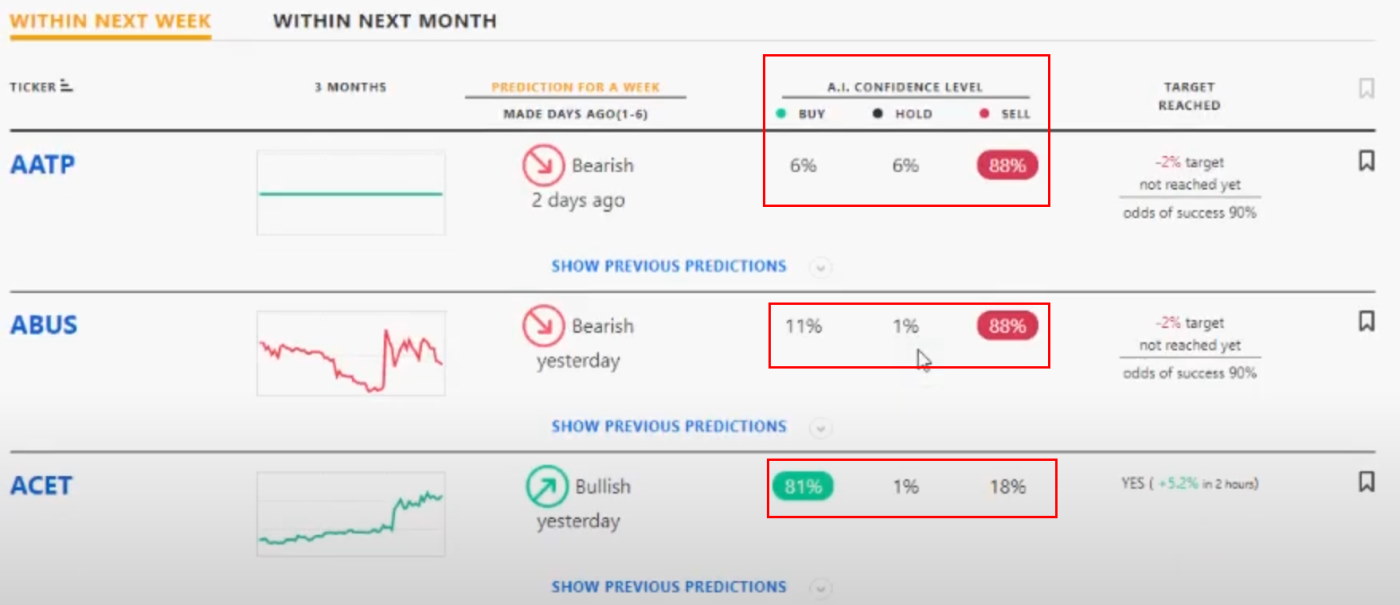
The outstanding feature of the Tickeron prediction engine is that you can click “Show previous predictions” to check if the AI has done a good job in the past with a particular pattern on specific stocks. The prediction engine provides the right level of clarity and granularity to help you make informed trading decisions.
AI & Algo Index
This is Tickeron’s flagship: AA 4.50 is well above the median (2.00). Algo depth = 2.0, AI layer = 1.5, and transparency = 1.0. That combination signals a platform where AI is not cosmetic; it’s structurally central while still providing enough explainability to avoid pure black-box behavior.
In practice, this score indicates that Tickeron is designed to generate ideas, not merely visualize markets. Users who want “the system to propose trades and probabilities” will see immediate value; pure discretionary chartists won’t fully benefit.
| Metric | Calculation | Tickeron | High | Median | Low |
|---|---|---|---|---|---|
| Automated Execution & Bot Reliability | Automation Path + Sophistication + Op Assurance | 4.50 | 4.50 | 2.50 | 1.50 |
| Automation Path | 0.5 none; 1 alerts; 1.5 webhook; 2 native execution | 2.00 | 2.00 | 1.00 | 1.00 |
| Strategy/Bot Sophistication | 0.5 simple → 2 “bot platform” depth | 2.00 | 2.00 | 1.50 | 1.00 |
| Operational Assurance | 0.5 status; 1 SLA/credits uptime promise | 0.00 | 1.00 | 0.00 | 0.00 |
| AI & Algo Index Test Winners | TrendSpider 5.00 | Trade Ideas 4.50 | Tickeron 4.50 |
Tickeron uses AI rules to generate trading ideas based on pattern recognition. Firstly, they use a database of technical analysis patterns to search the stock market for stocks that match those price patterns using their pattern search engine. Each detected pattern has a backtested track record of success, and this pattern’s success is factored into the prediction using their Trend Prediction Engine.
AI Robot Performance
Tickeron is the only AI software, apart from Trade Ideas, that shares its track record of success. Of the 34 AI Trading Bots I looked at, only 2 claimed less than a 30% annualized gain; the other AI Bots claimed from a 40% to 169% annualized gain, as shown in the image below. Tickeron claims impressive returns and audits all returns trade by trade.
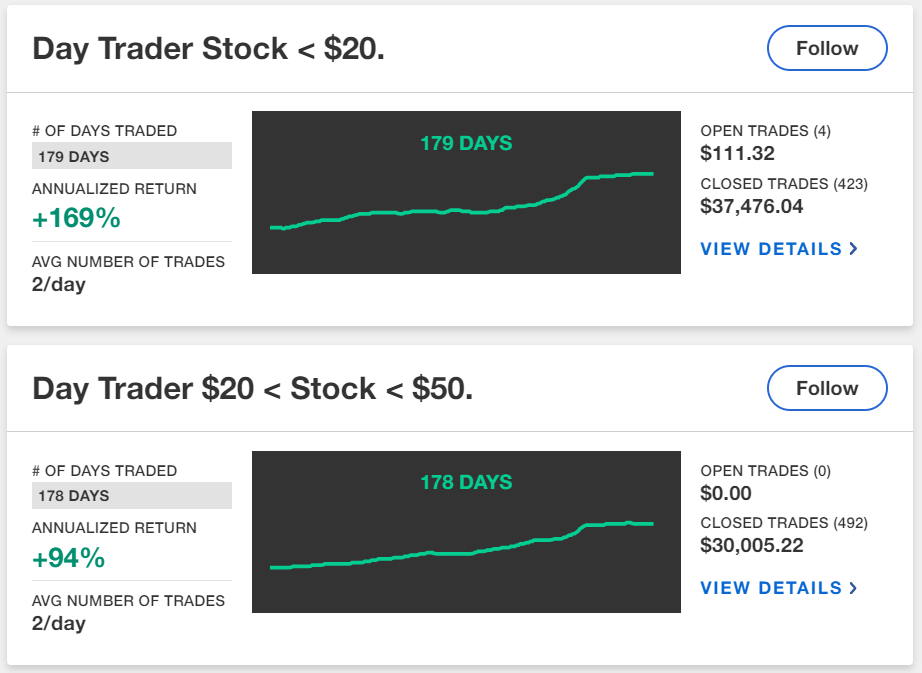
The Day Trader Stock >$20 Bot claims a 61.64% Win Rate, which is very high, especially when compared with this Fast Company report.
Audited Track Record
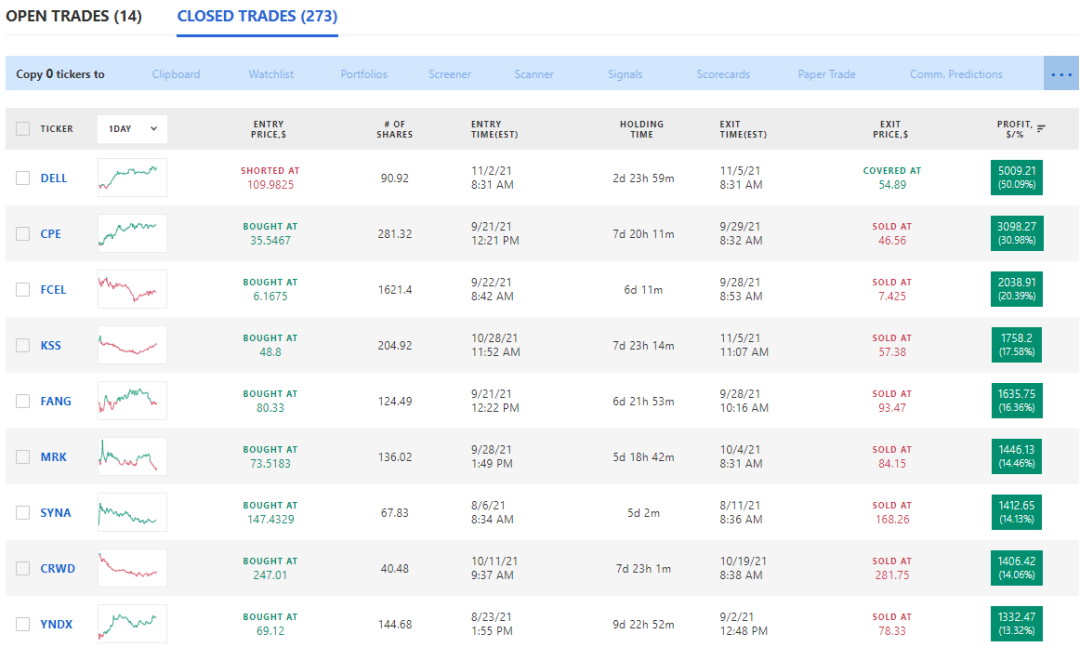
Tickeron highlights the performance of its AI algorithm by providing a fully audited track record of every stock Bot under management. Before purchasing a strategy, you can view its full performance summary, trade amounts, percentage of profitable trades, Sharpe ratio, and trade duration.
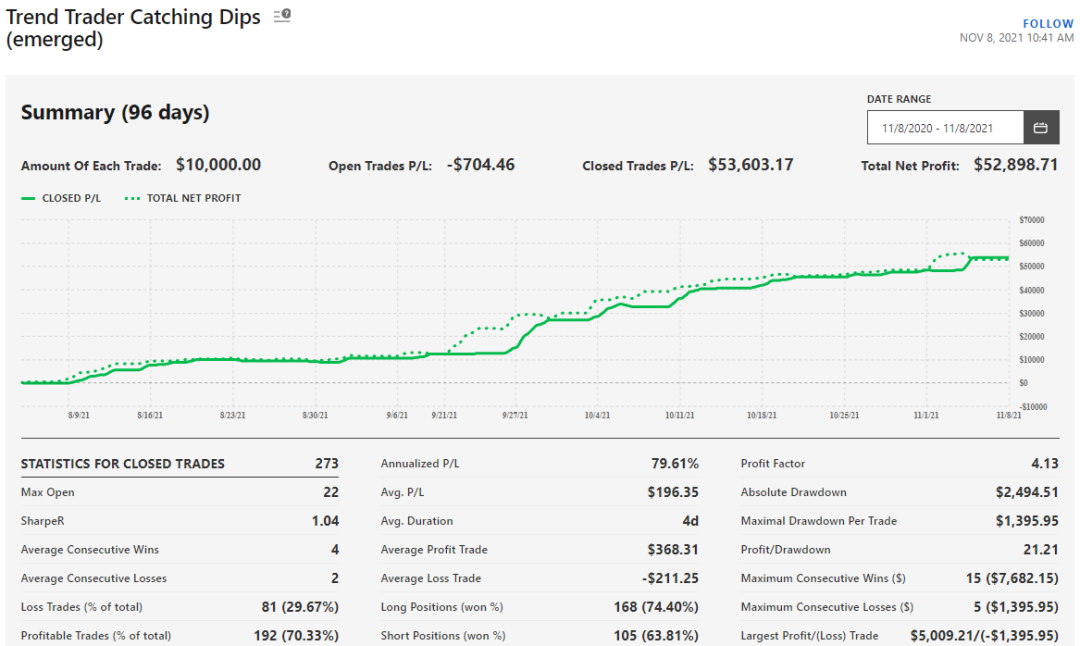
Auditing the individual historical trade alerts issued by the AI software is also important. Trade Ideas and Tickeron allow you to see all historical trades, whether they win or lose; transparency is the key here.
A unique feature of Tickeron is the ability to compare the AI prediction engine’s forecast with the community’s predictions. The image above shows that 58% of the community believes Bank of America will increase in price. This is a fascinating insight, and I look forward to Tickeron publishing research on the accuracy of human prediction versus artificial intelligence algorithms.
Chart Analysis Depth Index
Chart depth is Tickeron’s clearest weakness: 0.77 is far below the median (3.17). Our sub-metrics explain why: chart types = 1 (depth score 0.3) and no custom indicator coding (0). Even with 80 indicators (depth score 2.0), the overall charting offering remains shallow because the platform is not engineered as a discretionary chart workstation. Practically: if your core workflow is multi-layout charting, custom scripting, and deep indicator experimentation, you’ll hit limits quickly. This score is not a bug—it’s a product identity: AI outputs over charts.
| Metric | Calculation | Tickeron | High | Median | Low |
|---|---|---|---|---|---|
| Chart Analysis Depth Index | Avg of Chart Depth + Indicator Depth + Custom Coding | 0.77 | 5.00 | 3.17 | 0.50 |
| Chart Types | Total count | 1 | 38 | 10 | 1 |
| Chart Depth (points) | 0.3 points per chart type | 0.30 | 5.00 | 3.00 | 0.30 |
| Indicators | Total count | 80 | 400 | 116 | 0 |
| Indicator Depth (points) | 0.025 points per indicator | 2.00 | 5.00 | 2.90 | 0.00 |
| Custom Indicator Coding | Available = 5 points | 0.00 | 5.00 | 0.00 | 0.00 |
| Chart Analysis Depth Index Test Winners | TradingView 5.00 | MetaStock 5.00 | Optuma 5.00 |
Chart Pattern Depth & Accuracy
Tickeron performs strongly in pattern efficacy (3.43) because it combines meaningful pattern breadth (64 total) with excellent accuracy (95% → 4.75 points). The depth score (2.112) indicates it’s not the widest library in the lab, but it’s robust enough to be useful across many strategies, especially when the accuracy remains high. The implication: Tickeron is better at pattern-as-signal than pattern-as-chart-decoration.
| Metric | Calculation | Tickeron | High | Median | Low |
|---|---|---|---|---|---|
| Pattern Recognition Efficacy & Accuracy | Avg of Pattern Depth + Accuracy points | 3.43 | 4.88 | 2.73 | 0.00 |
| Total Patterns | Count of unique patterns recognized | 64 | 226 | 57.5 | 0 |
| Pattern Recognition Depth (points) | 0.33 points per pattern | 2.112 | 5.00 | 1.90 | 0.00 |
| Candle Patterns Recognized | Count | 25 | 172 | 22.5 | 0 |
| Price & Trend Patterns Recognized | Count | 39 | 54 | 24 | 0 |
| Accuracy (%) | Percent accurate | 95 | 95 | 89.5 | 0 |
| Pattern Recognition Accuracy (points) | 0.05 points per 1% | 4.75 | 4.75 | 4.48 | 0.00 |
| Chart Pattern Recognition & Accuracy Test Winners | TrendSpider 4.88 | Trade Ideas 4.62 | TradingView 3.98 |
Traders who want pattern recognition that is already “ranked and framed” will like this; traders who want exhaustive libraries and deep customization may still prefer specialist pattern platforms.
At the heart of Tickeron is its AI algorithms’ ability to spot 40 different stock chart patterns in real time. You can select which pattern you want to trade, and it will filter stocks, Forex, or cryptocurrencies that currently show it. Patterns are split into bullish patterns for long trades and bearish patterns for short trades.
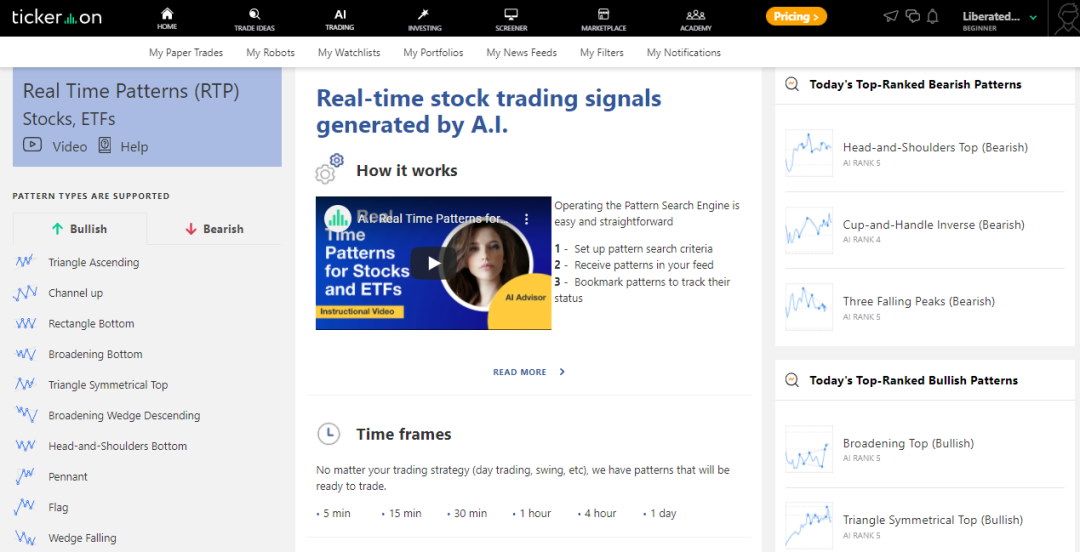
Tickeron’s real-time pattern recognition is particularly useful for swing or day traders, whose top priority is market timing. Tickeron can also scan the entire market and suggest which patterns work best on a particular day. In the screenshot above, you can see “Today’s Top Ranked Patterns,” which rates patterns’ potential success based on the market’s current trading activity.
Tickeron presents users with charts that already have patterns mapped and directions predicted; this is the service’s single biggest benefit. You will be disappointed if you want to perform your technical analysis, configure indicators, or make chart annotations. Using AI in this platform means you will rely more on the algorithms than your creativity, which is probably good for most people.
Pattern recognition saves pattern traders a lot of work hunting for potential trade setups because it does all the work for them.
Scanning Performance
Tickeron’s scanning score (2.05) is below the median (3.38) despite strong raw speed (113ms → 4.5 speed points). The drag comes from the criteria depth (132 → 1.65 points) and the absence of custom code scanning (0). This is an important nuance: it’s fast at what it does, but it doesn’t behave like a programmable scan engine (Trade Ideas / TradingView-style) where you can express almost anything. So the scanner is best interpreted as an AI-guided filter system: quick, opinionated, and structured—rather than a fully expressive quant scan laboratory.
| Metric | Calculation | Tickeron | High | Median | Low |
|---|---|---|---|---|---|
| Market Scanning Latency & Depth | Avg of Speed + Criteria + Custom Code | 2.05 | 5.00 | 3.38 | 0.80 |
| Scanner Performance (ms) | ms to scan S&P 500 across 5 criteria | 113 | 2500 | 300 | 7 |
| Scanning Speed Points | Points by ms thresholds | 4.50 | 5.00 | 4.00 | 1.00 |
| Scanner Auto-Refresh Rate (sec) | Auto-refresh speed (not scored) | 15 | 60 | 1 | 0 |
| Scanning Criteria (count) | Total criteria count | 132 | 675 | 200 | 30 |
| Scanning Criteria (points) | 0.0125 points per criteria | 1.65 | 5.00 | 2.50 | 0.38 |
| Custom Code Scanning | Exists = 5 points | 0.00 | 5.00 | 5.00 | 0.00 |
| Scanning Performance Test Winners | Stock Rover 5.00 | TradingView 4.83 | TrendSpider 4.67 |
Tickeron’s scanning is centered on AI screeners and guided discovery, rather than “write your own scan language.” The AI Screener product framing aligns with this: you use pre-structured filters and AI-derived signals rather than building custom scripting logic.
Screening with Tickeron is more limited than that of the competition. Tickeron can find stocks based on industry, sector, market capitalization, or technical buy-and-sell ratings. But if you want to perform specific screening for value, dividend, or growth stocks, Tickeron is of little use.
Tickeron is designed to find high-probability trading opportunities, not for long-term investors wishing to build a sustainable portfolio. If you are a long-term investor, I recommend Stock Rover.
Backtesting Performance
Backtesting comes in low (1.88) for a very specific reason. Although speed is excellent (40ms → 5.0 points) and no-code is supported (5.0), the platform lacks flexible coding backtesting (0) and multi-stock basket testing (0), and report quality is only mid (50% → 2.5 points).
Tickeron’s “Time Machine” concept aligns with our measured profile: it’s designed as a practical way to look back and evaluate how screens/signals would have performed historically, but it’s not a coding-first research environment.
| Metric | Calculation | Tickeron | High | Median | Low |
|---|---|---|---|---|---|
| Quantitative Backtesting Fidelity | Avg of Speed + No-code + Coding + Reports + Multi-stock | 1.88 | 4.90 | 3.38 | 0.00 |
| Backtesting Speed (ms) | Time to run benchmark simulation (ms) | 40 | 6000 | 302 | 7 |
| Backtesting Speed (points) | Points by ms thresholds | 5.00 | 5.00 | 4.25 | 0.00 |
| No Coding Required | Zero-code backtesting = 5 | 5.00 | 5.00 | 5.00 | 0.00 |
| Flexible Coding Backtesting | Exists = 5 | 0.00 | 5.00 | 5.00 | 0.00 |
| Backtesting Report Quality (%) | Percent of reporting criteria available | 50 | 100 | 70 | 0 |
| Backtesting Report Quality (points) | 0.05 points per 1% | 2.50 | 5.00 | 2.25 | 0.00 |
| Multi-Stock Basket Backtesting | If exists = 5 | 0.00 | 5.00 | 5.00 | 0.00 |
| Backtesting Performance Test Winners | Optuma 4.94 | TrendSpider 4.88 | MetaStock 4.81 |
Tickeron supports “validation-like” workflows—quick checks and retrospectives—but not comprehensive quantitative research, including custom strategy languages and portfolio simulation. If you needa robust strategy research infrastructure, this score is your warning label.
Financial News Speed & Depth
Tickeron’s news score (2.80) aligns with our median benchmark (2.80) and has a stated delay band of roughly 30–90 seconds in our dataset. That’s usable for most retail decision cycles, but it’s not a “news scalper’s terminal” score (Benzinga Pro / institutional feeds).
| Metric | Calculation | Tickeron | High | Median | Low |
|---|---|---|---|---|---|
| Financial News Speed & Quality Rating | Weighted rubric (providers, filtering, alerts, real-time, etc.) | 2.80 | 5.00 | 2.80 | 0.00 |
| Wire delay vs primary feeds | Seconds delay range | 30–90s | <1s | 60–300s | Hours/Days |
| Financial News Speed & Depth Test Winners | MetaStock 5.00 | Benzinga Pro 5.00 | Scanz 5.00 |
News is not the differentiator. Tickeron’s “edge” is AI-driven idea generation, not wire-speed. The dataset basically says: news is serviceable and around median, but if your trading performance depends on ultra-low-latency headlines, you’ll still want a dedicated news terminal.
Tickeron does not have a real-time news service like Benzinga Pro or a huge trading community like TradingView, but it still has some benefits. Tickeron enables its trading community to vote on an asset’s direction; when you vote, you are rewarded with the community prediction. I would not rely on this community information, but it is an interesting insight into the average market participant’s thoughts.
Tickeron also provides a news stream you can view stock by stock to stay informed about current events that may affect your trades.
Alert Speed
Alerting lands strongly (4.00): unlimited concurrent alerts (scored at 5), solid delivery richness (3 streams), and a 4/5 speed rating. This fits a signals-first platform: if the system’s purpose is to push decisions, alerts must work. The only limitation in our dataset is richness, not volume or speed—meaning alerts exist and arrive quickly, but may not cover every enterprise-grade delivery path (e.g., deep webhooks, complex routing) at the same level as automation-first charting platforms.
| Metric | Calculation | Tickeron | High | Median | Low |
|---|---|---|---|---|---|
| Alert Trigger Latency & Delivery Speed | Avg of Concurrent + Streams + Speed Rating | 4.00 | 4.67 | 3.67 | 2.33 |
| Concurrent Alerts (points) | 1 pt per 50 alerts (max 5) | 5.00 | 5.00 | 5.00 | 5.00 |
| Concurrent Alert Count | Count | 1300 | 2000 | 875 | 400 |
| Alert Streams Richness | 1 pt per stream (max 5) | 3.00 | 5.00 | 2.00 | 1.00 |
| Alert Speed Rating | Speed rating (1–5) | 4.00 | 5.00 | 3.00 | 1.00 |
| Alert Speed Test Winners | TradingView 4.67 | TrendSpider 4.33 | Benzinga Pro 4.33 |
For most retail workflows, the alerting score suggests “fast enough to trade.”
Portfolio Tool Performance
Tickeron’s portfolio score (3.00) is slightly above the median benchmark (2.80) and aligns with 40/80 (50%) health-check coverage. That’s respectable: enough analytics to support portfolio-style decision making, but not a full-featured portfolio optimization suite like Stock Rover or Portfolio123.
| Metric | Calculation | Tickeron | High | Median | Low |
|---|---|---|---|---|---|
| Portfolio Health & Risk Analytics | Index rating | 3.00 | 4.80 | 2.80 | 2.00 |
| Health Check & Reporting Depth | “Critical financial metrics” covered | 40/80 (50.0%) | 76/80 (95.0%) | 36/80 (45.0%) | 20/80 (25.0%) |
| Portfolio Tool Performance Test Winners | Stock Rover 4.80 | Portfolio 123 4.80 | Seeking Alpha 4.30 |
Tickeron’s portfolio value reflects “AI-assisted allocation thinking” rather than exhaustive portfolio accounting. The platform leans into model-driven insights and bot-led workflows, which naturally lead to portfolio features such as performance tracking and diversification framing, but not necessarily to comprehensive reporting depth.
Tickeron has a well-thought-out portfolio management service integrated into the platform. Tickeron makes creating a new portfolio incredibly simple. By answering a few questions about your age, goals, investment sum, risk tolerance, and preferred assets (stocks, ETFs), Tickeron will create a customized portfolio. You can continue to tweak your portfolio, and Tickeron assigns a diversification score based on modern portfolio theory (MPT).
In the screenshot above, I created a Liberated Stock Trader portfolio with a good diversification score and excellent allocation quality. The best thing about a Tickeron portfolio is that AI can help you decide which stocks to buy and sell.
AI Portfolios
Tickeron uses its artificial intelligence engine to provide specific stock picks. The algorithm can also be run on a specific index or watchlist to generate trading opportunities for your selected stocks. Tickeron also offers innovative portfolios that use AI to build a portfolio with characteristics like diversification and high return. One specific AI stock asset allocation is “GROWING BIG DATA & CREATING BLOCKCHAINS PASSIVE,” which selects the best mix of AI stocks and blockchain companies.
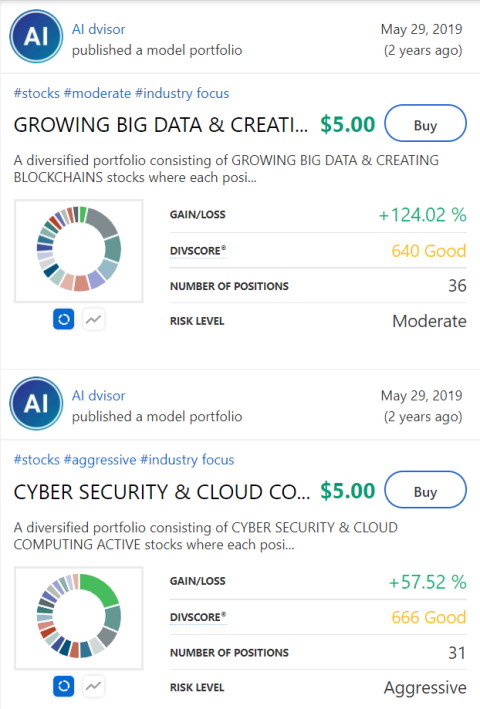
Having tested Tickeron, I have to say it is a very professional, sophisticated, and easy-to-use stock market AI software that delivers results. Tickeron is well worth trying.
Broker Connectivity & Ecosystem Depth
This score (3.17) implies meaningful ecosystem reach but not “platform-as-brokerage” dominance. Our sub-metrics say asset coverage = 4, broker count = 5, and an integration score of 0.5, which is directionally moderate. However, there’s a potential data integrity risk: Tickeron is widely described as an AI research/signal platform, so “Live Trading = 5” should be explicitly justified by a verified execution path. If your intent is “signals routed externally,” then this score makes sense; if your intent is “native broker execution,” you may want to re-verify.
| Metric | Calculation | Tickeron | High | Median | Low |
|---|---|---|---|---|---|
| Asset & Data Coverage Index | Avg of Live Trading + Broker Integration + Asset Coverage | 3.17 | 5.00 | 2.00 | 0.67 |
| Live Trading | If supported = 5 | 5.00 | 5.00 | 0.00 | |
| Total number of brokers integrated | Count | 5 | 1200 | 2 | 0 |
| Broker Integration (points) | 0.1 pt per broker (max 5) | 0.50 | 5.00 | 0.20 | 0.00 |
| Asset & Data Coverage (points) | Stocks/Options/FX/US/Intl = 1 pt each | 4.00 | 5.00 | 2.00 | 2.00 |
| Broker Connectivity & Ecosystem Test Winners | TradingView 5.00 | MetaTrader 5.00 | TrendSpider 4.43 |
The strongest execution-like concept is Virtual Accounts and robot-following workflows (often framed as paper/virtual trading rather than a full broker terminal). That supports an ecosystem story in which trades are modeled, tracked, and followed—while actual brokerage execution may remain external, depending on the setup.
Community Utility Index (CUI)
Tickeron’s community score (2.75) is below the median (3.25), with 2.5 for active community size and 3.0 for contribution quality. The platform is not a “social charting network” (TradingView-style). It may have meaningful content or discussion, but the crowd-density and constant peer-to-peer exchange are not the primary value driver.
| Metric | Calculation | Tickeron | High | Median | Low |
|---|---|---|---|---|---|
| Community Utility Index | Avg of Active Size + Contribution Quality | 2.75 | 5.00 | 3.25 | 1.75 |
| Active Community Size | “Crowd density” scale (0–5) | 2.50 | 5.00 | 3.25 | 1.80 |
| Quality of Community Contribution | “Quality of IP” scale (0–5) | 3.00 | 5.00 | 3.50 | 1.50 |
| Community Utility Index Test Winners | TradingView 5.00 | MetaTrader 5.00 | Trade Ideas 4.75 |
Unlike scripting-centric platforms, there’s less incentive for users to publish custom code, which naturally depresses “community utility” by your rubric. The platform’s value is model-generated insights and decision support, not crowdsourced IP.
FAQ
How does Tickeron AI work?
By leveraging machine learning and pattern recognition, Tickeron’s AI analyzes market trends and historical data to predict future stock performance. It then provides actionable investment suggestions based on its analysis.
Can Tickeron help me choose stocks?
Absolutely! Tickeron generates AI-powered predictions and personalized investment strategies to help you identify profitable stocks.
How accurate are Tickeron’s AI signals?
While no software guarantees 100% accuracy, Tickeron uses advanced AI and machine learning to generate predictions based on historical data and current market trends, and it assigns each recommendation a probability of success.
Does Tickeron AI Trading Software require any prior trading knowledge?
Yes, while Tickeron is designed for both beginners and experienced traders, a basic understanding of charts, patterns, and trading strategies will help you get the most out of the platform.
Does Tickeron offer a free trial?
Yes, Tickeron offers a free 14-day trial for new users to explore the features and capabilities of their AI trading platform.
Does Tickeron offer any discounts?
Yes, Tickeron discounts are nearly always available because it runs promotions and sales regularly. Visit the Tickeron Website to see the latest discounts.
HI James, is tickeron’s AI robot performing like they claim. Have you tried those?
Hi James, I think the AI services are innovative and transparent but agree their pricing model needs simplification.
thanks for the input.
Barry
I tried tickeron and DO NOT recommend. What a pain their subscription and customer service is. They need to get their act together with all the bugs and subscriptions.