Dividend growth stocks are an attractive investment option for long-term investors looking to build a stable and growing source of passive income. These stocks are typically found in mature, established companies with a track record of consistently increasing their dividends over time.
You need to screen for specific criteria to find the best dividend growth stocks.
Our research shows that stocks with a 10+ year history of growing dividends, a sustainable payout ratio, 5-year sales growth over 4%, and a margin of safety greater than 0 make great investments.
These companies typically have a competitive advantage in their industry and consistently generate profits year after year. Keep reading to learn how to find companies that are continually raising their dividends, providing a safe, stable source of income.

1. Choose a Dividend Stock Screener
Using Microsoft Excel to crunch company financials is a thing of the past; you will need a powerful yet straightforward Stock Screening platform that will enable you to implement first-class dividend growth investing strategies.
The Best Dividend Screener for USA & Canada
The best tool for the job is Stock Rover, the Winner of our Top 10 Best Stock Screeners Comparison. Also, Stock Rover won our Best Value Investing Stock Screener Comparison.
Sign Up For A Free 14-day Stock Rover Premium Plus (no card required). You need the Premium Plus service to access the remarkable 10-year dividend and financial history, fair value, and margin of safety criteria exclusive to Stock Rover.
Stock Rover 4.7/5⭐ : My Top Pick for Smart Investors
Investing In Stocks Can Be Complicated. Stock Rover Makes It Easy.
★
Growth Investing - with industry-leading
Research Reports ★
★ Value Investing - using Warren Buffett's Fair Value and Margin-of-Safety ★
★ Income Investing - rank by yield, growth, quality, and safety using 650 metrics ★

"I have been researching and investing in stocks for 20 years! I now manage all my long-term investments using Stock Rover." — Barry D. Moore, Founder: LiberatedStockTrader.com
The Best Screener for International Investors
If you plan to build a portfolio of dividend stocks outside of the USA & Canada, select TradingView or MetaStock.
MetaStock + Refinitiv Xenith provides a great package of fundamental screening through Refinitiv and real-time news. Compelling technical analysis and system backtesting is also part of the package. Try MetaStock 3 for 1
TradingView provides good value and dividend stock screening for nearly every stock on the planet. Easy to use yet powerful, TradingView is an excellent choice for international investors. Try TradingView Free
Alternatively, please read our Review of the Top 3 Best Value & Dividend Stock Screeners.
2. Implement the Dividend Growth Criteria
Our selected dividend growth strategy essentially invests in companies with a long history of continually paying and increasing dividends.
You will need a stock screener with a significantly sizeable historical database (at least ten years) of earnings and dividend payments, such as Stock Rover.
The criteria shown here is the calculation for 10 years.
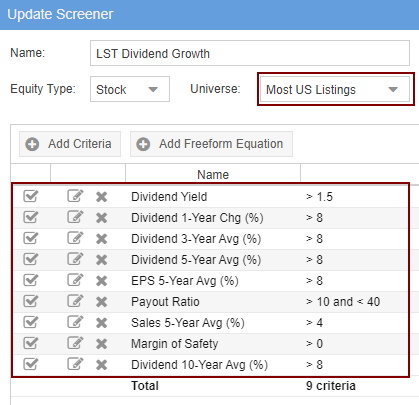
Dividend Growth Strategy Criteria:
Dividend Yield > 1.5%.
This is a simple filter designed to ensure only companies paying a dividend above 1.5% are listed—anything less than 1.5% will not even payout in line with inflation.
Dividend 1 Year Change > 8%.
This criteria helps you find companies with increased dividends of over 8% in the last fiscal year. Companies that have increased dividends in the past year usually continue to do so in the future.
Dividend 3-Year Change > 8%.
This criteria helps you find companies with increased dividends over the last three years over 8%.
Dividend 5-Year Change > 8%.
This criteria helps you find companies with increased dividends of over 8% in the last five years. Companies that have consistently increased their dividends for five straight years are usually strong, well-managed, and able to reward shareholders through increased dividend payments.
Dividend 10-Year Change > 8%.
Continuing the dividend change criteria to 10 years ensures consistent growth throughout the entire 10-year period. Of course, you can change these criteria to suit market conditions and broaden the stock selection.
Payout Ratio >10 < 40.
The payout ratio ensures the company makes enough profits to continue paying dividends and sustain the increases. You can reduce the “<10” to see more stocks in the scan. We do not want companies to pay more than 40% of their profits in dividends; they must retain cash flow for future growth and capital investments.
Sales 5-Year Average (%) > 4%.
We want to see that the company has consistently grown sales over the past 5 years. You can adjust the percentage to suit your own criteria, but we find that 4% is an acceptable growth rate for larger companies.
Earnings Per Share 5-Year Average (%) > 8%.
The 5-year average EPS should be at least 8% or more. This tells us that the company is generating sufficient profits to pay dividends, and earnings should grow, too. Again, you can adjust this percentage to suit your own criteria.
Margin of Safety > 0.*
This is a subjective measure, but it’s important to note that you should buy stocks at a margin of safety. A margin of safety means that the stock price is lower than its intrinsic value. This allows for some cushion in case the company has unexpected problems or if the market takes a turn for the worse. The higher the margin of safety, the better.
The most important criterion for me is the Margin of Safety, using Warren Buffett’s calculation, the forward discounted cash flow (see our article on Intrinsic Value). Essentially, the higher the margin of safety, the more of a discount you are buying a stock for.
Consecutive Dividend Growth Years > 10.*
This is a key metric to look at when evaluating dividend stocks. Ensuring that the company has been increasing dividends for at least 10 years is important, indicating a steady and strong cash flow. Additionally, it shows that the management team believes in its business model and is confident enough to reward investors with increased dividends year after year.
*(Exclusive to Stock Rover Premium Plus)
These criteria would typically return a list of only 2% of the NYSE or NASDAQ listed stocks.
3. Target Dividend Growth Stocks In Your Portfolio
Once you’ve identified potential dividend stocks using the criteria above, it’s important to investigate each stock further before investing. Do your own research to ensure a company has a competitive advantage or moat and solid fundamentals (profitability, debt levels, management team, etc.). Once you have identified suitable dividend growth stocks according to your own criteria, you can build a diversified portfolio of dividend stocks with numerous industry sectors.
This method of investing will provide investors with an income stream that may grow over time while still having the potential for capital appreciation when stock prices move higher. You’ll benefit from an increased income stream as dividends increase due to earnings growth and share buybacks. Diversifying across numerous dividend stocks can help reduce risk and provide a steady line of income for the long-term investor.
Of course, it’s important to remember that dividends are not guaranteed, and stock prices could decline, leading to losses if you sell shares at a lower price than your original purchase.
Dividend Growth Screening Example
The image below shows we have a choice of 39 stocks. Some well-known names, such as Accenture, Comcast & Prudential, meet these criteria today. Now, we must scan the potentials and short-list them for further research.
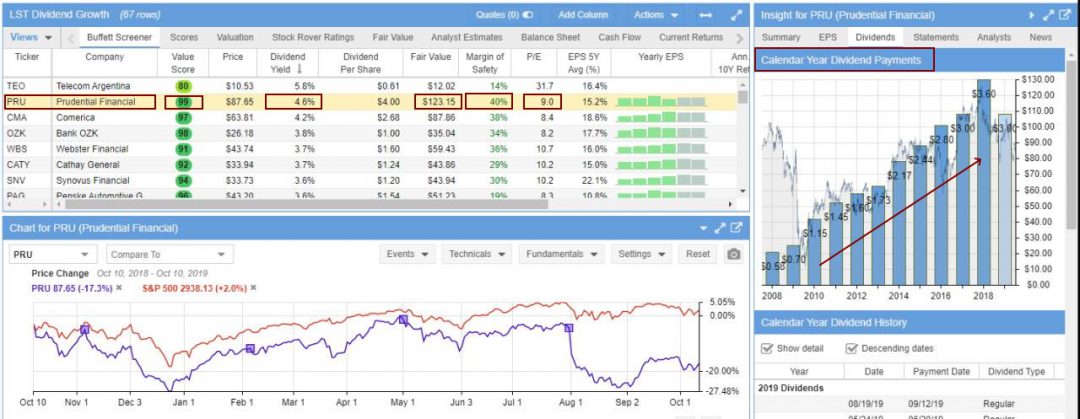
One that specifically caught my attention is Prudential (Ticker: PRU). The dividend yield is 4.6%, which is quite good. Based on the forward discounted cash flow, the “Fair Value” of the stock is $123, whereas the current stock price is $87. This means the market is undervaluing this stock, e.g., a Value Stock.
This means we have a margin of safety of 40%, which I think Warren Buffett would approve of. We can also see in the right-hand pane that dividends have increased solidly for the last ten years. This is a great candidate for our watchlist of potential investments.
Finally, the image above shows the proprietary Stock Rover Value Score of 99, which is very high. The Value Score looks at EV / EBITDA, P/E, EPS Predictability, Price / Tangible Book, and Price / Sales. The Price / Tangible Book and Price / Sales values are compared within a sector, whereas the other metrics are compared across all stocks with adequate data. The best companies score 100, and the worst score 0.
Now that we have selected a few stocks we like at first glance, we can deep-dive the financials.
Example Dividend Growth Stocks
Stock Rover has given us a great starting list. Now it’s time to dive into the financials and see if these companies are worth investing in. With Stock Rover’s powerful research platform, we can quickly examine each company’s financial statements, look at analyst ratings, read news stories about the company, view charts, and more. Finally, we can keep track of all our stocks on one page by creating portfolios.
| Summary | 2.60% | 24.00% | 17.80% | 20.20% | 29.50% | 8 | 24% | |
| Ticker | Company | Dividend Yield | Dividend 3-Year Avg (%) | Dividend 5-Year Avg (%) | EPS 5-Year Avg (%) | Payout Ratio | Consecutive Div. Growth Years | Margin of Safety |
| RHI | Robert Half | 2.60% | 12.20% | 11.40% | 12.90% | 35.90% | 10+ | 11% |
| TTC | Toro | 1.70% | 10.80% | 11.20% | 14.90% | 25.90% | 10+ | 7% |
| MCHP | Microchip Technology | 1.90% | 30.60% | 17.60% | 79.00% | 31.40% | 10+ | 13% |
| BC | Brunswick | 2.10% | 18.60% | 16.10% | 34.10% | 20.00% | 10+ | 23% |
| DOX | Amdocs | 2.00% | 9.90% | 11.70% | 10.10% | 35.20% | 10+ | 33% |
| NDAQ | Nasdaq | 1.70% | 10.40% | 8.40% | 8.20% | 36.60% | 10+ | 24% |
| NXST | Nexstar Media Gr | 4.00% | 34.10% | 29.20% | 9.00% | 24.20% | 9 | 65% |
| ALLE | Allegion | 1.70% | 12.00% | 16.50% | 14.40% | 29.40% | 8 | 10% |
| DKS | Dick’s Sporting Goods | 3.60% | 47.40% | 34.80% | 28.40% | 24.10% | 8 | 16% |
| MDC | MDC Holdings | 4.50% | 21.60% | 16.40% | 13.90% | 36.40% | 6 | 28% |
| SIRI | Sirius XM Holdings | 2.30% | 22.10% | 17.10% | 10.80% | 31.50% | 6 | 24% |
| SSNC | SS&C Techs Hldgs | 1.70% | 19.70% | 24.60% | 18.90% | 32.30% | 6 | 44% |
| VRTS | Virtus Inv | 3.80% | 35.00% | 29.70% | 17.20% | 34.60% | 5 | 20% |
| LZB | La-Z-Boy | 2.40% | 37.40% | 8.60% | 12.10% | 21.90% | 2 | 16% |
| OXM | Oxford Industries | 2.70% | 37.50% | 13.80% | 18.50% | 23.10% | 2 | 23% |
The table above shows the performance of different stocks over the last 10+ years. BC Brunswick has a dividend yield of 2.10%, with a 34.10% dividend change over the 10 years.
DKS Dick’s Sporting Goods had some impressive numbers overall with a 3.60% dividend yield and 47.4% change in dividend over 3 years – not to mention 28.4% over 5 years, well above average compared to other stocks on this list.
4. Perform Dividend Growth Stock Analysis
For a detailed analysis, investors must assess the individual stocks and make an informed decision. This could involve looking at the company’s financial statements, reading analyst reports and news articles, and tracking their dividend yield over time. It’s important to also consider that some companies may offer higher dividends than others but have more volatile stock prices.
Assess the Financial Highlights
Using Stock Rover, we can quickly and easily assess the company’s financials. Here, we can see that the Value Score has been stable over the last eight years (99), and the Growth Score is improving strongly (82).
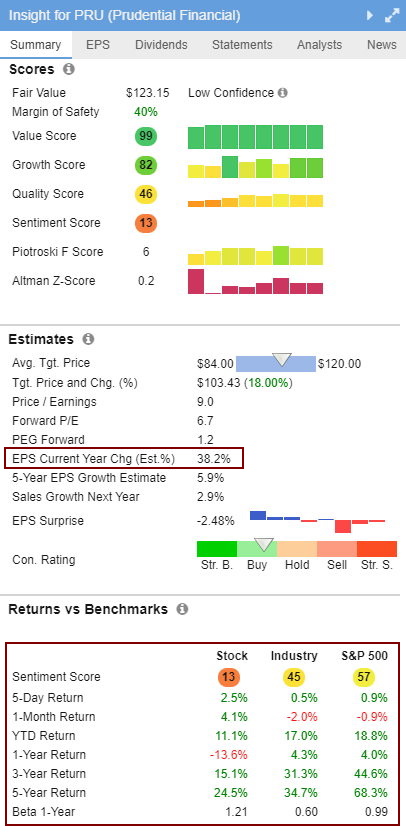
The Quality Score shows improvement to (46); it compares profitability and balance sheet metrics to find high-quality companies. This computation includes ROIC, Net Margin, Gross Margin, Interest Coverage, and Debt / Equity ratio values. The best companies score 100, and the worst score 0.
The sentiment score is low (13); this is good because finding stocks at undervalued prices means the market sentiment should be very low.
Next, the Earnings per Share EPS Current Year is expected to improve by 38.2%.
Finally, in the Returns vs. Benchmark, we can see that Prudential has historically lagged the S&P 500; however, at the current super-low valuation, I think it might be worth an investment based on the understanding that they can maintain the stable 10-year dividend growth rate.
In this situation, I would encourage you to read further on the company’s market and competitive outlook in the annual shareholder report and decide for yourself.
Finally, you can drill into the deep financials and perform industry-specific competition comparisons if this information is insufficient.
In the next example, we look at Microsoft, an excellent dividend stock.
Review the Financial Strength
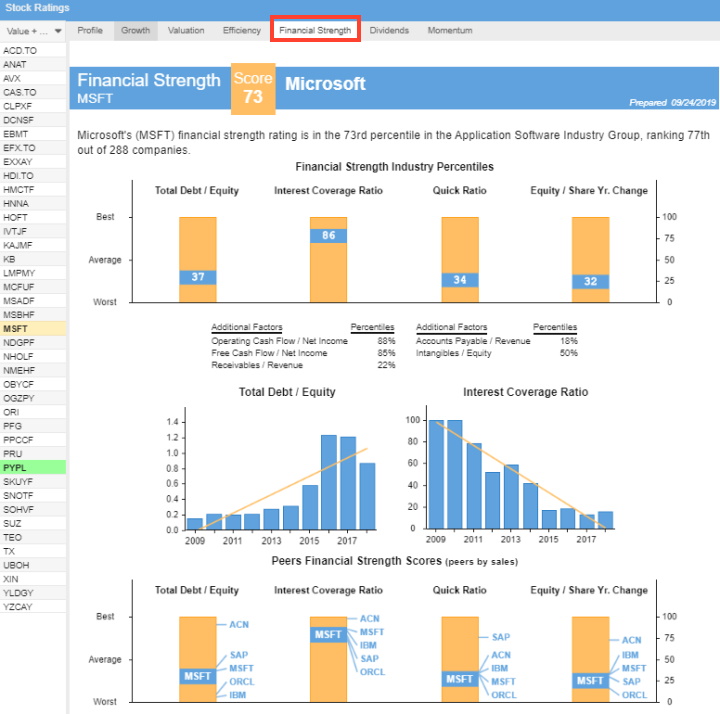
In Figure 4, I have selected the Financial Strength tab because I need to evaluate the company’s financial health.
- We can see that Stock Rover rates MSFT with a Financial Strength Score of 73 (out of 100)
- The first chart, Financial Strength Industry Percentiles, shows that MSFT is below the industry average regarding Debt to Equity but higher than average for the Interest Coverage Ratio.
- The following two charts show the 10-year trend for Total Debt to Equity and the Interest Coverage Ratio.
- In the chart below, see Peers Financial Strength Scores; you can see the excellent visualization of the financial strength of this company against its competition. This is extremely useful for uncovering potential new opportunities.
Assess the Dividend Analysis Report
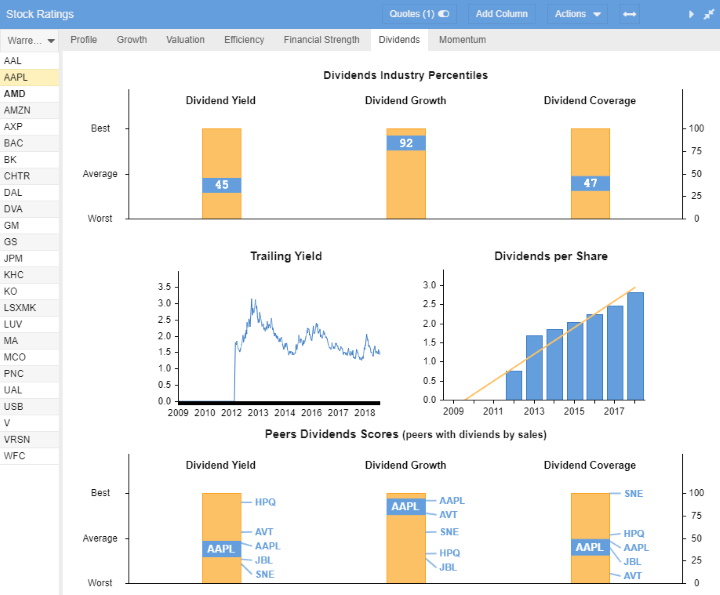
In the Dividends section of Stock Ratings, we see the following interesting comparisons for Apple Ticker: AAPL.
- The Dividend Industry Percentiles chart shows that AAPL has a slightly below-average dividend yield (45th percentile) compared to the industry. However, the dividend growth is amongst the best in the industry (92nd percentile), which could be very promising.
- The Trailing Yield shows us that APPL has historically kept its dividend yield between 1.5 and 2.5% of the stock price. Notably, the dividends were re-established in 2012, and the Dividend per Share has grown strongly.
- Finally, in the Peers Dividend Scores report, we see that Hewlett Packard Inc. (Ticker: HPQ) currently offers a vastly superior Dividend Yield, but Apple’s Dividend Growth is industry-leading.

In-depth Dividend Analysis & Peers Comparison With Stock Rover (Figure 5)
So now you have analyzed the companies you are interested in, it may be time to build your portfolio. If you need further food for thought on the topic of qualitatively analyzing a business and its industry, see this section in the article “How to Build a Buffett Value Screener,”
5. Build & Maintain Your Dividend Portfolio
If you do not already have a broker, or your broker is charging you more than $1 per trade, the next section will help.
1. Select a Commission Free Broker
I recommend using one of the popular online discount brokers, such as Firstrade, or E*TRADE. These options offer commission-free trading. If you do not already have a broker to enable the purchase of shares, I recommend Firstrade, which offers commission-free trading on stocks, options, and ETFs. Read our review of Firstrade.

2. Set Up Dividend Growth Portfolio Analytics
If you selected Stock Rover as your stock screener, you can connect it to your broker. Making this connection enables some excellent portfolio reporting through Stock Rover that is not usually available with most brokers.
You will still execute the trades with your selected broker, but Stock Rover will handle the portfolio performance and risk reporting.
You can connect Stock Rover to your broker or add the stocks you purchased manually or via a text file import. Either way, you will be presented with some excellent portfolio reporting.
Simply select Brokerage Connect from the left navigation menu and follow the instructions.
3. Use Portfolio Analytics
Stock Rover portfolio analytics can provide excellent insights into your dividend portfolio performance. You will be able to see how individual stocks perform relative to each other and overall risk and return metrics.
You can also chart dividend yields, compare portfolios, and drill down into individual stock positions for further analysis. Additionally, you can perform dividend forecasting and Monte Carlo stress testing to better understand what scenarios could play out in the future.
Overall, you can better understand how your dividend portfolio behaves and where the areas of opportunity may lie. Stock Rover is worth checking out if you’re looking for comprehensive dividend portfolio analytics.
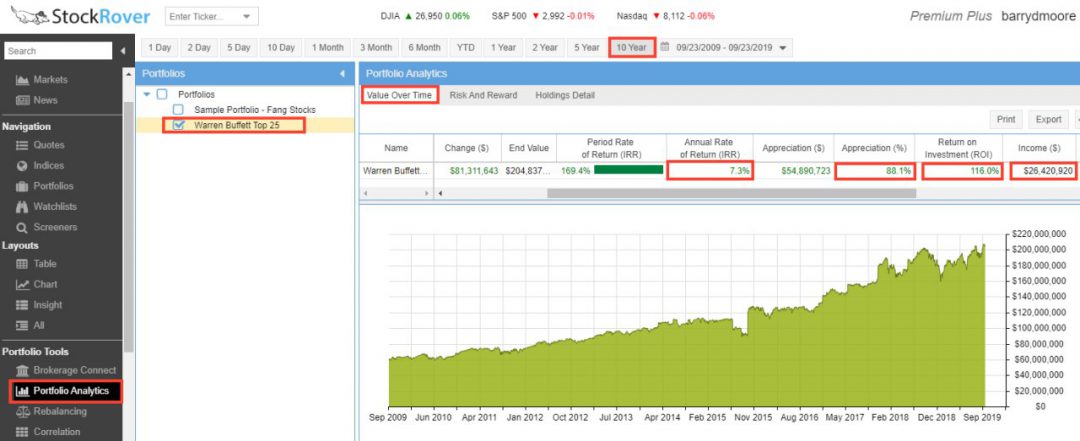
Portfolio Analysis Example
In the example below, I have selected the Warren Buffett Top 25 Holdings portfolio. This is pre-built and reflects the Top 25 companies that Warren Buffett owns.
Selecting the Value Over Time Tab, we can see the following metrics:
- This portfolio has made an annual rate of return of 7.3% over the last ten years.
- The selection of stocks has appreciated by 88.1%
- The total return on investment is 116%
- The total income generated through dividends is $26 M
Summary
The five easy steps to building a powerful dividend growth stock screener involve finding the right stock screening software and then deciding on your dividend growth stock investing strategy. You then build your screening criteria to form your list of great companies. Finally, you perform an in-depth analysis and decide which stocks will be the foundation of your future portfolio.
FAQ
What is the best software to find dividend growth stocks?
Stock Rover is the best software for finding dividend-growth stocks. It provides all the features every dividend investor needs, including in-depth analytics, portfolio tracking, and research capabilities to help you gain better insight into your investments.
What are dividend growth stocks?
Dividend growth stocks consistently increase their dividends over time. They typically belong to well-established, profitable companies with a history of returning earnings to shareholders.
Why should I consider investing in dividend growth stocks?
Investing in these stocks can provide a steady income stream that grows over time, potentially outpacing inflation. They also offer the potential for capital appreciation.
What are the key criteria to look for in a dividend growth stock?
Key criteria include 10+ years of steady dividend increases, a low payout ratio, strong financial health, stable earnings and sales growth, and a competitive industry position.
What is a payout ratio, and why is it important?
The payout ratio is the percentage of earnings paid out as dividends. A low payout ratio indicates a company's ability to sustain and grow its dividends.
How does dividend yield factor into choosing dividend growth stocks?
While a high yield may seem attractive, it could indicate financial trouble. Instead, focus on companies with moderate, sustainable yields under 8% and at least an 8-year history of dividend growth.
How do I research dividend growth stocks?
Research involves examining the company's financial statements, industry position, and management team. Online tools like Stock Rover or Portfolio 123 are extremely helpful in finding dividend stocks.
How do dividend growth stocks perform during market downturns?
Research suggests that dividend growth stocks often outperform the market during downturns because they're usually tied to stable, profitable companies.
Are all dividend-paying stocks considered dividend growth stocks?
No, only stocks that regularly increase their dividends for over 5 years qualify as dividend growth stocks.
How can I track the performance of my dividend growth stocks?
You can track performance using financial tools like Stock Rover. Key metrics to monitor are dividend yield, payout ratio, and dividend growth rate.
Can dividend growth stocks be part of a retirement portfolio?
Yes, they can provide a growing income stream, making them a good fit for retirement portfolios.
What are the risks associated with dividend growth stocks?
Risks include potential dividend cuts if the company's earnings decline, stock price volatility, and changes in the company's fundamentals. Dividend growth stocks should always be monitored for any potential warning signs. Additionally, dividend growth stocks may not provide as much capital appreciation as other investments.
What sectors are known for strong dividend growth stocks?
Sectors like utilities, consumer staples, and healthcare are often associated with strong dividend growth stocks.
Can international stocks be dividend growth stocks?
Yes, many international companies like Nestle and Novartis have strong track records of dividend growth. However, investing in international stocks requires additional research since the companies may operate under different legal systems and regulations. Investors should also be aware of potential currency fluctuations when investing in international stocks.
What impact can inflation have on my dividend income?
Inflation can erode the purchasing power of your dividends. However, dividend growth stocks can help offset this by increasing their payouts over time.
What is the Dividend Aristocrats Index?
The Dividend Aristocrats Index comprises S&P 500 companies that have increased their dividends for at least 25 consecutive years.
What is the difference between dividend yield and dividend growth?
Dividend yield is the annual dividend payment divided by the stock's price, while dividend growth refers to the rate at which a company's dividend increases over time.