A company’s cash flow statement gives you a real look at how money moves in and out of the business over a set period. If you’re an investor looking beyond reported profits, this statement is crucial.
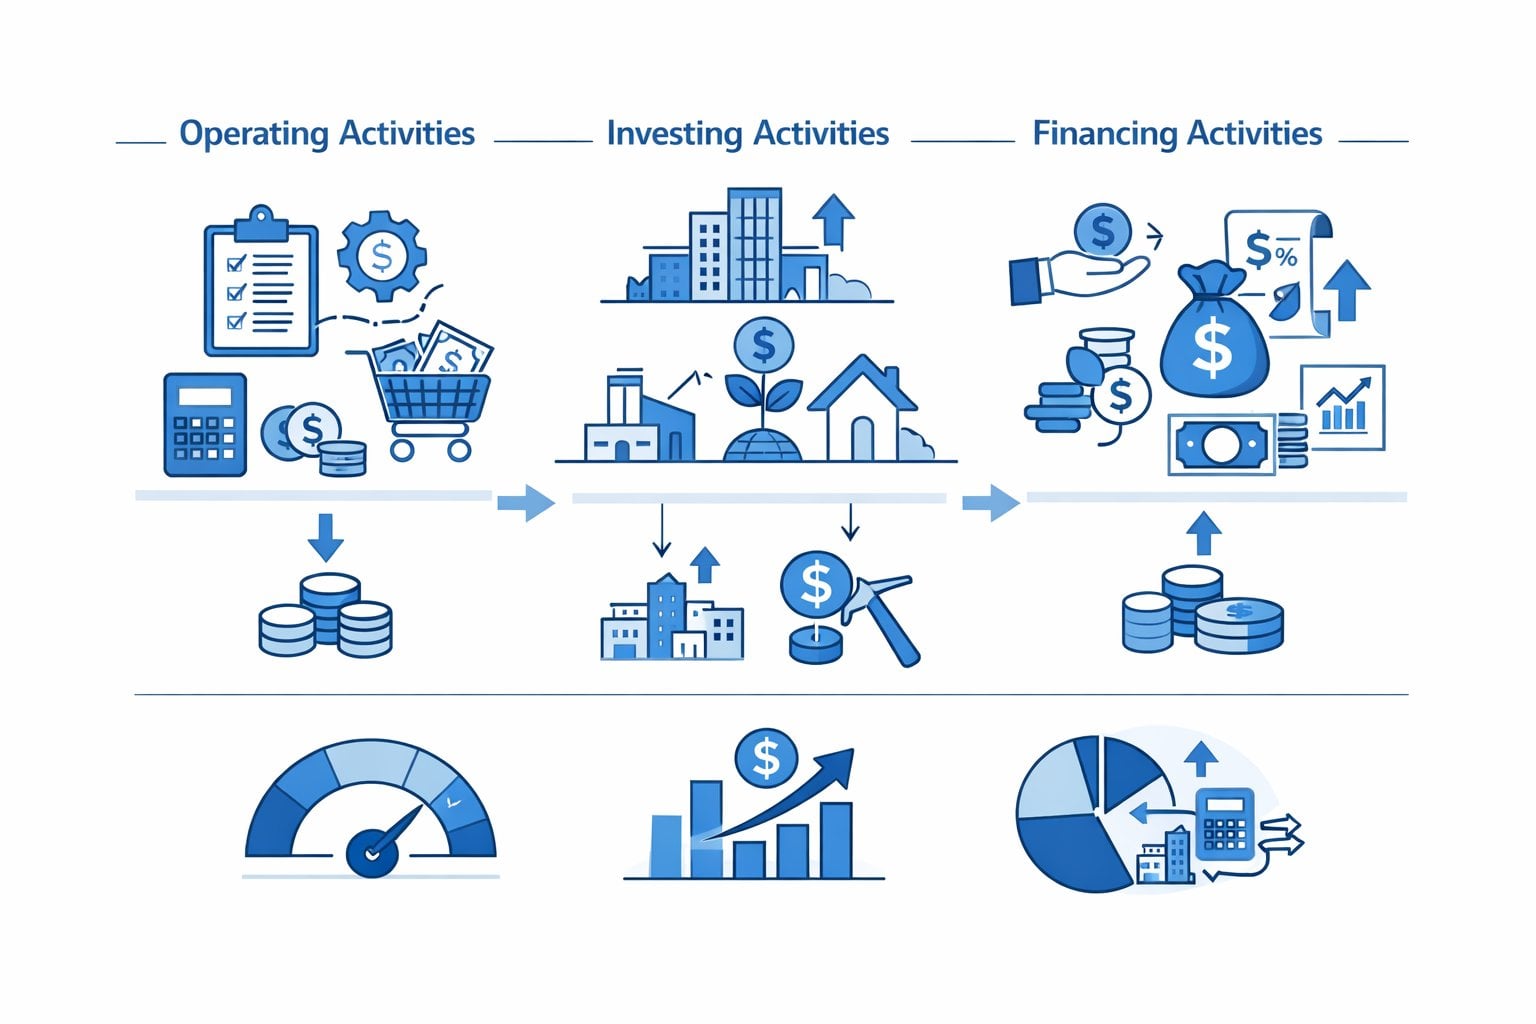
It tracks three main areas: operating activities (cash from the core business), investing activities (think capital expenditures and asset purchases), and financing activities (how the company raises and returns capital).
With tools like Stock Rover, you can compare these components across several companies, making it easier to spot strong performers or potential issues.
If you can read and interpret cash flow statements, you’re already ahead of those who just glance at earnings reports. Operating cash flow tells you if the business generates enough funds to keep the lights on and grow—without always needing to borrow or raise more money.
Investing and financing activities give you context about management’s decisions and priorities for capital. When you check trends over several periods and see how the line items interact, you get a clearer picture of financial health and spot red flags—like negative operating cash flow again and again.
Key Takeaways
- The cash flow statement tracks cash inflows and outflows from operating, investing, and financing activities, revealing a company’s actual financial position.
- Analyzing cash flow trends and comparing metrics against industry peers helps you spot strong businesses and warning signs.
- Ignoring non-cash items or missing long-term trends can lead to errors—dig deeper to make better decisions.
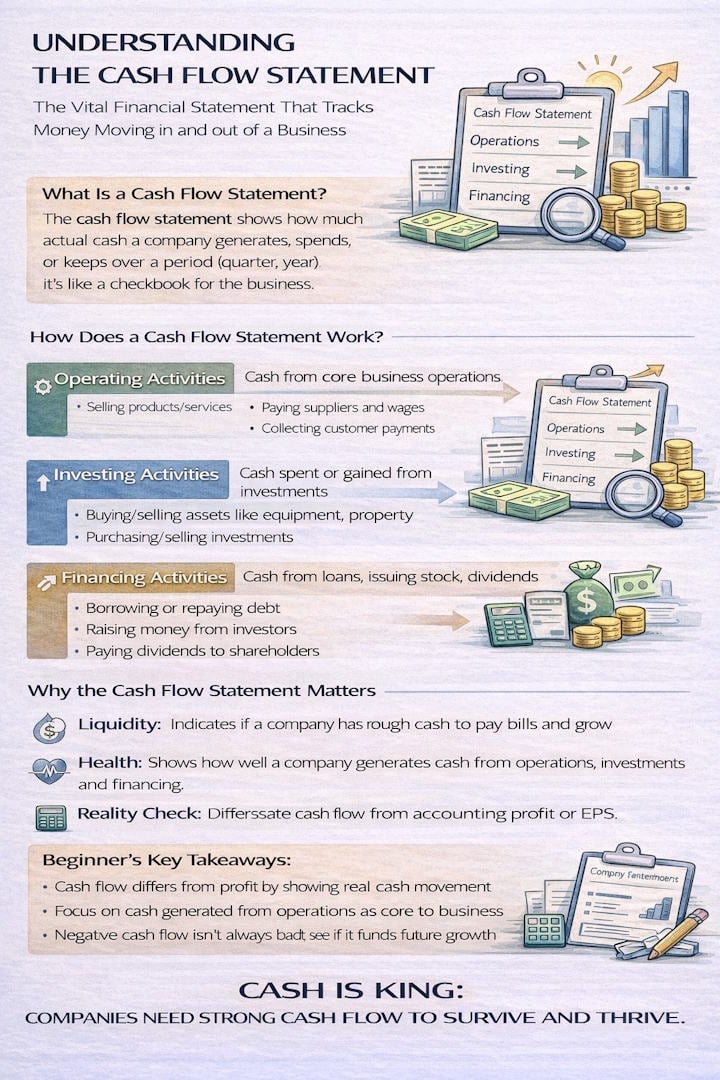
Cash Flow Statement Infographic
Cash flow statement definition
A cash flow statement tracks the actual money going in and out of a business during a specific accounting period. It covers cash-related activities like sales receipts, operating expenses, capital expenditures, and adjustments for non-cash items such as depreciation and amortization.
You’ll see cash movements organized into three buckets: operating, investing, and financing activities. This setup lets investors and analysts see how a company generates and uses cash—sometimes very differently from how profits appear on the income statement.
The cash flow statement connects directly to the balance sheet and income statement. Changes in accounts like receivables, inventory, and payables show up as adjustments in the operating section, making it clearer how accrual-based earnings become real cash.
You can dig into cash flow statements to gauge a company’s liquidity and financial stability. The statement shows if a business generates enough cash to fund operations, invest in growth, and pay off debts, without always turning to outside funding.
What is a Cash Flow Statement?
A cash flow statement is a financial document that tracks cash moving into and out of a business over a set period. Unlike the income statement, it focuses only on real cash transactions, not just accrued revenues or expenses.
You’ll find cash broken down into three main categories:
- Operating activities – cash from day-to-day business
- Investing activities – cash spent on or received from buying/selling assets
- Financing activities – cash flows linked to debt, equity, and dividends
The statement of cash flows ties the income statement and balance sheet together by showing how the company’s cash position changes. It helps you see if there’s enough cash to cover operating expenses and obligations.
The cash flow statement gives you real insight into liquidity, solvency, and overall financial health—key for judging stability and growth potential.
Video Explainer: Fundamental Analysis
The Three Parts of the Cash Flow Statement
You’ll see the cash flow statement split into three sections, each tracking a different type of cash movement. Cash flow from operating activities covers cash in and out from the main business, like sales revenue and payments for expenses.
This section really shows how well a company turns operating income into actual cash and cash equivalents.
Cash flows from investing activities deal with buying or selling long-term assets—think property or equipment. Here, you can tell if a company is investing in growth or selling off assets to raise cash.
Cash flows from financing activities track transactions involving debt, equity, and dividends. You’ll see things like borrowing, repaying loans, issuing stock, and paying dividends here.
Changes in working capital impact these sections too, since timing differences between income recognition and actual cash received can affect liquidity.
A Practical Example of Cash Flow Analysis
Let’s look at Company XYZ’s cash flow between 2022 and 2023. Net earnings doubled from $500,000 to $1,000,000—a clear sign of strong profitability growth.
Cash Flow Statement For Company XYZ
| (Figures USD) | 2022 | 2023 |
|---|---|---|
| Net Earnings | 500,000 | 1,000,000 |
| Additions to cash | ||
| Decrease in accounts receivable | 5,000 | 10,000 |
| Increase in accounts payable | 5,000 | 10,000 |
| Increase in taxes payable | 30,000 | 50,000 |
| Subtractions from cash | ||
| Increase in inventory | (50,000) | (60,000) |
| Net cash from operations | 490,000 | 1,010,000 |
| Cash flow from investing | ||
| Equipment | (100,000) | (400,000) |
| Cash Flow from financing | ||
| Notes Payable | 5,000 | 5,000 |
| Cash Flow | 395,000 | 615,000 |
The operating cash flow jumped from $490,000 to $1,010,000. That’s a sign that the core business really generates cash, not just accounting profits.
When you look at investing activities, equipment purchases shot up to $400,000 in 2023 from $100,000 the year before. That probably means expansion or upgrades.
Even though these investments lower cash reserves in the short term, they usually support future growth.
Financing activities barely changed—notes payable stayed at $5,000 both years. So, the company didn’t need extra debt or equity, which hints at confidence in its own cash generation.
Net cash flow climbed 56% from $395,000 to $615,000, even with bigger equipment investments. The positive trend across operating metrics shows solid cash management.
The company efficiently turns earnings into cash and funds growth without outside help. It’s smart to keep an eye on working capital changes, since they can quickly affect cash positions.
How to Read a Cash Flow Statement
Start by looking at the three main sections: operating, financing, and investing activities. The operating section shows net cash from operating activities—basically, the cash the business brings in from its core work, starting from net income or net earnings.
The statement moves from a beginning cash balance through these three sections to a net increase in cash. Add that to the starting balance, and you get the ending cash balance.
Net cash flow is just the difference between all cash inflows and outflows. When operating cash beats capital expenditures, you get free cash flow—money available for expansion or to return to shareholders.
Net cash from financing activities shows the capital raised or returned through debt, equity, and shareholder payouts.
Analysis Techniques for the Cash Flow Statement
If you want to evaluate a company’s cash position, you’ll need a few specific analysis techniques. These help you figure out if a business keeps positive cash flow or runs into negative periods that could spell trouble.
Free cash flow calculation is probably the go-to method. It tells you how much cash is left after covering operating expenses and capital expenditures.
If free cash flow is strong, the business can fund growth, pay dividends, or build reserves—without outside help.
Here are a few key financial ratios that add more detail:
- Operating Cash Flow Ratio: Can the company cover current liabilities with cash from operations?
- Cash Flow to Debt Ratio: How quickly could the company pay off its total debt?
- Free Cash Flow to Sales Ratio: What percentage of sales turns into available cash?
Tracking these ratios over time shows you stability trends. With Stock Rover, you can compare cash flow metrics across companies and dig into history.
This approach helps you spot businesses with consistent positive cash flow—and weed out those with weakening cash positions.
How to Easily Understand Company Accounts
To really understand company accounts, you’ll need to get comfortable with three core financial statements: the income statement, the balance sheet, and the cash flow statement. Each one reveals something different.
The income statement shows profits, the balance sheet tells you what the company owns and owes, and the cash flow statement tracks real cash movements.
The cash flow statement stands out because it’s all about liquidity, not just accounting profits. While income statements use accrual accounting, cash flow statements focus on real cash in and out.
You’ll see three sections: operating activities, investing activities, and financing activities.
Operating activities show cash from the core business. Investing activities cover cash used for or generated from asset investments. Financing activities track debt, equity, and dividends.
When you read these statements together, cash management becomes a lot clearer. Sometimes a company reports good profits but still struggles with cash—often due to receivables, inventory, or aggressive revenue recognition.
You can quickly compare companies, check industry benchmarks, and spot trends.
Key financial ratios help you size up company health:
| Ratio Type | What It Measures | Why It Matters |
|---|---|---|
| Liquidity Ratios | Ability to meet short-term obligations | Shows cash management effectiveness |
| Profitability Ratios | How efficiently a company generates profit | Reveals operational performance |
| Leverage Ratios | Debt levels relative to equity or assets | Indicates financial risk |
Modern analysis platforms flag big changes automatically. If debt spikes, equity drops, or cash flow patterns look weird, you’ll get notified.
This kind of automation helps you avoid missing something important and lets you act faster.
Always check for consistency across all three financial statements. If earnings look strong but cash generation doesn’t match, you should dig deeper.
Regularly watching key metrics helps you catch problems before they get serious.
Line Items on a Cash Flow Statement
The cash flow statement breaks down cash movements into three categories, each showing a different side of a company’s financial operations.
Every category lists specific line items that track exactly how cash enters and leaves during the reporting period.
Operating Activities
Operating activities show you how much cash your company’s core business actually brings in or uses up. You’ll start with net income and then adjust for non-cash items and shifts in working capital.
When you use the indirect method, you take net income and add back non-cash expenses like depreciation and amortization. You’ll also factor in changes in balance sheet accounts. If accounts receivable grow, cash drops—customers haven’t paid yet. But if accounts payable go up, you’re holding onto cash longer by delaying supplier payments.
With the direct method, you’ll list the actual cash receipts from customers and cash payments to suppliers and employees. You see only what actually moved in and out, not adjustments for non-cash items.
Changes in current assets, like inventory or prepaid expenses, can impact cash flow in different ways. If inventory climbs, you’ve spent cash to stock up. If inventory drops, you’re freeing up cash. Current liabilities such as notes payable do the opposite: increases give you a temporary cash bump, decreases drain it.
You’ll add back non-cash expenses like depreciation when using the indirect method, since they hit profits but don’t touch cash. Depending on accounting standards, you might see interest expense here or in financing activities.
Investing Activities
This section tracks cash you spend on or collect from long-term assets and investments. Capital expenditures usually make up the biggest outflows—think property, equipment, or tech investments to keep the business running or growing.
You’ll see capital expenditures (CapEx) as negative cash flow because you’re shelling out cash. Companies on a growth spree often show big CapEx numbers. These investments in long-term assets highlight where the company is putting its strategic focus.
If you buy another business, that’s a hefty cash outflow. Sell off assets or part of the company? That brings in cash. Long-term investments in stocks or other companies also show up here.
Selling equipment, buildings, or investments brings in positive cash flow. The net between what you buy and what you sell tells you if investing activities added or drained cash overall.
Financing Activities
Financing activities show how you’re raising money and giving value back to stakeholders. This covers deals with creditors and shareholders that change your capital structure.
When you issue stock (equity financing), you bring in cash. Issuing new shares means investors are handing you money. If you buy back your own shares (treasury stock), you’re spending cash.
Paying out dividends means cash goes to shareholders—so it’s a cash outflow. Choosing to pay dividends says a lot about profitability and what management values.
Paying back debt or loans eats up cash, since you’re reducing notes payable or long-term liabilities. Taking out new loans adds cash. The net change shows if you’re leaning more on debt or paying it down.
Examples of Cash Flow Items
Each section has specific transactions that either add to or subtract from your cash. Knowing these helps you get a clearer picture of a company’s finances and priorities.
Operating activities usually involve:
- Cash from customers
- Cash paid to suppliers and employees
- Tax payments
- Changes in accounts receivable and accounts payable
- Adjustments for depreciation and other non-cash transactions
Investing activities typically include:
- Capital expenditure on equipment and facilities
- Buying marketable securities
- Acquisitions of other businesses
- Selling property or investments
- Cash spent on long-term investments
Financing activities generally cover:
- Money from issuing stock
- Dividend payments to shareholders
- Borrowing via loans or bonds
- Paying back the debt principal
- Treasury stock purchases
Operating Activities
In this section, you’ll convert accrual accounting numbers to actual cash numbers. That means carefully adjusting for non-cash items and changes in working capital.
When inventory rises, you’re tying up cash in goods you haven’t sold yet. If it drops, you’re freeing up cash. Prepaid expenses work much the same—paying for insurance or rent ahead of time cuts into current cash.
If accounts receivable grow, you’ve made sales but haven’t collected the cash, so cash flow lags behind net income. When customers pay up, receivables drop, and cash increases.
When current liabilities like accounts payable go up, you’re holding onto cash by delaying payments. Paying off these obligations brings both the liability and cash down.
Financing Activities
This section shows how you fund operations and reward investors. The balance between raising money and returning it shapes your financial structure.
When you issue new debt, you get more cash but also take on future repayment. Paying off loans reduces both cash and liabilities. The timing and size of these moves affect your liquidity and flexibility.
Paying dividends cuts into both retained earnings and cash. Share buybacks also shrink cash, but they can boost earnings per share for those who keep holding.
If you take out notes payable or other short-term borrowing for financing, you’ll see it here. Issuing or retiring long-term debt also lands in this category.
Top 10 Tips for Analyzing Cash Flow Statements
- Know the three main sections on any cash flow statement: operating, investing, and financing activities. Each one tells you something different about where the company’s money comes from and goes.
- Work out free cash flow by subtracting operating expenses and taxes from revenues. This shows how much cash is left for expansion, paying off debt, or returning to shareholders.
- Check out key ratios like the current ratio, quick ratio, and debt-to-equity ratio. These numbers give you a snapshot of liquidity and overall financial strength.
- Track long-term trends—don’t just look at one quarter. Watching cash flows and ratios over several quarters or years helps you spot real patterns and red flags.
- Focus on operating activities—that’s the heart of the business. Strong cash from operations usually means the business model is solid.
- Dig into investment activities to see if the company is making smart capital investments. Large spending on long-term assets can mean they’re betting on future growth.
- Watch financing activities to see how management handles debt, new shares, and dividends. This tells you a lot about their capital strategy and flexibility.
- Look for steady positive cash flow from operations. Companies that consistently bring in cash from their core business are usually on solid ground.
- Compare with industry peers to get some context. Stock Rover lets you do detailed peer comparisons and screen companies by cash flow metrics.
- Don’t ignore seasonal swings. Some businesses have cash flow cycles tied to their industry or sales seasons.
3 Cash Flow Ratios for Investors to Watch
Current ratio
The current ratio checks if a company can pay its short-term bills using its current assets. You’ll use this to see if a business has enough liquidity to cover what’s due soon.
The formula for calculating the current ratio is:
Current Ratio = Total Current Assets / Total Current Liabilities
You’re dividing all assets that can turn into cash within a year by debts due in the same period. Current assets cover cash, accounts receivable, inventory, and marketable securities. Current liabilities include accounts payable, short-term debt, and anything else due within twelve months.
What’s a good current ratio? If it’s over 1.0, the company has more current assets than liabilities. Most analysts say 1.5 to 3.0 is healthy, but the “right” range depends on the industry.
A ratio under 1.0 could mean liquidity trouble—they might not be able to pay bills on time. But if it’s much higher than 3.0, maybe they aren’t using assets efficiently or have too much inventory.
Quick ratio
The quick ratio (or acid test) gives you a tougher look at liquidity than the current ratio. Here, you’ll exclude inventory and less liquid assets, focusing on what’s easiest to turn into cash.
The formula for calculating the quick ratio is:
Quick Ratio = (Cash + Cash Equivalents + Marketable Securities) / Current Liabilities
Inventory gets left out because selling it fast often means discounts. The quick ratio asks: can the company cover immediate debts using only its most liquid assets, without counting on selling inventory?
If the quick ratio is over 1.0, that’s a good sign—they can handle sudden expenses or revenue drops. Ratios between 1.0 and 2.0 usually mean healthy liquidity.
What’s a good quick ratio? Below 1.0 might mean cash flow risks, but some industries run leaner by nature. Companies with a way below 1.0 could struggle if the economy turns or customers delay payments.
Debt-to-equity ratio
The debt-to-equity ratio shows how a company funds growth—does it lean more on debt or on investors’ money? This ratio helps you gauge financial risk and capital strategy.
The formula for calculating the debt-to-equity ratio is:
Debt-to-equity ratio = Total Liabilities / Total Shareholders' Equity
Total liabilities include all short- and long-term debts. Shareholders’ equity is what’s left after subtracting liabilities from assets.
What’s a good debt-to-equity ratio? Lower is usually safer, since it means less reliance on debt. Ratios under 1.0 mean equity outweighs debt—a plus for conservative investors.
If the ratio is over 2.0, the company is using a lot of debt financing, which can boost returns but also risk. Some sectors with steady cash flows (like utilities) can handle higher ratios. Growth companies may show higher debt-to-equity ratios as they borrow to expand.
What should beginner investors look for in the cash flow statement?
If you’re new to this, focus on operating cash flow (OCF). This figure tells you if the company’s core business brings in enough cash to pay its bills. Steady positive OCF usually means the business model holds up without constant outside funding.
Keep an eye on capital expenditure (CAPEX), too. This shows how much is going into equipment and property. High CAPEX isn’t always bad—it often means growth—but check if it fits with the company’s long-term strategy.
Free cash flow (FCF) is probably the most useful number for beginners. It’s what’s left after capital expenditures, and it’s the money available for dividends, debt paydown, or reinvestment. Positive FCF means flexibility and sustainability.
You’ll want to look at cash flow from financing activities to see how the company manages debt and equity. Negative numbers here can be good—they might mean the company is paying down debt or giving money back to shareholders.
Checking these metrics over several quarters helps you forecast and spot trends.
Big quarter-over-quarter changes deserve a closer look. Sharp drops in operating cash flow or sudden spikes in capital spending could mean trouble or a big shift in strategy. Look for steady, sustainable patterns instead of chasing one-off results.
Analysis of the Cash Flow Statement for Advanced Investors
If you’re digging deeper, you’ll want to break down the three main sections of the cash flow statement. Operating activities show how much cash the core business brings in. Consistently positive numbers here point to a sustainable business model that can keep running without outside money.
Investment activities reveal where capital is going. Large capital expenditures might mean growth moves, while asset sales could hint at restructuring or liquidity needs.
Financing activities tell you how the company raises and returns capital. Regular dividends and buybacks often signal financial strength, but if you see lots of new debt, it’s worth asking why.
The net change in cash and cash equivalents gives you a quick sense of liquidity trends. If cash drops even when earnings look good, there might be working capital headaches or aggressive expansion.
Comparing cash flow patterns with industry peers is crucial. Every sector has its own cash flow quirks—tech companies look very different from utilities or manufacturers.
You should always check trends over several periods, not just one quarter. That’s how you find out if changes are real or just blips.
How to Read the Income Statement Like a Pro Investor)
5 Pitfalls to Avoid When Analyzing Cash Flow Statements
When you dig into cash flow statements, you’ve got to watch for a few traps that can throw off your analysis.
- Take non-cash items like depreciation and amortization. You’ll see them on financial statements, but they don’t reflect real money moving in or out. These entries lower reported earnings without touching the actual cash pile, so you need to factor that in.
- Comparing cash flow statements between companies? Be careful. Different accounting approaches can skew the numbers, even if the businesses perform similarly underneath.
- Don’t overlook cash equivalents—short-term investments and marketable securities. Since you can turn these into cash quickly, they’re part of the true liquidity picture.
- Check out the financing activities section to see where the company gets its capital. Debt, equity, dividends—it all points to the company’s financial strategy and whether it’s sustainable for the long haul.
- If you only look at quarter-to-quarter swings, you’ll miss the real story. The bigger picture comes from watching trends over several reporting periods, not just one.
Final Thoughts
Cash flow statements give you insights you just can’t get from balance sheets or income statements alone. They show if a company actually brings in enough cash to keep the lights on, invest, and pay what it owes.
When you break down the three sections—operating, investing, and financing—you get a complete view of financial performance.
Keep an eye on these:
- Operating cash flow: cash from core business activities
- Investing cash flow: money spent or earned buying and selling assets
- Financing cash flow: how the company raises money and pays shareholders
Usually, companies with strong operating cash flow have sturdier fundamentals than those leaning on financing to keep afloat. You can also spot warning signs—like shrinking cash reserves or too much debt—right here.
Stock Rover has robust cash flow analysis tools. You can screen companies by cash flow, compare them across industries, and dig into historical data using over 650 financial metrics.
If you review cash flow statements regularly, you’ll make smarter portfolio allocation decisions. Companies that keep generating positive cash flow from operations tend to be more stable and show growth potential. This becomes even more useful when you combine it with other financial statements and market research.
FAQ
What is the best software for analyzing cash flow statements?
The best software for analyzing company financials, including cash flow statements, is Stock Rover. It provides comprehensive, real-time research reports that analyze balance sheets, income statements, and cash flow. It also offers portfolio tracking, watchlists, and automated alerts.
What does a healthy cash flow statement look like?
A healthy cash flow statement will show an increase in cash from operations and profits generated from investments and acquisitions. Additionally, a consistent stream of positive cash flows should help the company keep its obligations current. It’s also a good sign if the company can use its available funds efficiently and effectively for growth.
Does a positive cash flow always indicate success for companies?
No, positive cash flow isn’t always a sign of success since it varies among businesses and can change due to seasonal industry changes. Further analysis is needed to understand the reasons behind changes in cash flow between reporting periods.
You want to be a successful stock investor but don't know where to start.
Learning stock market investing on your own can be overwhelming. There's so much information out there, and it's hard to know what's true and what's not.

Liberated Stock Trader Pro Investing Course
Our pro investing classes are the perfect way to learn stock investing. You will learn everything you need to know about financial analysis, charts, stock screening, and portfolio building so you can start building wealth today.
★ 16 Hours of Video Lessons + eBook ★
★ Complete Financial Analysis Lessons ★
★ 6 Proven Investing Strategies ★
★ Professional Grade Stock Chart Analysis Classes ★
Class Questions & Answers
What is a cash flow statement, in plain English?
A cash flow statement shows how much real cash a company generated and where that cash went during a period. It tracks cash moving in and out of the business, which helps investors see whether the company is actually producing cash—not just reporting accounting profit.
What are the three sections of a cash flow statement?
The three sections are: (1) Operating activities (cash from the core business), (2) Investing activities (cash spent on or received from assets and investments), and (3) Financing activities (cash from debt, issuing shares, buybacks, and dividends).
Why can a company show a profit but still have weak cash flow?
Because profit includes non-cash accounting items and timing effects, for example, sales can be recorded before cash is collected (receivables), and expenses like depreciation reduce profit without using cash in that period.
What is one quick “health check” investors can do using cash flow?
Check whether operating cash flow is consistently positive over time. If a company can’t reliably generate cash from its core operations, it may depend on borrowing or issuing shares to survive.
Is negative cash flow always bad? When could it be acceptable?
Not always. Negative cash flow can be acceptable if it comes from investing in future growth (like building factories or expanding capacity). The key is whether the company has enough liquidity and whether those investments are likely to generate future returns.