Moving average indicators are used to plot a moving trendline on a chart automatically, enabling the analysis of stock trends and direction. Moving averages are a simple and popular stock chart indicator.
While experienced traders might opt for more complex indicators, the moving average, when used correctly, is extremely powerful and reliable.

This lesson is now located here.
Moving Averages
What is a moving average? How do you calculate it? And why should you care? In this article, we will answer all of these questions and more. We will start by discussing a moving average and how it is calculated. Then, we will explore the different types of moving averages and discuss why you might want to use them in your trading strategy. Finally, we will look at examples of how to use moving averages to forecast future prices.
What is a moving average?
So, what is a moving average? A moving average is simply a way of smoothing out data. It does this by taking the average of a certain number of data points and then plotting that average as a line on a chart. The Simple Moving Average (SMA) and the Exponential Moving Average (EMA) are the most commonly used moving averages. We will discuss how to calculate each of these below.
How to calculate a moving average
When calculating a moving average, you must decide which data points you want to include. This is typically done by choosing a period, such as 20 days, 50 days, or 200 days. Once you have chosen your period, add the closing prices for that number of days and divide by the number of days. This will give you the average price for that period.
For example, let’s say we wanted to calculate the 50-day moving average for a stock. We would start by adding the closing prices for the past 50 days and dividing by 50. This would give us the average price for the past 50 days. We could then plot this as a line on a chart showing how the stock has traded over that period.
Now that we know how to calculate a moving average, let’s consider why they are useful.
Why moving averages are useful
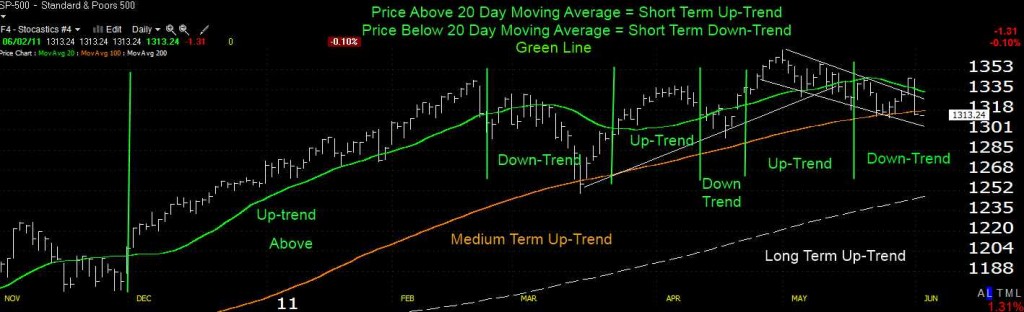
Moving averages can be used in several ways, but one of the most common is to help identify trends. When prices are trending up, the moving average will also increase. Likewise, the moving average will usually be lower when prices trend down.
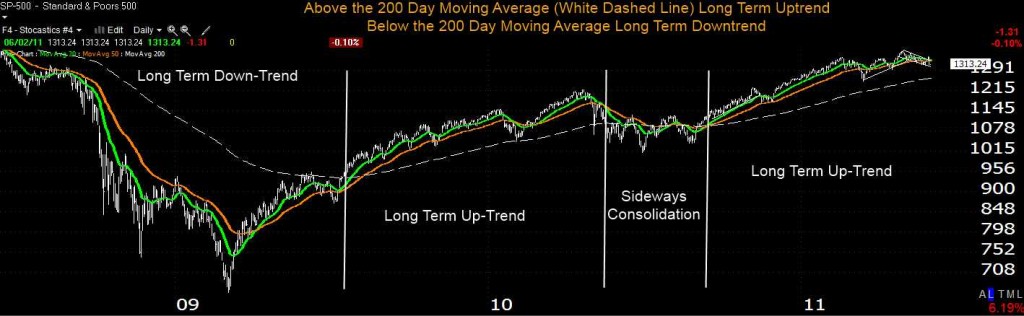
Moving averages can also be used to help confirm breakouts. For example, prices trading above a 200-day moving average may indicate a long-term uptrend. Conversely, if prices are trading below a 200-day moving average, that could be a sign that a downtrend is underway.
There are many other ways to use moving averages, but these are just a few of the most common. Now, let’s take a look at how to calculate them.
3 Types of Moving Average
As we mentioned, there are three main moving averages: the Simple Moving Average (SMA), the Exponential Moving Average (EMA), and the Weighted Moving Average. Let’s start with the SMA.
Simple Moving Average
The Simple Moving Average is just as it sounds – the average of a certain number of data points. To calculate it, you add the prices for a certain period and then divide by the number of days. For example, if you wanted to calculate the 20-day SMA, you would add up the closing prices for the past 20 days and divide by 20.
Exponential Moving Average
The Exponential Moving Average is similar to the Simple Moving Average but gives more weight to recent data points. This makes it more responsive to changes in price direction. To calculate it, you use a slightly different formula.
A higher weight is placed on the most recent data, so the moving average line responds quickly to the latest price moves. This attempts to reduce one of the moving averages’ weaknesses. This weakness is that the moving average is a lagging indicator, and depending on the length of the moving average, it can take time for the MA to start moving in the direction of the stock price.
Weighted moving average
The weighted moving average is similar to the exponential moving average but gives more weight to recent data points. This makes it even more responsive to changes in price direction. To calculate it, you use a different formula again.
Finally, consider two of the most common moving averages: the 50-day moving average and the 200-day moving average.
50-day moving average
The 50-day moving average is the average of the past 50 days’ closing prices. Many traders use it to help identify short-term trends. If prices are above the 50-day MA, that is typically seen as an indication that an uptrend is in place. Conversely, if prices are below the 50-day MA, that is often seen as a sign that a downtrend may be underway.
200-day moving average
The 200-day moving average is similar to the 50-day MA but uses a longer period. As such, investors often use it to help identify long-term trends. If prices are above the 200-day MA, that is generally considered an indication that a long-term uptrend is in place. On the other hand, if prices are below the 200-day MA, that may be seen as a sign that a long-term downtrend could be underway.
One final point to remember is that moving averages are lagging indicators. This means that they will tend to lag behind the actual price action. As such, they should not be used as a sole source of information when making trading decisions. Rather, they should be used with other technical indicators to give you a more complete picture of what is going on in the market.
How to use moving averages for forecasting
MAs can be used for forecasting future prices. The most common way to do this is to use a weighted MA. A weighted MA assigns different weights (or importance) to each data point in calculating the mean. This gives more weight to recent data points and less to older ones.
This makes the weighted MA more responsive to recent price changes and more useful for forecasting.
To calculate a weighted MA, multiply each data point by a weighting factor and then take the mean.
Different ways are used to weigh the data points, but the most common method is to use an exponential moving average (EMA).
Ever Dreamed of Beating the Stock Market
Most people think that they can't beat the market, and stock picking is a game only Wall Street insiders can win. This simply isn't true. With the right strategy, anyone can beat the market.

The LST Beat the Market Growth Stock Strategy is a proven system that has outperformed the S&P500 in 8 of the last 9 years. We provide all of the research and data needed to make informed decisions, so you no longer have to spend hours trying to find good stocks yourself.
The LST Beat the Market System Selects 35 Growth Stocks and Averages a 25.6% Annual Return
★ 35 Stocks That Already Beat The Market ★
★ Buy The Stocks & Hold For 12 Months - Then Rotate ★
★ Fully Documented Performance Track Record ★
★ Full Strategy Videos & eBook ★
Take The Pain Out Of Stock Selection With a Proven Strategy
Moving Averages Summary
Moving averages can be used in many ways, but these are just a few common uses. As you can see, they can be a helpful tool for identifying trends and confirming breakouts.
That’s all for now. Thanks for reading! We hope this article has helped demystify moving averages and shown you how to use them in trading or investing activities. Moving averages are just one tool in the trader’s toolbox.