Creating a high-alpha portfolio is the ultimate dream for hedge fund managers, and if you’re investing in growth stocks, it should be your goal, too!
Alpha is a key measure that reveals how a stock, fund, or asset performs against its benchmark index. Imagine your stock portfolio earning an impressive 10% over the year while the benchmark only managed a 6% gain—that’s an alpha of 4%!
A positive alpha indicates that the fund has outshined its benchmark, while a negative alpha signals it fell short.
This article reveals the secrets to discovering high-alpha stocks and guides you on how to implement your very own alpha calculator in Excel!

What is Alpha?
Alpha measures a stock, fund, or asset’s performance relative to its benchmark. It is often expressed as a percentage. For example, if an investment increases in value by 10 percent but the market benchmark increases by 5 percent, then the alpha would be +5%.
Alpha measures how much an investor’s portfolio outperforms or underperforms the market. Alpha is a useful metric for understanding the return that an investor earns beyond what would be expected by taking on additional risk.
What is alpha in stocks?
Alpha measures the return that an investor earns beyond what would be expected by taking on additional risk. By understanding how alpha works, investors can identify and invest in stocks with higher-than-average returns while minimizing risk exposure.
Alpha is an important concept in stock investing. It measures how much a particular stock or mutual fund outperforms or underperforms the market while considering risk and volatility.
Key Takeaways
- Alpha measures how much an asset has outperformed a benchmark.
- Alpha can be a simple calculation or can factor in risk-adjusted returns.
- Alpha considers risk and beta (volatility).
- Alpha can be used to measure the performance of entire portfolios.
How to Use Alpha in Stocks
Using alpha can be a great way to increase returns while reducing risk. By analyzing and ranking stocks based on their alpha performance, investors can make more informed decisions about which stocks to invest in. This data can also be used to evaluate the performance of a portfolio or fund manager, as higher alpha indicates that the manager is beating the market on a risk-adjusted basis.
It’s important to note that alpha can effectively identify suitable investments but does not always indicate future stock performance.
What does alpha mean in stocks?
Alpha measures the risk-adjusted performance of a particular stock or mutual fund. In other words, it considers the volatility of a security’s returns relative to the market. This makes alpha a more accurate measure of investment performance than simple returns alone.
There are several ways to calculate Alpha: one is to use historical data to track how a stock or mutual fund has performed relative to the market over time. Another is to use beta, which measures a security’s volatility relative to the market. Finally, you can also calculate alpha using regression analysis.
How to use alpha for stock picking
Alpha can be used in two ways: to help investors choose stocks or mutual funds that have the potential to outperform the market and to help investors assess the performance of their current investments.
Generally, stocks or mutual funds with high alpha are considered riskier but also have the potential for higher returns. Investors should exercise caution when investing in securities with high alphas, as they can be more volatile than the market as a whole.
How to find high Alpha stocks
To find high Alpha stocks, use a stock screener to filter for stocks that have outperformed the S&P 500 index over the past 12 months.
Alpha measures asset price performance vs. the underlying index, so finding these stocks is easy using Stock Rover.
5 Steps to Quickly Find High Alpha Stocks
- Register for a Free Stock Rover Trial
- Select Screeners -> Create New Screener -> Add Criteria
- Type “1-Year Return vs. S&P 500”> 5% (5% represents the additional risk-free rate of return)
- Click “OK.”
- You will now have a list of approximately 800 stocks with a high 12-month Alpha.
Investing In Stocks Can Be Complicated, Stock Rover Makes It Easy.
Stock Rover is our #1 rated stock investing tool for:
★ Growth Investing - With industry Leading Research Reports ★
★ Value Investing - Find Value Stocks Using Warren Buffett's Strategies ★
★ Income Investing - Harvest Safe Regular Dividends from Stocks ★

"I have been researching and investing in stocks for 20 years! I now manage all my stock investments using Stock Rover." Barry D. Moore - Founder: LiberatedStockTrader.com
List of 35 High Alpha Stocks for 2023/2024
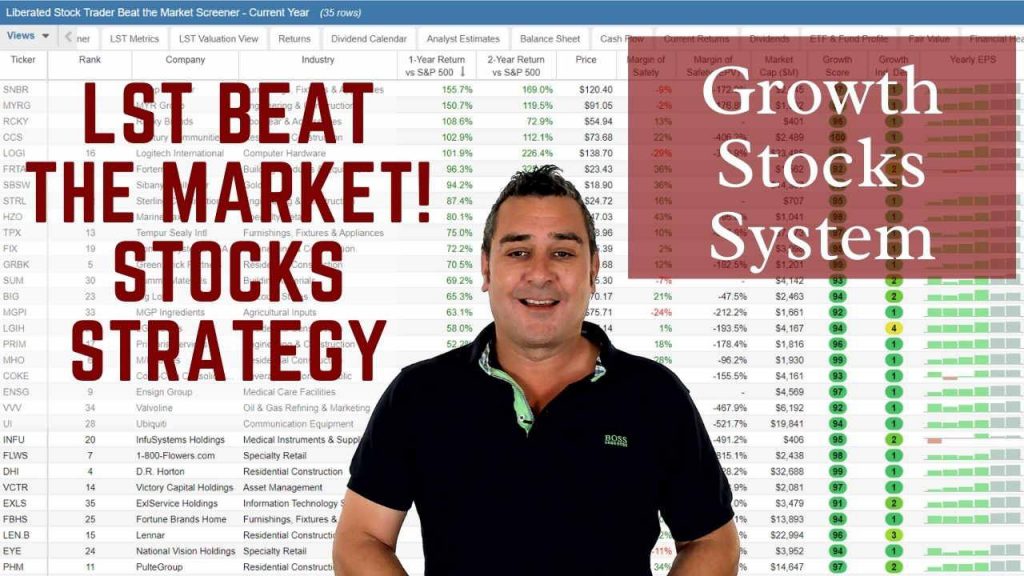
Here is a list of the 35 best high alpha stocks selected by the Liberated Stock Trader Beat the Market System.
The Liberated Stock Trader Beat the Market (LSTBTM©) strategy excels at identifying the top 35 growth stocks with a high probability of outperforming S&P500 returns. This meticulously engineered system evaluates the growth in free cash flow and explosive EPS growth. Combining these factors with Joel Greenblatt’s celebrated ROC and Earnings Yield formulas, also known as “the Magic Formula,” we present a carefully curated selection of stocks consistently outperforming the market in 8 out of the past nine years.
| Ticker | Company | Alpha |
| SMCI | Super Micro Computer | 318.30% |
| STRL | Sterling Infrastructure | 200.70% |
| VIST | Vista Energy | 178.00% |
| ACLS | Axcelis Technologies | 150.60% |
| ELF | e.l.f. Beauty | 150.10% |
| MHO | M/I Homes | 115.50% |
| NOA | North American | 106.50% |
| PR | Permian Resources | 79.30% |
| USLM | United States Lime | 68.40% |
| OMAB | Central North Airport Gr | 63.00% |
| NVEC | NVE | 61.70% |
| AVGO | Broadcom | 61.40% |
| BKNG | Booking Holdings | 61.20% |
| IPAR | Inter Parfums | 58.30% |
| FN | Fabrinet | 49.10% |
| TGLS | Tecnoglass | 46.30% |
| URI | United Rentals | 43.50% |
| DECK | Deckers Outdoor | 41.90% |
| VSEC | VSE | 41.70% |
| IBP | Installed Building Prods | 41.10% |
| RYAAY | Ryanair Hldgs | 39.00% |
| AIT | Applied Industrial Techs | 36.80% |
| BLD | TopBuild | 36.60% |
| TDG | TransDigm Gr | 36.00% |
| EXP | Eagle Materials | 34.00% |
| MELI | MercadoLibre | 33.50% |
| PERI | Perion Network | 28.40% |
| ALGM | Allegro Microsystems | 28.40% |
| IR | Ingersoll Rand | 27.40% |
| NOW | ServiceNow | 26.40% |
| WEX | WEX | 26.10% |
| CCEP | Coca-Cola Europacific | 25.40% |
| CDNS | Cadence Design Sys | 25.30% |
| LECO | Lincoln Electric Holdings | 21.60% |
| GWW | W.W. Grainger | 19.90% |
| Summary | 68.00% |
*Alpha = 1-Year Return vs. S&P 500
Of course, this selection of stocks, like any strategy, does not guarantee market outperformance, but it does improve the chances of high performance in the future.
Try the LST Beat the Market Strategy
Ever Dreamed of Beating the Stock Market
Most people think that they can't beat the market, and stock picking is a game only Wall Street insiders can win. This simply isn't true. With the right strategy, anyone can beat the market.

The LST Beat the Market Growth Stock Strategy is a proven system that has outperformed the S&P500 in 8 of the last 9 years. We provide all of the research and data needed to make informed decisions, so you no longer have to spend hours trying to find good stocks yourself.
The LST Beat the Market System Selects 35 Growth Stocks and Averages a 25.6% Annual Return
★ 35 Stocks That Already Beat The Market ★
★ Buy The Stocks & Hold For 12 Months - Then Rotate ★
★ Fully Documented Performance Track Record ★
★ Full Strategy Videos & eBook ★
Take The Pain Out Of Stock Selection With a Proven Strategy
How to calculate risk-adjusted alpha in stocks
Alpha measures how well a particular stock or mutual fund performs compared to the market. You can calculate it in different ways, but you usually use historical data or beta. Alpha can help you choose stocks that have the potential to perform better than the market and see how well your current investments are doing.
What is a good alpha for a stock?
A good alpha for a stock is anything above zero. This means that the stock has outperformed its benchmark. Ideally, you want to find stocks with alphas that are as high as possible since this indicates that they have the potential to generate higher returns than the market average.
A stock with an alpha of 1 or higher is considered a good investment. This means that the stock has outperformed the market by at least 1% over a period of time.
How to calculate the alpha of a stock
There are two ways to calculate alpha:
The simplest way to calculate alpha is to subtract the market return from the stock’s or mutual fund’s return. For example, if the market returned 12% last year and your stock portfolio only returned 11%, your alpha would be -1%.
The second way to calculate alpha is to compare the risk-adjusted returns of a stock or mutual fund to its benchmark index. Risk-adjusted returns consider factors such as volatility, which can impact a security’s performance. A higher risk-adjusted return indicates that a security has outperformed its benchmark index after considering these risk factors.
What is a risk-adjusted return?
A risk-adjusted return measures a security’s performance, considering the risk associated with that security. It is used to compare the risk-adjusted returns of different securities to see which one performed better after accounting for the amount of risk they each carried.
The risk-free rate of return
The risk-free rate of return is typically taken to be the return of US treasuries. US 10-year treasury bonds are considered a risk-free investment, yielding 4% per year. So, to calculate any risk-adjusted return, you need to subtract 4% from the asset’s return.
There are two ways to calculate risk-adjusted returns:
The Sharpe Ratio
The Sharpe Ratio takes the asset’s return, subtracts the risk-free rate, and divides the result by the asset’s standard deviation. This measures how much more return you are getting per unit of risk by investing in that particular security.
The Sortino Ratio
Similar to the Sharpe ratio, the Sortino ratio measures an investment’s reward-to-risk ratio. However, instead of considering the overall volatility (standard deviation) as a measure of risk, it only considers the downside volatility. This makes it more accurate at measuring true risk and better reflects investors’ goals: maximizing returns while minimizing drawdowns.
Jensens Alpha
Jensen’s alpha measures the alpha an investment manager generates after adjusting for the risk associated with a specific asset. It also considers market volatility and compares it to the expected return on a portfolio or mutual fund. Like the Sharpe ratio, Jensen’s Alpha indicates whether an investor is earning more than expected returns given the risk taken.
A positive Jensen’s Alpha means the manager has generated additional returns over those expected. In contrast, a negative Jensen’s Alpha suggests that the investor is underperforming relative to what would be expected given the amount of risk taken.
How to use alpha for investing
There are several ways to use alpha when making investment decisions. One way is to use it as a measure of risk-adjusted returns. This can help you identify stocks or mutual funds that have the potential to generate higher returns than their benchmark indexes after taking into account risk factors.
Another way to use alpha is to compare the performance of different stocks or mutual funds within the same asset class. For example, if you compare two stock portfolios, the one with the higher alpha will likely be the better performer.
Finally, you can use alpha as part of your overall investment strategy. For example, you might allocate a certain percentage of your portfolio to stocks or mutual funds with high alpha to generate higher returns.
Generally, a stock or mutual fund with a high alpha has the potential for higher returns. Investors should exercise caution when investing in securities with high alphas, as they can be more volatile than the market as a whole.
How to calculate the alpha of a stock in Excel
To calculate the alpha of a stock in Excel, you can use the following formula:
Alpha = ((Portfolio Return% – Risk Free Rate of Return%) – Beta * (Benchmark Return% – Risk Free Rate of Return%)
| A | B | |
| 1 | Alpha = 8.8% | =SUM((B2-B4)-B3*(B5-B4)) |
| 2 | Portfolio/ETF Return | 30% |
| 3 | Beta | 1.10 |
| 4 | Risk-Free Rate of Return (10-Year Treasury Yield) | 8% |
| 5 | Benchmark’s Return | 20% |
Excel Formula & Calculation Table – Copy Highlighted Cells into Excel & It Works
Example: Calculating alpha for an ETF or portfolio
This example shows how to calculate the Invesco QQQ Nasdaq 100 ETF alpha.
| A | B | |
| 1 | Alpha | 3.7% |
| 2 | Portfolio/ETF Return (Invesco QQQ 3-Year Annual) | 13% |
| 3 | Beta QQQ (3 Year) | 1.07 |
| 4 | Risk-Free Rate of Return (10-Year Treasury Yield) | 4% |
| 5 | Benchmark 3-Year Return (S&P500) | 9% |
Excel Formula & Calculation Table for QQQ – Copy & Paste Highlighted Cells into Excel
You can see that investing in the Invesco QQQ Nasdaq 100 index tracking ETF yields an expected yearly Alpha of 3.7% above the S&P 500 returns.
Example: Calculating alpha for Apple Inc.
This example shows how to calculate the Alpha for Apple Inc.
| A | B | |
| 1 | Alpha | 24.2% |
| 2 | Stock Return (Apple 3-Year Annual) | 34% |
| 3 | Beta AAPL (3 Year) | 1.17 |
| 4 | Risk-Free Rate of Return (10-Year Treasury Yield) | 4% |
| 5 | Benchmark 3-Year Return (S&P500) | 9% |
Excel Formula & Calculation Table for AAPL – Copy & Paste Highlighted Cells into Excel
Here, you can see Apple Inc. has an incredibly high alpha of 24.2%. This is because Apple’s stock price increased 34% per year with a Beta of 1.17, compared to the 9% of the S&P 500.
Alpha vs. beta
Alpha and beta are two important measures that investors use to assess a stock’s risk. Alpha measures how a particular stock or mutual fund compares to the market, while beta measures how much a security moves in relation to the market.
When it comes to Alpha and Beta, there are a few things to keep in mind:
- Alpha and beta can be positive or negative.
- Alpha reflects the possibility of high stock price performance, while beta reflects the volatility of a security.
- Alpha is used to calculate risk-adjusted returns, while beta is not.
- Beta is more popular than alpha because it is easier to calculate.
- Alpha should not be used as the only measure of a security’s risk or volatility.
- Alpha and beta are important indicators for investors to consider when making investment decisions.
- Most stock software contains Beta calculations but not alpha.
In summary, alpha measures how well a security performs compared to the market, while beta measures how volatile a security is relative to the market. Both Alpha and Beta are important factors to consider when making investment decisions.
Beat The Market, Avoid Crashes & Lower Your Risks
Nobody wants to see their hard-earned money disappear in a stock market crash.
Over the past century, the US stock market has had 6 major crashes that have caused investors to lose trillions of dollars.

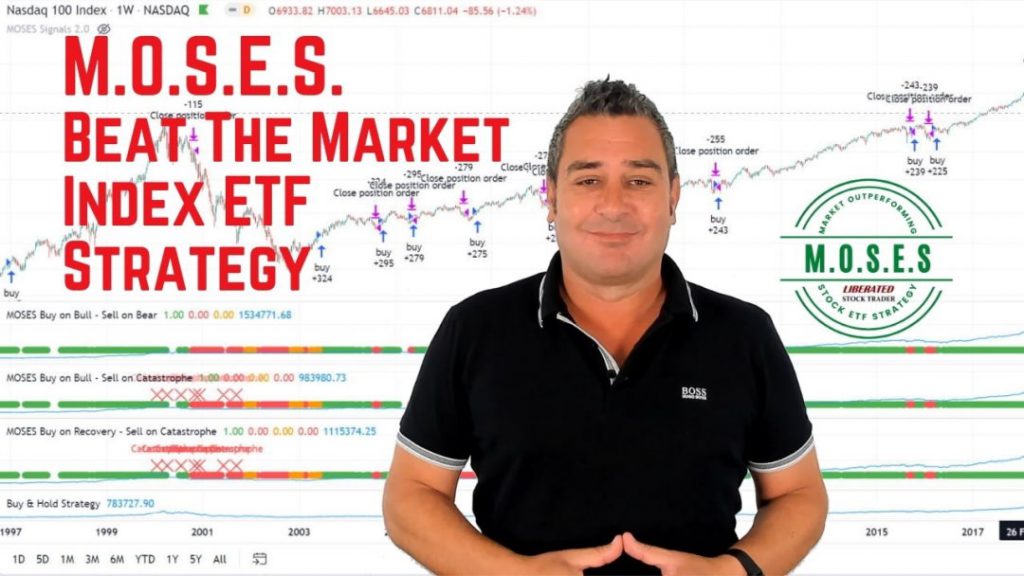
The MOSES Index ETF Investing Strategy will help you minimize the impact of major stock market crashes. MOSES will alert you before the next crash happens so you can protect your portfolio. You will also know when the bear market is over and the new rally begins so you can start investing again.
MOSES Helps You Secure & Grow Your Biggest Investments
★ 3 Index ETF Strategies ★
★ Outperforms the NASDAQ 100, S&P500 & Russell 3000 ★
★ Beats the DAX, CAC40 & EURO STOXX Indices ★
★ Buy & Sell Signals Generated ★
MOSES Helps You Sleep Better At Night Knowing You Are Prepared For Future Disasters
Why do investors seek alpha?
Investors seek alpha to generate higher returns than the market as a whole. Alpha measures how well a security performs compared to the market, so investors who find stocks or mutual funds with high alpha can expect to see better-than-average returns.
Additionally, alpha can be used to measure risk-adjusted returns, which can help investors identify securities that have the potential to generate higher returns than their benchmark indexes.
Conclusion
In conclusion, alpha is an important concept that all investors should be aware of. By understanding what it is and how to use it, alpha can improve your investment decisions and portfolio performance!
Thanks for reading! We hope this article helped you better understand alpha and how to use it in your investment portfolio.
FAQ
What is the best software for finding high-alpha stocks?
Our testing shows that Stock Rover is the best screening software for finding, researching, and investing in high-alpha growth stocks. Stock Rover has extensive research tools and 10 years of historical alpha performance of stocks, ETFs, and mutual funds.
What is alpha in investing?
Alpha refers to a fund's excess returns relative to a benchmark index's return. It's a measure of an investment's performance on a risk-adjusted basis. A positive alpha means the fund has outperformed its benchmark index.
How is alpha calculated?
Alpha is calculated using the Capital Asset Pricing Model (CAPM), which measures the returns of the investment against the returns of the market over a specific period, adjusting for risk.
Why is alpha important?
Alpha is crucial as it provides insight into a fund manager's performance and skill. A positive alpha indicates that the manager has added value beyond the expected returns.
Is a high Alpha always good?
A high alpha can indicate superior performance but may signal higher risk. Investors should consider alpha along with other risk metrics before making investment decisions.
Can alpha be negative?
Yes, alpha can be negative. A negative alpha indicates that the investment has underperformed its benchmark index.
What does alpha mean in stocks?
In stocks, alpha represents the amount by which a stock's return exceeds or falls short of its expected return, given its risk and market conditions.
How does alpha relate to beta?
While alpha measures an investment's performance against a benchmark, beta measures its volatility or systematic risk compared to the market. Both are used together for risk-adjusted performance evaluation.
Is alpha reliable?
Alpha is a useful measure, but it isn't infallible because it measures only past performance. It also depends on the accuracy of inputs and the appropriateness of the benchmark used.
Does alpha indicate risk?
Alpha does not directly indicate risk, but it can be used to assess the potential risks associated with a given investment. The higher the alpha, the more likely an investment is to outperform its benchmark index or other investments of similar risk. However, it is important to consider the beta and other factors when evaluating an investment.
Does alpha measure absolute returns?
Alpha measures the return of an investment relative to its benchmark, not absolute returns. Investors must consider total stock price increases, including dividend payouts, to measure absolute returns.
What is a good alpha?
For a stock, a positive alpha, indicating it has outperformed its benchmark, is considered good. Ideally, you should seek stocks with high alphas, as they have the potential to yield returns surpassing the market average.
What's the difference between Alpha and R-squared?
While alpha measures performance against a benchmark, R-squared measures the correlation of an investment's returns to those of a benchmark.
What does alpha mean in mutual funds?
In mutual funds, alpha measures how much the fund has outperformed or underperformed its benchmark index on a risk-adjusted basis.
Can alpha be used for portfolio evaluation?
Yes, alpha can evaluate a portfolio's performance, indicating whether it has outperformed or underperformed its benchmark index after adjusting for risk.
How do fund managers use alpha?
Fund managers use alpha to showcase their skills. A high alpha suggests they've generated extra returns over what the market or sector has provided.
How does market efficiency affect alpha?
In an efficient market, alpha opportunities (chances to outperform the market) should be scarce as all information is already factored into prices. Only skilled managers are expected to generate positive alpha consistently.
