Our research shows you how to create the best dividend stock screener. First, decide on a high-yield, safe, or dividend growth strategy. Next, choose our tested criteria for your screener, such as payout ratio, yield, and coverage.
Finding great companies that pay a regular, reliable, and growing dividend is the cornerstone of every income investor’s strategy. This article shows you how to build a stock screener based on your selected dividend strategy.
What is a Dividend Stock Screener?
A dividend stock screening software helps you filter through the stock market to find those that pay regular and sustainable dividends. The best dividend screeners have the following criteria: dividend yield, payout ratio, dividend growth, sales, earnings, and a 10-year financial data history.

1. Select Your Dividend Stock Screener

I believe only one stock screener and analysis platform on the market will enable you to flexibly implement the dividend investing strategies detailed in the next sections.
The Best Dividend Screener for USA & Canada Investors
The best tool for the job is Stock Rover, the winner of our Top 10 Best Stock Screeners Comparison. Also, Stock Rover won our Best Value Investing Stock Screener Comparison.
Try a free 14-day trial of Stock Rover (no card required); this will give you the Premium Plus Service for free for 14 days. You need the Premium Plus Service to access the remarkable 10-year dividend history, fair value, and margin of safety criteria exclusive to Stock Rover.
![]() Get A Free 14-Day Stock Rover Premium Trial
Get A Free 14-Day Stock Rover Premium Trial
The Best Dividend Screeners for International Investors
If you plan to build a portfolio of dividend stocks outside of the USA & Canada, you must select TradingView or MetaStock.
TradingView provides detailed value and dividend stock screening for nearly every stock on the planet. Easy to use yet powerful, TradingView is an excellent choice for international investors. Try TradingView Free
MetaStock provides a great package of fundamental screening and real-time news. Compelling technical analysis and system backtesting is also part of the package. Try MetaStock 3 Months for the Price of 1
2. Choose a Screening Strategy
We share four possible dividend/income strategies you could adopt, and you can choose the one that is right for your investing style.
1. High Yield Dividend Strategy
The most obvious first strategy to pursue is to look for companies with the highest dividend yield. If a company has a current dividend yield of 10%, then should you expect a 10% income from your investment for that year?
The answer is maybe.
10% is a very high yield, possibly because of several reasons. For example, the stock price may have dropped dramatically, meaning the dividend yield looks much higher because dividend yield is the dividend payment per share dividend by the price per share.
So, in addition to a high-yield strategy, you need to be able to ensure the dividend can be paid in the future, so you would look for a payout ratio that is not too high, ideally less than 60.
High Dividend Yield Stock Screening Criteria
- Market Capitalization > $500 M
- Dividend Yield > 3% < 10%
- Dividend 1-Year Change % > 2%
- Dividend 3-Year Average % > 2%
- Payout Ratio > 30 and < 60
2. Safe Dividends Strategy
If you want to ensure the dividends you are banking on are safe, you should look for additional factors to help support the notion you will continue to receive dividends.
Look for higher capitalized companies, preferably above $2 billion. Lowering your dividend yield expectations to greater than 1.5% will enable companies with sustainable dividends to appear in your scan. You might also want to drop your 1-year dividend change, 3-year, and 5-year dividend average criteria to >0%. This ensures they are paying a dividend over the long term.
Ensure your stocks are floated on a major (well-regulated) exchange like the LSE, DAX, NYSE, or NASDAQ.
You may also want to drop your payout ratio criteria to <50 to ensure that the company is not already paying out too much in relation to its earnings.
Finally, you will want to make sure that the company is experiencing sales growth above the dividend averages or growth. This is additional insurance, so you know sales are growing; therefore, there should not be an impact on dividends in the future.
Safe Dividends Screening Criteria
- Market Capitalization > $2000 M
- Dividend Yield > 1.5%
- Dividend 1 Year Change % > 0%
- Dividend 3-Year Average % > 0%
- Dividend 5-Year Average % > 0%
- Stocks on major Exchange (not OTC)
- Payout Ratio > 30 and < 50
- Sales Growth 5 Yr Avg > 4.5%
3. Long-Term Dividend Growth Strategy
The Dividend Kings or Dividend Aristocrats strategy essentially means investing in companies with a long history of continually paying and increasing dividends. You will need a stock screener with a large historical database of earnings and dividend payments, such as Stock Rover.
The criteria shown here are calculated for a 10-year period [Y9 – Y1]. This would typically return a list of only 5% of the NYSE or NASDAQ listed stocks. Some well-known names, such as IBM, Texas Instruments, and Disney, meet these criteria today.
Long-term Dividend Growth Screening Criteria
- Dividend per share $ Y9 > Dividend per share Y8 > Dividend per share Y7 > Dividend per share Y6 > Dividend per share Y5 > Dividend per share Y4 > Dividend per share Y3 > Dividend per share Y2 > Dividend per share Y1
Stock Rover 4.7/5⭐ : My Top Pick for Smart Investors
Investing In Stocks Can Be Complicated. Stock Rover Makes It Easy.
★
Growth Investing - with industry-leading
Research Reports ★
★ Value Investing - using Warren Buffett's Fair Value and Margin-of-Safety ★
★ Income Investing - rank by yield, growth, quality, and safety using 650 metrics ★

"I have been researching and investing in stocks for 20 years! I now manage all my long-term investments using Stock Rover." — Barry D. Moore, Founder: LiberatedStockTrader.com
4. Undervalued Stocks + Dividend Strategy
Looking for value stocks in addition to stocks paying dividends is a great strategy and the cornerstone of Warren Buffett and Ben Graham’s investing strategy. While you may buy stock in a company for the dividends if the stock price is likely to go down within your holding period, the dividends might not offset the loss, so look for value stocks that pay a dividend. It’s like buying extra insurance and avoiding unnecessary risks.
In this strategy, you want to look for inexpensive dividend-paying companies by traditional measures such as low price to earnings, price to sales, and price to book. These companies should still be growing sales and earnings.
Preferably, you will want a stock scanner (like Stock Rover) to select the lowest PE Ratio amongst the peers in the same industry or sector rather than selecting a fixed PE Ratio, e.g., PE Ratio < 12.
This is because a PE Ratio should only be used to compare values amongst companies in a similar industry or sector. For example, high-tech growth stocks like NetFlix typically have a high PE ratio; in contrast, utility companies have very low PE Ratios.
Additionally, if you select Stock Rover as your screener, you will have access to an exclusive set of criteria based on the Warren Buffett value investing principles of Fair Value/Intrinsic Value and Margin of Safety.
Value + Dividend Strategy Screening Criteria
- Dividend Yield > 2
- Dividend 5-Year Average > 1%
- EPS 5 Year Avg > 8%
- Price to Book < 1.2
- Sales 5 Year Avg > 3%
- Payout Ratio < 60
- PE Ratio = lowest 2 deciles
[Related Article: 4 Steps to Build the Ultimate Warren Buffett Value Stock Screener]
3. Build Your Dividend Stock Screener
In the previous section, I highlighted four specific dividend screening strategies and potential criteria from the financial income statement and balance sheet. You can implement them in your favorite stock screener as needed. Some of these criteria are available with most stock screeners, but all are available with Stock Rover. Also, the Stock Rover team has already programmed these four strategies into the software for you. So, this next section will use Stock Rover for the examples.
After signing up for Stock Rover, you will need five clicks to be up and running with the above strategies.
5 Clicks to Implement the Dividend Stock Screeners
- Click on Library – This opens a library of hundreds of pre-built screeners, portfolios, watchlists, and views.
- Click on Screener – This shows over 150 (and growing) different pre-built screeners.
- In the Search Box, type “Dividend.“
- Select the 6 Dividend Strategy Screeners highlighted in the screenshot below.
- Click Import Selected Items
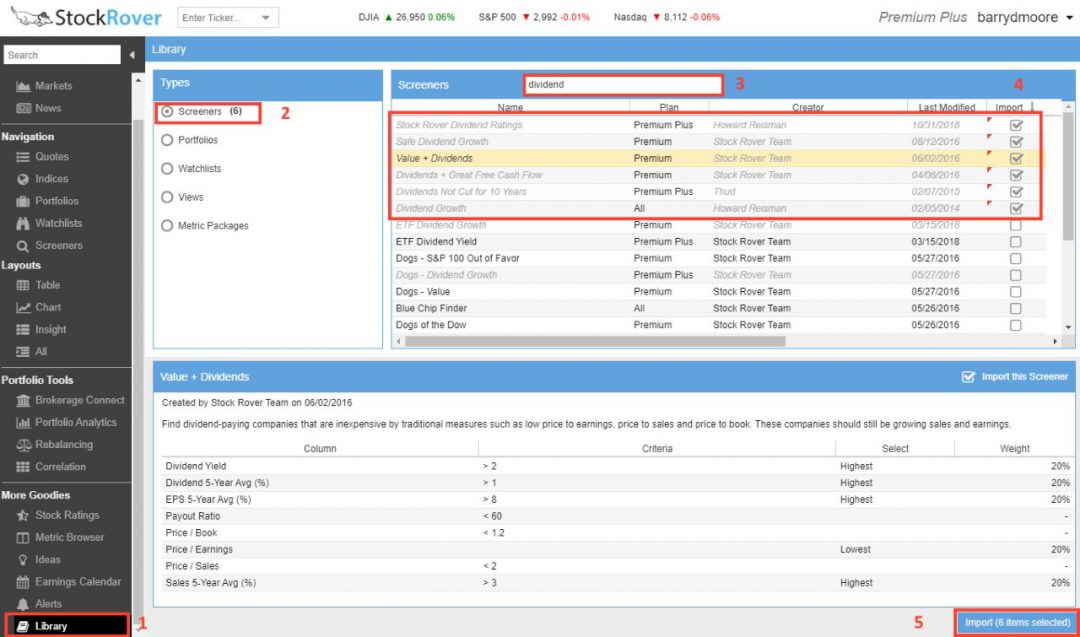
You now have six key strategies available in your screener list that are already populated with potential investments.
4. Search & Select Your Dividend Stocks
Now that you have set up your selected dividend screeners in just a few clicks, you can start the fun investigation and analysis work.
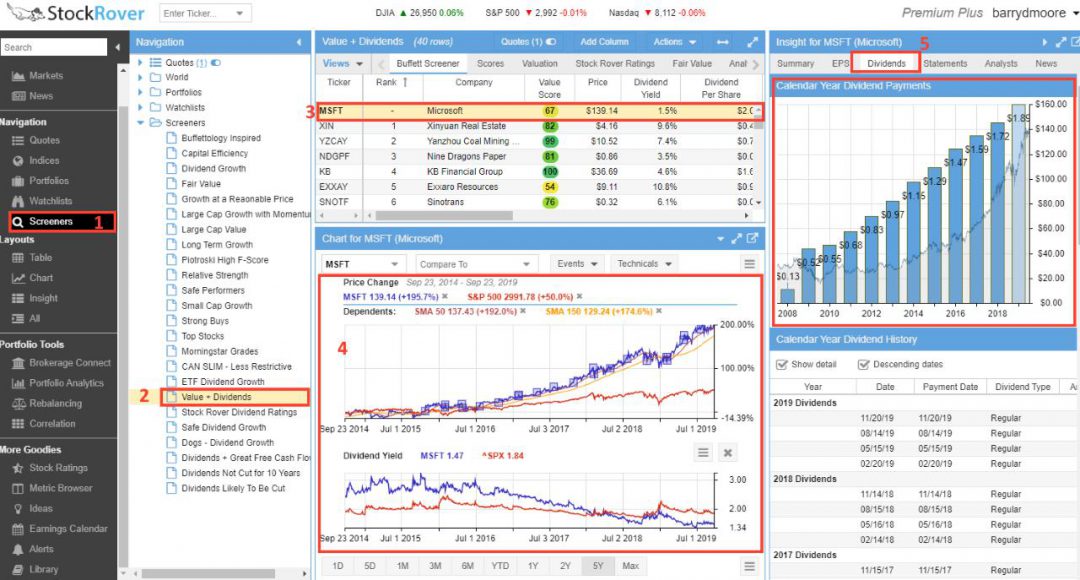
5 Easy Steps to Investigate Your Screened Dividend Stocks
- Select Screeners (left navigation menu)
- Select the Value + Dividends Screener
- Select the view “Dividends” and then the company you want to evaluate (in this case, Microsoft Ticker: MSFT)
- In the chart window, you can Compare the stock against an index, in this case, the S&P 500. You can also plot the Dividend Yield over time
- Select the tab Dividends to see the complete Dividend History and Growth for the last 10 years.
Adding Your Preferred Stocks To Your Watchlist
You can edit and tune any of the screeners you have previously imported to meet your specific needs.
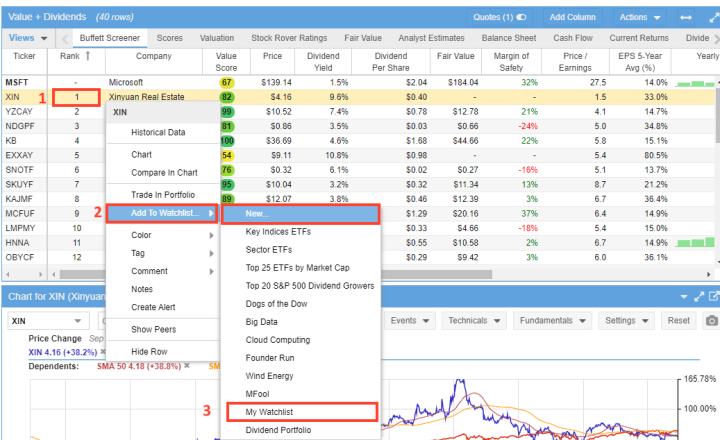
Now you have a good idea of the companies you want to analyze further. You can use the following three steps to add to a new watchlist:
- Right-click the Stock Ticker
- Select Add to Watchlist
- Click New to create a new watchlist or use the pre-built “My Watchlist.“
5. Perform Deep Company Research & Analysis
Now you have your potential buy list with stocks that passed your first wave of checks. You may want to deep-dive into the company’s financials to look at debt, interest coverage, return on equity, or even the quick ratio.
Stock Rover allows you to conduct compelling financial research on your selected companies. Additionally, the Stock Rover team has intelligently designed the Stock Ratings reported to enable you to compare a company against its sector and industry over time. This is called the Stock Ratings system.
Use Stock Ratings for Powerful Company Analysis
In the left-hand navigation, select Stock Ratings, and you will be presented with in-depth comparisons and ratings of:
- Growth – How is this company growing in comparison with its competitors?
- Valuation – Is this company good value in comparison with its competitors?
- Efficiency – Is the company run more or less efficiently than its peers?
- Financial Strength – How financially stable is the company compared to others in its industry?
- Dividend Analysis – Analysis of the sustainability of the payouts.
- Stock Price Momentum shows whether the company’s stock price has historically performed better or worse than its peers.
Stock Ratings – Financial Strength Report
In Figure 4, I have selected the Financial Strength tab because I need to evaluate the company’s financial health.
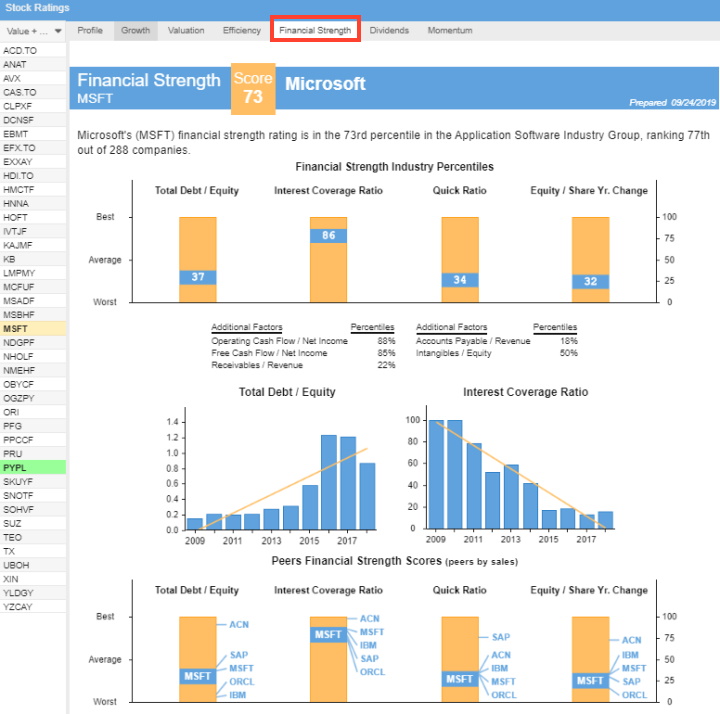
- We can see that Stock Rover rates MSFT with a Financial Strength Score of 73 (out of 100)
- The first chart, Financial Strength Industry Percentiles, shows that MSFT is below the industry average in Debt to Equity but higher than the average for the Interest Coverage Ratio.
- The following two charts show the 10-year trend for Total Debt to Equity and the Interest Coverage Ratio.
- In the chart below, look at Peers Financial Strength Scores; you can see the excellent visualization of this company’s financial strength against its competition. This is extremely useful for uncovering potential new opportunities.
Stock Ratings – Dividend Analysis Report
In the Dividends section of Stock Ratings, we see the following interesting comparisons for Apple Ticker: AAPL.
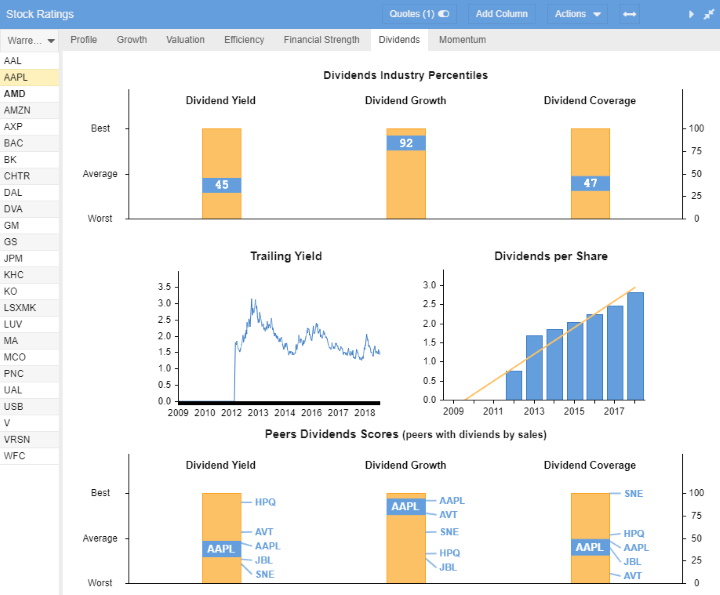
- The Dividend Industry Percentiles chart shows that AAPL has a slightly below-average dividend yield (45th percentile) compared to the industry. However, the dividend growth is amongst the best in the industry (92nd percentile), which could be very promising.
- The Trailing Yield shows us that APPL has historically accepted a dividend yield between 1.5 and 2.5% of the stock price. Notably, the dividends were re-established in 2012, and the Dividend per Share has grown strongly.
- Finally, in the Peers Dividend Scores report, we see that Hewlett Packard Inc. (Ticker: HPQ) currently offers a vastly superior Dividend Yield, but Apple’s Dividend Growth is industry-leading.
Now you have analyzed the companies you are interested in, it may be time to build your portfolio. If you need further food for thought on the topic of qualitatively analyzing a business and its industry, see this section in the article “How to Build a Buffett Value Screener,”
6. Purchase Stocks & Maintain Your Portfolio
If you do not already have a broker, or your broker is charging you more than $1 per trade, the next section will help.
1. Select The Best Commission Free Broker
Now that you have narrowed down the stocks you want to buy to build your portfolio. Remember, Warren always says:
The best time to sell is never

If you do not already have a broker to enable the purchase of shares, I recommend Firstrade, the only major $0 commission broker and winner of our Top 10 Stock Brokers Comparison.
2. Connect Stock Rover To Your Brokerage Account To Get Dividend Portfolio Analytics
If you selected Stock Rover as your stock screener, you can connect it to your Broker.
Making this connection enables some excellent portfolio reporting through Stock Rover that is not usually available with most brokers.

You will still execute the trades with your selected broker, but Stock Rover will handle the portfolio performance and risk reporting.
Simply select Brokerage Connect from the left navigation menu and follow the instructions.
3. Manage Your Portfolio With Excellent Dividend Income Reporting
You can connect Stock Rover to your broker or manually import your purchased stocks via a text file import. Either way, you will be presented with some nice portfolio reporting.
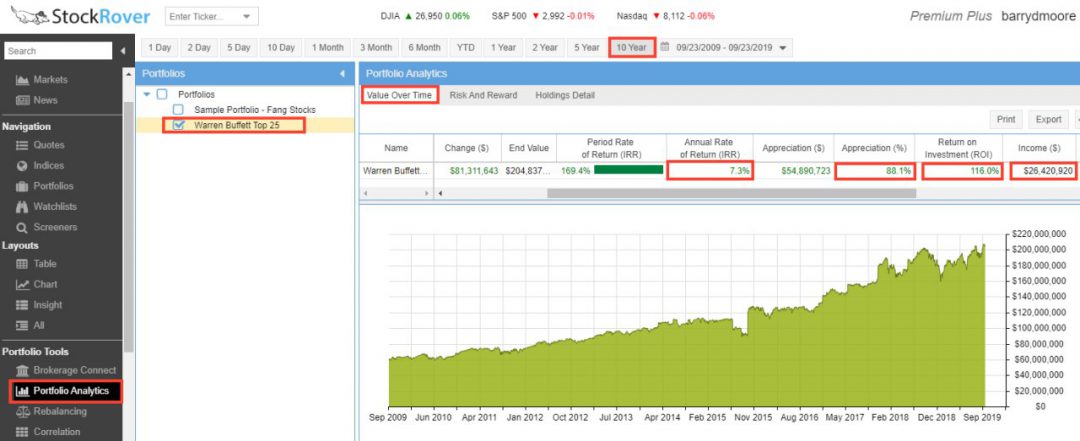
Portfolio Analytics
In the example below, I have selected the Warren Buffett Top 25 Holdings portfolio. This is pre-built and reflects the Top 25 companies that Warren Buffett owns.
Selecting the Value Over Time Tab, we can see the following metrics:
- This portfolio has made an annual rate of return of 7.3% over the last 10 years.
- The selection of stocks has appreciated by 88.1%
- The total return on investment is 116%
- The total income generated through dividends is $26 M
Dividend Stock Screener Summary
The six easy steps to building a powerful stock screener involve finding the right stock screening software and choosing your dividend investing strategy. Next, you build your screening criteria to form your list of great companies. Finally, you perform a deep analysis and decide which stocks will form the foundation of your future portfolio.
- Related Article: How to Build a Stock Portfolio Like a Pro
You want to be a successful stock investor but don't know where to start.
Learning stock market investing on your own can be overwhelming. There's so much information out there, and it's hard to know what's true and what's not.

Liberated Stock Trader Pro Investing Course
Our pro investing classes are the perfect way to learn stock investing. You will learn everything you need to know about financial analysis, charts, stock screening, and portfolio building so you can start building wealth today.
★ 16 Hours of Video Lessons + eBook ★
★ Complete Financial Analysis Lessons ★
★ 6 Proven Investing Strategies ★
★ Professional Grade Stock Chart Analysis Classes ★
23 Important Dividend Stock Screener Criteria.
Here is a comprehensive list of the most important criteria to consider when using a dividend stock screener:
Dividend Yield.
The percentage of the price per share a company pays its shareholders as annual dividends is calculated by dividing the forecasted 12-month dividend payout by the current price.
Payout Ratio.
The dividend payout ratio is Dividend Per Share as a percent of Diluted Earnings Per Share based on the TTM from the most recent quarterly report. It can measure the chance of a dividend increase or cut. For example, a company with a small Payout Ratio has room to increase its dividend.
Free Cash Flow Payout Ratio.
This alternative dividend payout ratio aims to be more accurate by excluding accounting earnings and including only actual cash generation. It is calculated as Dividend Per Share as a percent of Free Cash Flow per Share, and values less than 70 are considered best. Note that the Forward Dividend Yield and the TTM Free Cash Flow are used. (Exclusive to StockRover)
Dividend Coverage Ratio.
The dividend coverage ratio is calculated by dividing the stock’s annual earnings per share by the annual dividend. This indicates that a company can cover its dividend payments with its profits. Should be positive > 1.5
Dividend Cash Flow.
This company’s cost of payments to its common shareholders, preferred shareholders, and Noncontrolling interests over the trailing twelve-month period.
Dividend 1‑Year Chg (%).
The percentage between the last paid dividend and the corresponding dividend 1 year earlier.
Dividend 3‑Year Avg (%).
The average annual compound dividend growth for the last three years is based on the last paid dividend and the corresponding dividend paid three years earlier.
Dividend 5‑Year Avg (%).
The average annual compound dividend growth for the last 5 years is based on the last paid dividend and the corresponding dividend 5 years earlier.
Dividend 10‑Year Avg (%).
The average annual compound dividend growth for the last 10 years is based on the last paid and the corresponding dividend 10 years earlier. (Exclusive to StockRover)
Expected Dividend Growth Rate.
The growth rate between the forward dividend per share and the trailing dividend per share. This is a great indication of company and analyst expectations of future dividend growth.
Forward Dividend Growth.
The forward yield implies a percentage change in dividend per share vs. the trailing 12-month yield. This is highest when a company has just announced a dividend increase.
Dividend Yield Industry Decile.
The decile rank of the company’s Dividend Yield among all companies in the same industry. Companies with the highest yields score a 1, and the lowest-yielding companies score a 10. Great for comparing companies in the same industry. (Exclusive to StockRover)
Dividend Yield Sector Decile.
The decile rank of the company’s Dividend Yield among all companies’ yields in the same sector. Companies with the highest yields score a 1, and the lowest-yielding companies score a 10. (Exclusive to StockRover)
Dividend Per Share.
The dollar amount paid per share in dividends each year is based on the trailing twelve months’ dividend paid, updated by the forward forecast if available. It is useful to compare against the current stock price to assess your income per share.
Next Dividend Payment Per Share.
The dollar amount of the next dividend payment, quarterly or yearly.
Expected Yearly Dividends.
The expected annual dividend income is calculated as Quantity times Dividend Per Share.
Percent of Expected Yearly Dividends.
The percent of the portfolio’s expected annual dividend income from this holding. It is useful to have in your portfolio view to predict future income totals. (Exclusive to StockRover)
Dividend Frequency.
The number of times per year a dividend will be paid.
Dividend Payment Date.
The payment date of the last dividend.
Dividend Record Date.
A company establishes the cut-off date to determine which shareholders can receive dividends or distribution. If you are thinking of buying a stock for a dividend, then purchase it before this date.
Ex‑Dividend Date.
The first date following the declaration of a dividend on which the stock buyer is not entitled to receive the next dividend payment.
Dividends Rating Score.
The Stock Rover dividends percentile rating of a stock, where a score of 99 is best. The proprietary algorithm compares a company to its peers and considers the consistency of key dividend metrics and their direction of change. (Exclusive to StockRover)
Consecutive Dividend Growth Years.
The number of years in a row that the dividend per share has increased. This provides the ability to sort potential purchases on their ability to deliver consistent dividend growth. (Exclusive to StockRover)
FAQ
What is the best software for dividend stock screening?
Stock Rover is the best software for dividend stock screening. It offers powerful filters and scanning tools to help you find the best dividend stocks in the market. With Stock Rover's comprehensive database of over 10,000 stocks, you can analyze dividend yields and create customized watchlists.
What is dividend stock screening?
Dividend stock screening is a strategy investors use to identify potential dividend-paying stocks. The screening process involves filtering stocks based on specific criteria such as dividend yield, payout ratio, and the company's financial health.
Why is dividend stock screening important?
Dividend stock screening helps to pinpoint companies that consistently pay dividends. This can be an effective way to generate steady income, particularly in uncertain market conditions.
How does the dividend yield factor into stock screening?
The dividend yield is a key factor in stock screening. It represents the annual dividend payment divided by the stock's market price. A higher yield may indicate a better return on investment.
What is the payout ratio in dividend stock screening?
The payout ratio is the percentage of the company's earnings paid out as dividends. A lower ratio typically indicates that the company has room to increase its dividends in the future.
How does a company's financial health impact dividend payouts?
A company in good financial health is more likely to maintain or increase its dividend payments. Indicators of financial health include strong cash flow, low debt levels, and consistent earnings growth.
Can I use stock software to find dividend stocks?
Yes, many online brokerages and financial services websites offer stock screening tools. However, tools like Stock Rover provide vastly superior current and historical financial data, enabling refined and robust dividend investing strategies.
What is a good dividend yield for a stock?
A yield between 1.5% and 6% is generally considered good. Anything above 6% could be a sign of risk or unsustainability. Additionally, any yield below 1.5% may not be worth the risk of investing in a single stock. Looking at a company's fundamental data to determine dividend sustainability before investing is important.
What is a sustainable payout ratio?
A sustainable payout ratio varies by industry. However, a general rule of thumb is that a payout ratio below 40% is considered sustainable.
How often do companies typically pay dividends?
Most companies pay dividends every quarter, although some pay semi-annually or annually. Some real estate investment trusts (REITs) pay dividends monthly.
Can a company stop paying dividends?
Yes, a company can discontinue dividend payments at any given time. Nonetheless, such a decision is typically regarded as a measure of last resort, as it conveys a negative signal to investors.
What are the risks associated with dividend investing?
Risks associated with dividend investing include dividend cuts or eliminations, overexposure to a single sector, and the potential for lower capital gains.
Are dividend stocks suitable for all investors?
While they can provide a steady income stream, dividend stocks may not suit all investors. Those seeking high growth may prefer non-dividend-paying stocks.
Do all stocks pay dividends?
No, not all stocks pay dividends. 62% of US companies prefer to reinvest their profits into the business for growth rather than pay investors dividends.
Thanks for writing this down. I am looking for a screener which can help me build my dividend portfolio and I am quite new to investing as well.
Thanks Mike, I love Stock Rover, I hope you enjoy it too.
This is the best information on dividend selection that I have seen so far. I am going to try stock rover.