In this article, we’ll take you on a step-by-step journey to create your very own high dividend yield stock screener! Plus, we’ll guide you through the process of analyzing financials to determine whether a company is a worthy investment.
To find high-yield dividend stocks requires scanning for key criteria such as dividend yield, growth, payout ratio, and EPS. A safer and more profitable strategy will incorporate value investing criteria like margin of safety and price to sales.
Here are three tested strategies; choose the one that is right for your investing style.

What is a High-Yield Dividend Stock?
High-yield dividend stocks are a double-edged sword. The higher the dividend yield, the harder it is for the company to keep paying the high dividend. Because the dividend yield is calculated by dividing the dividend payout by the stock price, the yield increases as the stock price decreases. That is why you must also pay attention to the dividend payout ratio.
The following three strategies can all be implemented using our favorite stock screening software, Stock Rover. You can have Stock Rover for Free, but if you want to use the powerful criteria in strategy three below, you need to get a free trial of Stock Rover Premium+.
| ⚡ Features? | Charts, News, Watchlists, Broker Integration |
| 🏆 Exceptional Features? | Financial Screening, Portfolio Mgt & Rebalancing, 10-Year Database |
| 🎯 Best for | Growth, Dividend & Value Investors |
| ♲ Subscription | Monthly, Yearly |
| 🆓 Free | Try Stock Rover Free |
| 💰 Price | $0 | $29 | $49 |
| 💻 OS | Web Browser |
| 🎮 Trial | 14-Day |
| ✂ Discount Code | 25% During Premium+ Trial Period |
| 🌎 Region | USA |
Strategy 1. Highest Dividend Yield
The highest dividend yield strategy contains more risk because we can exploit large dips in stock prices to effectively maximize dividend yields. As stock prices drop, dividend yields increase. The risk here is that companies may cut future dividend payments to align with the new stock price, as the payouts may become unsustainable.
This strategy is the first thing someone new to income and dividend investing would try to implement. Naturally, they will want to choose a company that will pay the most in dividends. However, the approach is nuanced, and careful fundamental research is required to implement this strategy.
Using these criteria will help you find those highest-yielding stocks.
Highest Dividend Yield Criteria
- Market Capitalization > $500 M
- Dividend Yield > 4%
- Dividend 1-Year Change % > 0%
- Dividend 3-Year Average % > 0%
- All Exchanges (including OTC)
- Payout Ratio < 90%
Highest Dividend Yield Explained
Ideally, you will choose companies worth at least $500 million in Market Capitalization; any lower is far too risky. Next, you will search for stocks with a dividend yield greater than 4%. In this example, I have also chosen to scan for companies with at least three years of dividend payouts and a dividend increase in the previous year. Finally, select a Payout Ratio of less than 90%.
This scan will show you a list of stocks, but many of them are OTC/Pink Sheet stocks, which represent a risk as these stocks are thinly traded and lack liquidity.
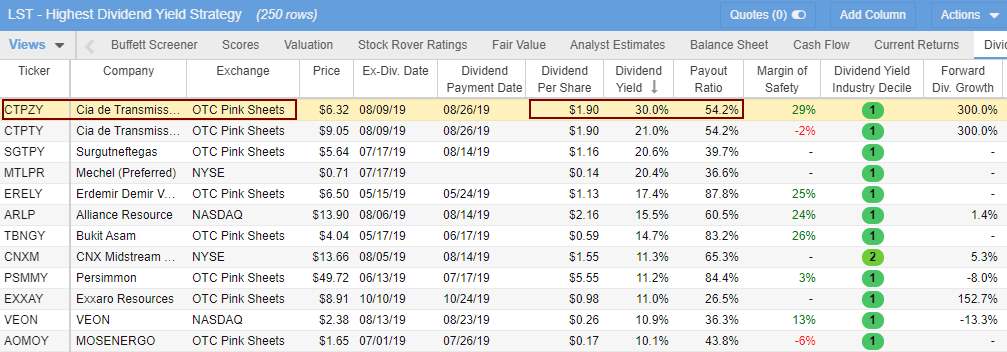
You must look deeper into any company you consider investing in. Take a look at the highest dividend yield stock in this list. CTPZY is currently yielding 30% and is listed on the OTC Pink Sheets Market. This could be a great deal, but first, let’s look closer.
Powerful Screening with Stock Rover
Key Points
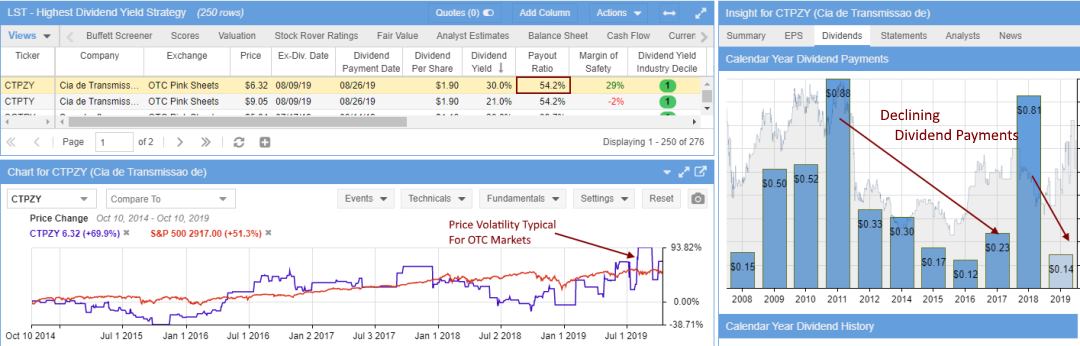
Although we have scanned for a dividend yield higher than 0%, you can see that the dividends are in constant decline to match the share price dip and the earnings reduction. Also, I am uncomfortable with a payout ratio of 54.2%; this means it is paying out over 50% of its earnings in dividends, which is on the high side and not sustainable.
Do you want to invest in that? Perhaps, if you conduct further investigation, you will find that it has a bright future in a growing market.
Strategy 2. High Dividend Yield + Growth
This strategy lowers risk by screening for profitable companies with a dividend yield greater than 3%, a previous year’s dividend yield increase greater than 2%, and a payout ratio less than 50.
Another strategy is to look for companies with the highest dividend yield. If a company has a current dividend yield of 10%, should you expect a 10% income from your investment for that year?
The answer is maybe.
10% is a very high yield, possibly because of several reasons. For example, the stock price may have dropped dramatically, meaning the dividend yield looks much higher because dividend yield is the dividend payment per share dividend by the price per share.
High Dividend Yield + Growth Criteria
- Market Capitalization > $500 M
- Dividend Yield > 3%
- Dividend 1 Year Change % > 2%
- Dividend 3-Year Average % > 2%
- EPS 5-Year Average > 0
- Payout Ratio < 50%
High Dividend Yield + Growth Explained
In addition to a high-yield strategy, you need to be able to ensure the dividend can be paid in the future, so you would look for a payout ratio that is not too high, ideally less than 50, which is still somewhat high.
It would be best if you also assumed the company had been consistently paying dividends over a period of time. The dividend 1-year change should be greater than 2%, meaning that dividend payment has increased for the past year. The dividend 3-year average should also be greater than 2%, indicating an increasing trend in the long term.
Finally, look at the 5-year average EPS, which should be more than zero, to ensure that the company consistently generates positive earnings per share. By combining these criteria, you can pick stocks with a high dividend yield and see whether they are sustainable for future payments.
Key Points
This strategy yields a list of 127 stocks; let’s compare the two highest-yielding stocks on the list and compare them. Which one would you rather invest in?
Screener Results – Enel Americas (Ticker: ENIA)
Stock Rover: My Favorite Screener
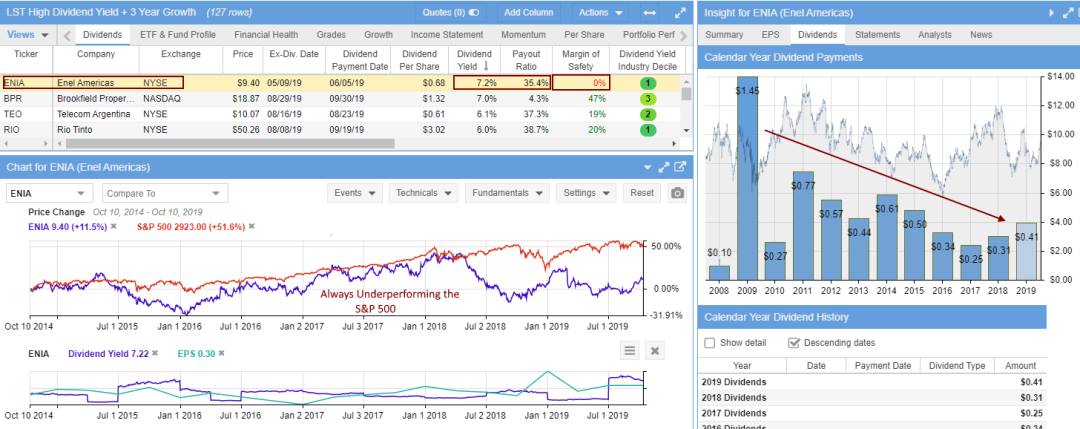
ENIA is the highest yield stock on the list, with 7.2% per year and a payout ratio of 35.4%, which looks OK. In Stock Rover, when you look at the Dividend Payments Trend on the right of the image, you can see the dividends are in continual decline. Looking closely, you can see the Buffett Margin of Safety (Exclusive to Stock Rover) is at zero. The company’s capitalization (stock market valuation) equals its future discounted cash flow (see intrinsic value). So there is some risk here.
Screener Results – Brookfield Property (Ticker: BPR)
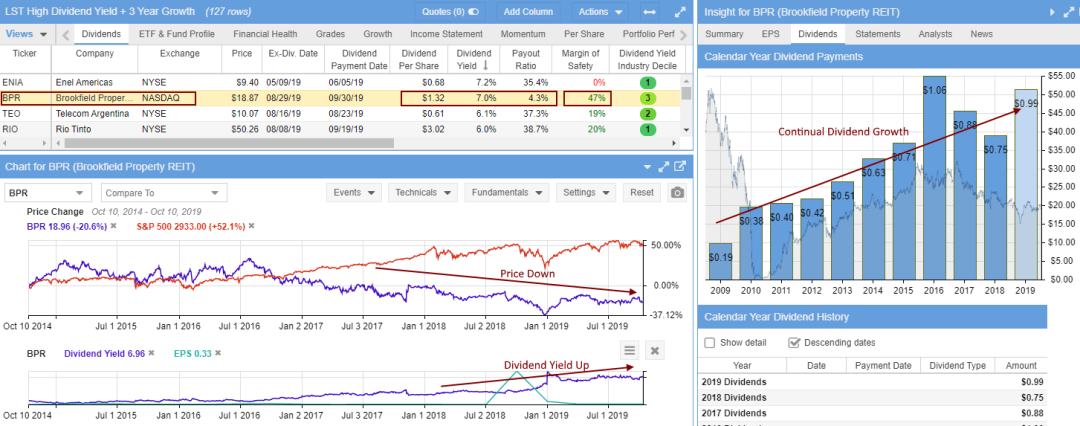
Second on the list is Brookfield Property, a Real Estate Investment Trust (REIT). High Dividend Yield & solid Dividend Growth now; this is a company I like the look of. They have an excellent dividend yield of 7%, probably because the stock price has declined so much. Here, you can see the relationship between stock price and dividend yield. The big difference between these two companies is that BPR has an excellent 10-year record of increasing dividend payments (see the right panel) and a huge margin of safety of 47%.
The problem with this stock is that if you had purchased it two years ago, you would be down 30% on the stock price but up 14% on the dividend. That would be a net loss. However, you only lose money when you sell the stock; if you are in for the long term and buy now, you can choose when to sell for an overall profit.
Which one would you invest in?
Strategy 3. High Dívidend Yield + Value
This dividend strategy looks for value stocks in addition to stocks paying dividends; it is a great strategy and the cornerstone of Warren Buffett and Ben Graham’s value investing strategy. While you may buy stock in a company for the dividends if the stock price is likely to go down within your holding period, the dividends might not offset the loss, so look for undervalued stocks that pay a dividend. It’s like buying extra insurance and avoiding unnecessary risks.
High Dividend Yield + Value Criteria
- Dividend Yield > 2
- Dividend 5-Year Average > 1%
- EPS 5 Year Avg > 8%
- Payout Ratio < 60
- Sales 5 Year Avg > 3%
- Price / Sales < 2
- Margin of Safety > 1
High Dividend Yield + Value Explained
In this strategy, we look for inexpensive dividend-paying companies by traditional measures such as low price to earnings, price to sales, and price to book. These companies should still be growing sales and earnings.
We also add an additional requirement: a margin of safety greater than 1. This means that the stock should be able to survive a substantial price decline before the investment begins to lose money. In other words, if the market turns bearish and the stock price drops, the downside should be limited due to the margin of safety level. The margin of safety is based on a combination of the expected future cash flow and earnings of the company.
Select Stock Rover as your screener. You will have access to an exclusive set of criteria based on the Warren Buffett value investing principles of Fair Value/Intrinsic Value and Margin of Safety.
A Practical Example of Fundamental Analysis
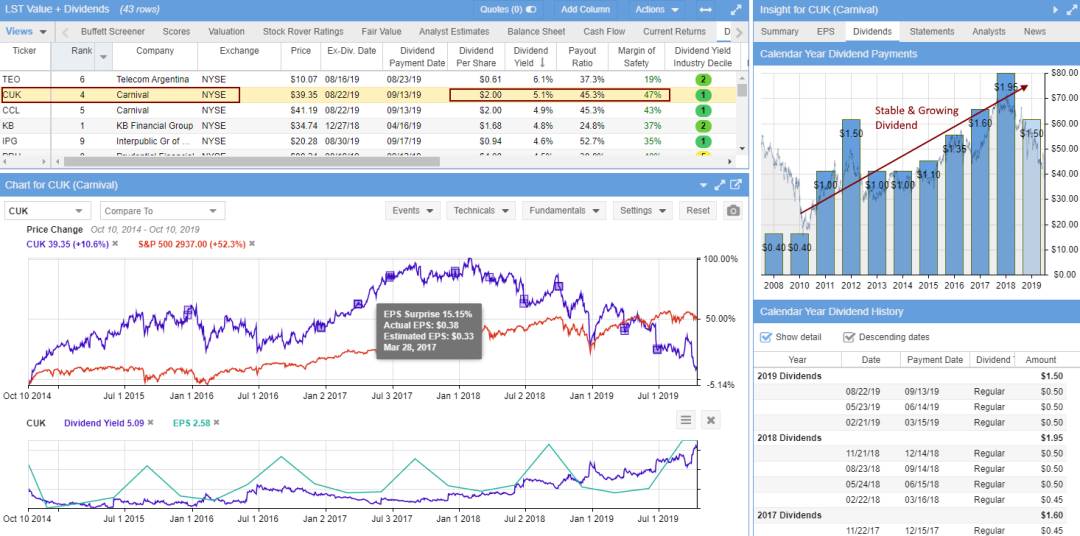
Let’s examine one of the companies, Carnival (Ticker: CUK), which has the second-highest dividend yield in the stock screen results.
Get A Free 14-Day Stock Rover Premium+ Trial
From the initial view (above), I can see that earnings have continued to grow despite the stock price’s terrible year.
The dividend yield is 5.1%, which is healthy. The payout ratio is 45%, which is reasonable.
It also has a nice-looking margin of safety of 47%. So, the deal has minimal risk at this price of $39 per share.
If you think this is a good stock, you should investigate the financials. Below are the Stock Rover Ratings for Carnival.
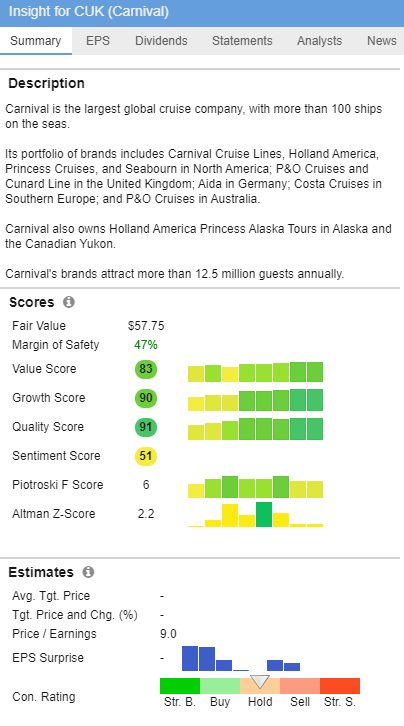
Value Score – 83. The Stock Rover value score looks at EV / EBITDA, P/E, EPS Predictability, Price / Tangible Book, and Price / Sales. The Price / Tangible Book and Price / Sales values are compared within a sector, whereas the other metrics are compared across all stocks with adequate data. The best companies score 100, and the worst score 0.
Growth Score – 90. The Stock Rover growth score looks at the five-year history and the forward estimates for EBITDA, Sales, and EPS growth to rank the best companies across all stocks. The best companies score 100, and the worst score 0.
Quality Score – 91. The Stock Rover quality score compares profitability and balance sheet metrics to find high-quality companies. Our computation includes ROIC, Net Margin, Gross Margin, Interest Coverage, and Debt / Equity ratio values. The best companies score 100, and the worst score 0.
So, this stock is looking like something you might invest in.
In summary, this strategy is designed for investors who want stable income while avoiding excessive risk. Focusing on dividend yield and value criteria such as price/sales and margin of safety, this strategy seeks to identify undervalued stocks that can still pay out dividends even in uncertain economic times.
Choosing a Dividend Stock Screener
Using Microsoft Excel to crunch company financials is long dead and very inefficient. Of all the screeners we tested, Stock Rover is the best for dividends, growth stocks, and value investing. It will enable you to implement first-class dividend income investing strategies.

Option 1 – Get Stock Rover – For USA & Canadian Investors
The best tool for the job is Stock Rover, the winner of our Top 10 Best Stock Screeners comparison. Sign Up For A Free 14 14-day trial of Stock Rover (no card required); this will give you the Premium Plus Service for free for 14 days. You need the Premium Plus Service to access the awesome 10-year dividend & financial history, Fair Value, and Margin of Safety criteria exclusive to Stock Rover.
Get A Free 14-Day Stock Rover Premium+ Trial
Option 2 – For International Investors
If you plan to build a portfolio of dividend stocks outside the USA & Canada, select TradingView or MetaStock.
MetaStock + Refinitiv Xenith provides a great package of fundamental screening through Refinitiv and real-time news. Compelling technical analysis and system backtesting are also part of the package. Try MetaStock 3 for 1
TradingView provides detailed value and dividend stock screening for nearly every stock on the planet. Easy to use yet powerful, TradingView is an excellent choice for the international investor. Try TradingView Free
Set Up Your High Dividend Yield Screener
In the previous section, I highlighted three specific dividend screening strategies and potential criteria from the financial income statement and balance sheet. You can implement them in your favorite stock screener as needed. Many of these criteria are available in our recommended stock screeners, but all are available in Stock Rover. The Stock Rover team has already programmed similar strategies into your software. This next section will show how you could use Stock Rover to import and adapt existing screeners.
After signing up for Stock Rover, you will need five clicks to be up and running with the above strategies.
5 Clicks to Implement the Dividend Stock Screeners
- Click on Library – This opens a library of hundreds of pre-built screeners, portfolios, watchlists, and views.
- Click on Screener – This shows over 150 (and growing) different pre-built screeners.
- In the Search Box, type “Dividend.“
- Select the 6 Dividend Strategy Screeners highlighted in the screenshot below.
- Click Import Selected Items
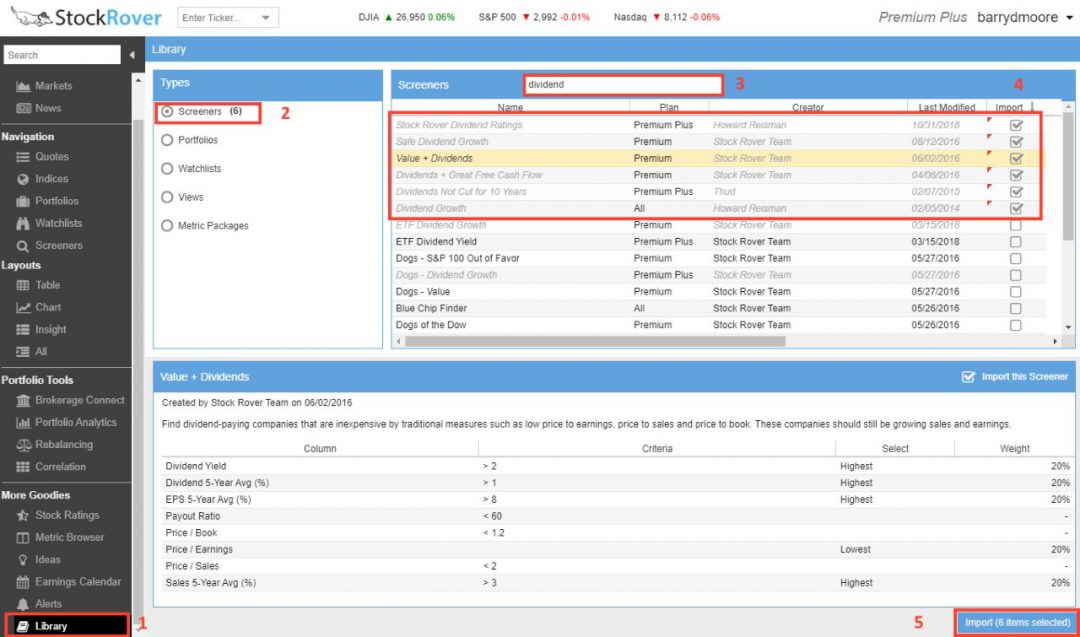
You now have six key strategies available in your screener list that are already populated with potential investments.
Researching High-Dividend Yield Stocks
Now you have your potential buy list with stocks that passed your first wave of checks. You may want to deep-dive into the company’s financials to look at debt, interest coverage, return on equity, or even the quick ratio.
Stock Rover allows you to conduct powerful financial research on your selected companies. Additionally, the Stock Rover team has intelligently designed the Stock Ratings reported to enable you to compare a company against its sector and industry over time. This is called the Stock Ratings system.
Using Stock Ratings for Company Analysis
In the left-hand navigation, select Stock Ratings, and you will be presented with in-depth comparisons and ratings of:
- Growth – How is this company growing in comparison with its competitors?
- Valuation – Is this company good value in comparison with its competitors?
- Efficiency – Is the company run more or less efficiently than its peers?
- Financial Strength – We look at this report below.
- Dividend Analysis – We look at this report below.
- Stock Price Momentum shows whether the company’s stock price has historically performed better or worse than its peers.
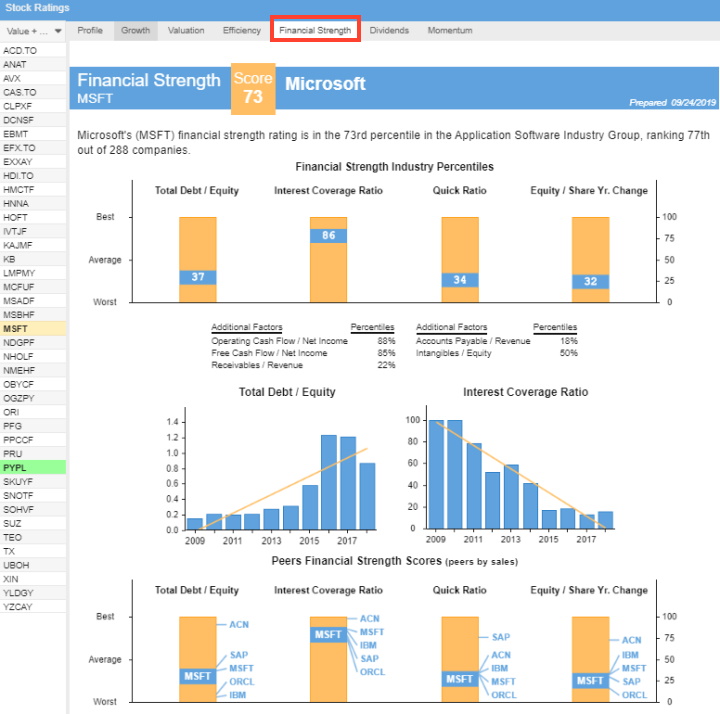
Stock Ratings – Financial Strength Report
Stock Rover: Powerful Financial Research
In Figure 4, I have selected the Financial Strength tab because I need to evaluate the company’s financial health.
- We can see that Stock Rover rates MSFT with a Financial Strength Score of 73 (out of 100)
- The first chart, Financial Strength Industry Percentiles, shows that MSFT is below the industry average in Debt to Equity but higher than the average for the Interest Coverage Ratio.
- The following two charts show the 10-year trend for Total Debt to Equity and the Interest Coverage Ratio.
- In the screenshot below, you see Peers Financial Strength Scores and the excellent visualization of this company’s financial strength against its competition. This is extremely useful for uncovering potential new opportunities.
Stock Ratings – Dividend Analysis Report
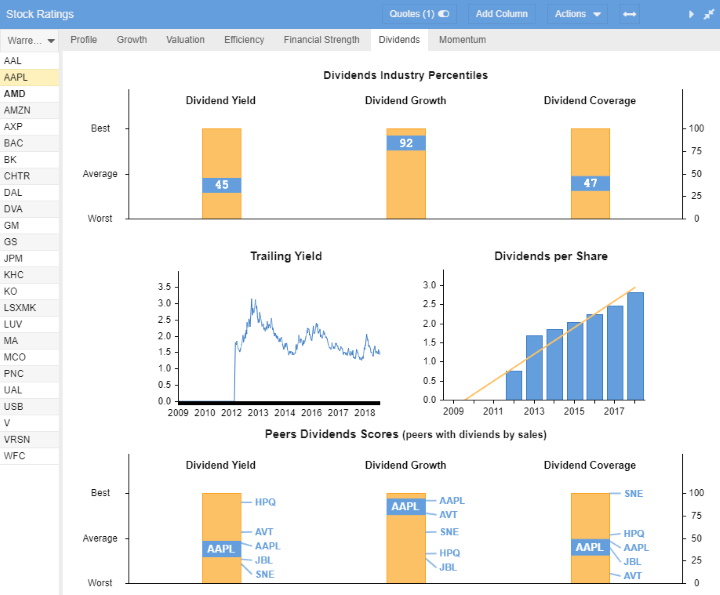
In the Dividends section of Stock Ratings, we see the following interesting comparisons for Apple Ticker: AAPL.
- The Dividend Industry Percentiles chart shows that AAPL has a slightly below-average dividend yield (45th percentile) compared to the industry. The dividend growth is amongst the best in the industry (92nd percentile), which could be very promising.
- The Trailing Yield shows us that APPL has historically kept its dividend yield between 1.5 and 2.5% of the stock price. Notably, the dividends were re-established in 2012, and the Dividend per Share has grown strongly.
- Finally, in the Peers Dividend Scores report, we see that Hewlett Packard Inc. (Ticker: HPQ) currently offers a vastly superior Dividend Yield, but Apple’s Dividend Growth is industry-leading.
Now you have analyzed the companies you are interested in, it is time to build your portfolio. If you need further food for thought on the topic of qualitatively analyzing a business and its industry.
High Dividend Yield Portfolio Analytics
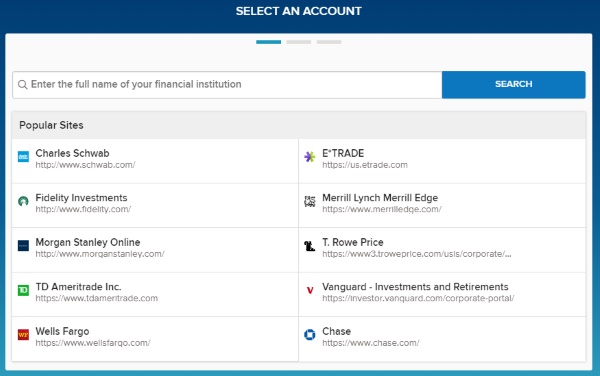
If you selected Stock Rover as your stock screener, you can connect it to your broker. For further analysis, you can use the Stock Rover Portfolio Analyzer. This tool allows you to analyze your portfolio using a range of metrics and is updated with real-time data from your broker account. These include Total Return, Beta Risk, Volatility Score, and more.
Once you have set up your stock screener and chosen stocks for your High Dividend Yield Portfolio, you can further analyze them using Stock Rover’s Stock Comparison Tool. This tool allows you to compare multiple stocks at once and make a more informed decision on which stock to buy or sell. You can also use this tool to monitor the performance of your portfolio over time and identify any discrepancies.
Making this connection enables some excellent portfolio reporting through Stock Rover that is not usually available with most brokers.
You will still execute the trades with your selected broker, but Stock Rover will handle the portfolio performance and risk reporting.
Select Brokerage Connect from the left navigation menu and follow the instructions.
Manage Your Portfolio With Dividend Income Reporting
You can connect Stock Rover to your broker or manually add the stocks you purchased or via a text file import. Either way, you will be presented with some nice portfolio reporting.
Portfolio Analytics
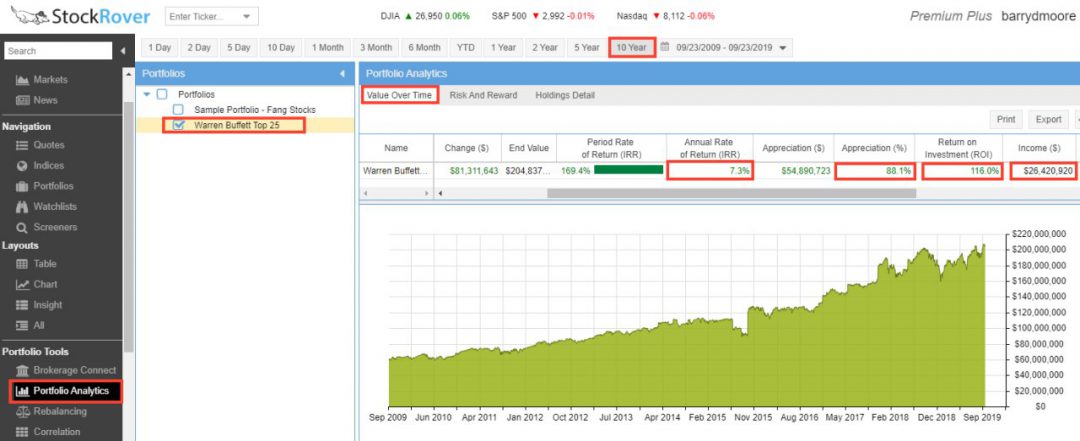
In the example below, I have selected the Warren Buffett Top 25 Holdings portfolio. This is pre-built and reflects the Top 25 companies that Warren Buffett owns.
Selecting the Value Over Time Tab, we can see the following metrics:
- This portfolio has made an annual rate of return of 7.3% over the last ten years.
- The selection of stocks has appreciated by 88.1%
- The total return on investment is 116%
- The total income generated through dividends is $26 M
Summary: High Dividend Yield Stocks
The five easy steps to building a powerful high dividend yield stock screener involve finding the right stock screening software and choosing your dividend investing strategy. Next, you build your screening criteria to form your list of great companies. Finally, you perform a deep analysis and decide which stocks will be the foundation of your future portfolio.
FAQ
What is the best software for finding high-yield stocks?
Stock Rover is an excellent tool for finding high-yield dividend stocks. It has powerful screening capabilities and analytics tools to help you quickly uncover undervalued stocks with strong dividend yields and earnings growth.
What are high-yield dividend stocks?
High-yield dividend stocks are shares in companies that return a significant portion of their profits to shareholders as dividends. These stocks typically have yields above 5%.
How are dividend yields calculated?
The dividend yield is calculated by dividing the annual dividend payment by the stock's current market price. The result is expressed as a percentage.
What sectors commonly have high-yield dividend stocks?
Due to their stable and predictable income streams, sectors like Utilities, Real Estate, Energy, and Telecommunications often have high-yielding dividend stocks.
Are high-yield dividend stocks safe?
While high dividend yields can be attractive, they may also indicate financial instability due to the unsustainability of the dividend payments. Always research a company's dividend payout ratio and coverage before investing.
Why do some companies not pay dividends?
Some companies, like Amazon Inc., prefer to reinvest their profits into the business for growth rather than paying dividends to shareholders.
Are dividends taxable?
Yes, dividends are considered income and are usually subject to taxation. However, the rate varies based on your tax bracket, location, and whether dividends are qualified.
What is the ex-dividend date?
The ex-dividend date is the cut-off date to buy a stock and receive its upcoming dividend payment.
How can I find high-yield dividend stocks?
According to our testing, the best screening tools to identify high-yield dividend stocks are Stock Rover for U.S. investors and TradingView for international markets. Both tools have free and premium services worth using.
Do all high-yield dividend stocks pay dividends quarterly?
Not necessarily. While most U.S. companies pay dividends quarterly, some pay monthly, like REITs, semi-annually or annually.
What is a dividend trap?
A dividend trap is a high-yielding stock that may look attractive initially but could be financially unstable, potentially leading to reduced or eliminated dividends.
What is the payout ratio?
The payout ratio is the percentage of earnings a company pays out as dividends. It's used to evaluate if a company can sustain its dividend payments.
What is the yield on cost?
Yield on cost is the dividend yield based on the original price you paid for the stock, not the current market price.
Can I live off dividends?
In theory, yes. However, it requires a substantial investment portfolio and a strategic selection of stable, high-yielding stocks. The typical portfolio of high-quality dividend stocks typically pays 2% per year.
Why do some stocks have extremely high yields?
High yields occur if a company's stock price declines dramatically, artificially inflating the yield. If a $10 stock pays a dividend of 50 cents, it is a 5% yield. If the stock price falls to $1, the yield will be 50%. An extremely high yield can be a sign that the company will cut its dividend in the future.
What are preferred dividends?
Preferred dividends are paid to the holders of a company's preferred stock before any dividends are paid to holders of common stock.
Can high-yield dividend stocks help during market volatility?
Yes, they can provide steady income during turbulent market conditions, which can offset potential losses from a drop in stock prices. Conversely, high yields indicate risk; investors should consider factors like cash flow and company performance.
What are some risks associated with investing in high-yield dividend stocks?
The main risk associated with high-yield dividend stocks is the possibility of a cut in the company's dividend payout. Furthermore, certain companies may have difficulty maintaining their dividends if their earnings are insufficient to cover them.
How does a company's debt level affect its ability to pay dividends?
High debt levels can strain a company's finances, potentially making it difficult to maintain dividend payments. Companies with higher debt levels may need to reduce or eliminate dividends to stay financially sound. High debt could also lead to lower credit ratings from rating agencies, which can limit a company's access to financing and increase its cost of borrowing.
Important Dividend Screening Criteria Explained
Dividend Yield. The percentage of the price per share a company pays out to its shareholders as dividends annually calculated by dividing the forecasted 12-month dividend payout by the current price.
Payout Ratio. The dividend payout ratio is Dividend Per Share as a percent of Diluted Earnings Per Share based on the TTM from the most recent quarterly report. It can measure the chance of a dividend increase or cut. For example, a company with a small payout ratio has room to increase its dividends.
Free Cash Flow Payout Ratio. This alternative dividend payout ratio aims to be more accurate by excluding accounting earnings and actual cash generation. It is calculated as Dividend Per Share as a percent of Free Cash Flow per Share, and values less than 70 are considered best. The Forward Dividend Yield and the TTM Free Cash Flow are used. (Exclusive to StockRover)
Dividend Coverage Ratio. The dividend coverage ratio is calculated by dividing the stock’s annual earnings per share by the annual dividend. This indicates that a company can cover its dividend payments with its profits. Should be positive > 1.5
Dividends Cash Flow. The cost of payments made by this company to its common shareholders, preferred shareholders, and Noncontrolling interests over the trailing twelve-month period.
Dividend 1‑Year Chg (%). The percentage between the last paid dividend and the corresponding dividend one year earlier.
Dividend 3‑Year Avg (%). The average annual compound dividend growth for the last three years is based on the last paid and the corresponding dividend three years earlier.
Dividend 5‑Year Avg (%). The average annual compound dividend growth for the last five years is based on the last paid dividend and the corresponding dividend five years earlier.
Dividend 10‑Year Avg (%). The average annual compound dividend growth for the last ten years is based on the last paid and the corresponding dividend ten years earlier. (Exclusive to StockRover)
Expected Dividend Growth Rate. The growth rate between the forward dividend per share and the trailing dividend per share. This is a great indication of company and analyst expectations of future dividend growth.
Forward Dividend Growth is the percentage change in dividend per share implied by the forward yield vs. the trailing 12-month yield. It is highest when a company has just announced a dividend increase.
Dividend Yield Industry Decile. The decile rank of the company’s Dividend Yield among all companies in the same industry. Companies with the highest yields score a 1, and the lowest-yielding companies score a 10. Great for comparing companies in the same industry. (Exclusive to StockRover)
Dividend Yield Sector Decile. The decile rank of the company’s Dividend Yield among the yields of all companies in the same sector. Companies with the highest yields score a 1, and the lowest-yielding companies score a 10. (Exclusive to StockRover)
Dividend Per Share. The dollar amount paid per share in dividends each year is based on the trailing twelve months’ dividend paid, updated by the forward forecast if available. It is useful to compare against the current stock price to assess your income per share.
Next Dividend Payment Per Share. The dollar amount of the next dividend payment, quarterly or yearly.
Expected Yearly Dividends. The expected annual dividend income is calculated as Quantity times Dividend Per Share.
Percent of Expected Yearly Dividends. The percent of the portfolio’s expected annual dividend income from this holding. It is useful to have in your portfolio view to predict future income totals. (Exclusive to StockRover)
Dividend Frequency. The number of times per year a dividend will be paid.
Dividend Payment Date. The payment date of the last dividend.
Dividend Record Date. A company establishes the cut-off date to determine which shareholders can receive dividends or distribution. If you are considering buying stock for a dividend, purchase it before this date.
Ex‑Dividend Date. The first date following the declaration of a dividend on which the stock buyer is not entitled to receive the next dividend payment.
Dividends Rating Score. The Stock Rover dividends percentile rating of a stock, where a score of 99 is best. The proprietary algorithm compares a company to its peers and considers the consistency of key dividend metrics and their direction of change. (Exclusive to StockRover)
Consecutive Dividend Growth Years. The number of years in a row that the dividend per share has increased. This provides the ability to sort potential purchases on their ability to deliver consistent dividend growth. (Exclusive to StockRover)