Our regularly updated S&P 500 companies list shows you what companies are currently in the S&P 500 index and provides the ticker symbol, market capitalization, and PE Ratio.
S&P 500 Companies
The S&P 500 index includes the USA’s largest and most successful companies. The index is managed by the Standard & Poor rating agency.
A company becomes a constituent of the S&P 500 when its market capitalization (total outstanding shares X share price) is ranked in the top 500.

What is the S&P 500 Index?
The S&P 500 Index is widely regarded as the best representation of the US stock market and is tracked by many professional and amateur investors. It tracks the performance of 500 of the largest companies in the US based on their market capitalization. These stocks are weighted proportionally to their size, so large companies have more influence over the index than smaller ones.
Try TradingView, Our Recommended Tool for International Traders
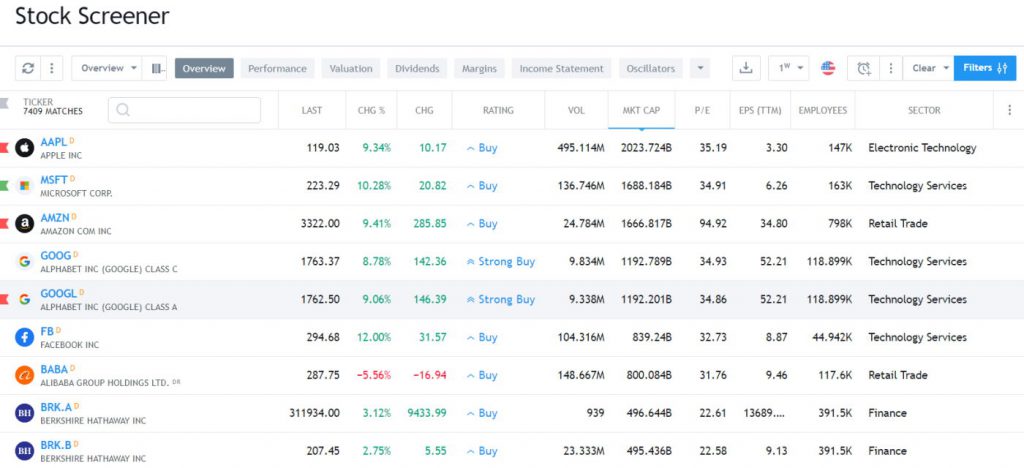
Global Community, Charts, Screening, Analysis, Broker Integration, Financial Metrics, Ratios & Analysis with TradingView

Global Financial Analysis for Free on TradingView
The S&P 500 Index lists the largest 500 companies (by market capitalization) traded on the U.S. Stock Exchanges. Hence, it includes companies traded on the Nasdaq and the New York Stock Exchange (NYSE). It is typically used as the benchmark against which all US investments are measured. The term beat the market usually refers to an investment that returns better results than the S&P 500.
S&P 500 Companies List By Sector, Market Cap & PE Ratio
The PE Ratio is only useful when comparing companies in the same industrial sector. This is why you can easily find stocks that could be potentially undervalued by listing companies by Sector, Market Capitalization, and PE ratio. Knowing what companies are in which sector helps you formalize a stock sector rotation strategy.
If no PE Ratio is listed, it means the company is not currently making a profit.
Get the Free Interactive S&P 500 Companies List on TradingView Now
| Ticker | Description | Sector | Market Capitalization $ | PE Ratio |
| LVS | Las Vegas Sands Corp. | Consumer Services | 40,775,610,288 | 735.7 |
| CRM | Salesforce, Inc. | Technology Services | 199,504,416,416 | 539.3 |
| TAP | Molson Coors Beverage Company | Consumer Non-Durables | 13,659,777,672 | 362.2 |
| WELL | Welltower Inc. | Finance | 42,426,850,696 | 332.5 |
| PANW | Palo Alto Networks, Inc. | Technology Services | 64,134,694,722 | 329.9 |
| PODD | Insulet Corporation | Health Technology | 14,320,659,040 | 228.8 |
| NVDA | NVIDIA Corporation | Electronic Technology | 1,069,485,293,976 | 225.0 |
| VTR | Ventas, Inc. | Finance | 50,551,953,047 | 221.1 |
| CTLT | Catalent, Inc. | Health Technology | 7,996,854,015 | 195.8 |
| STE | STERIS plc (Ireland) | Health Technology | 22,114,192,898 | 185.4 |
| AXON | Axon Enterprise, Inc. | Electronic Technology | 14,959,474,854 | 149.1 |
| CLX | Clorox Company (The) | Consumer Non-Durables | 19,050,628,146 | 128.4 |
| FSLR | First Solar, Inc. | Electronic Technology | 19,433,698,483 | 125.0 |
| DXCM | DexCom, Inc. | Health Technology | 41,133,802,998 | 123.7 |
| AMZN | Amazon.com, Inc. | Retail Trade | 1,366,884,251,763 | 105.9 |
| TYL | Tyler Technologies, Inc. | Technology Services | 15,660,322,516 | 96.3 |
| DLR | Digital Realty Trust, Inc. | Finance | 36,885,126,470 | 94.7 |
| MRK | Merck & Company, Inc. | Health Technology | 277,097,314,775 | 89.9 |
| CAH | Cardinal Health, Inc. | Distribution Services | 21,521,017,385 | 86.7 |
| EQIX | Equinix, Inc. | Finance | 70,532,986,440 | 86.5 |
| ALGN | Align Technology, Inc. | Health Technology | 26,814,348,905 | 86.2 |
| AMT | American Tower Corporation (REIT) | Finance | 82,187,878,166 | 85.3 |
| BSX | Boston Scientific Corporation | Distribution Services | 73,489,363,770 | 84.4 |
| NWS | News Corporation | Consumer Services | 11,952,807,061 | 82.4 |
| CSGP | CoStar Group, Inc. | Technology Services | 31,968,671,983 | 82.4 |
| NWSA | News Corporation | Consumer Services | 11,941,302,916 | 80.7 |
| LYV | Live Nation Entertainment, Inc. | Consumer Services | 19,422,461,727 | 79.7 |
| NOW | ServiceNow, Inc. | Technology Services | 110,628,454,634 | 77.9 |
| LLY | Eli Lilly and Company | Health Technology | 518,723,331,656 | 77.1 |
| ISRG | Intuitive Surgical, Inc. | Health Technology | 100,469,864,749 | 71.8 |
| DIS | Walt Disney Company (The) | Consumer Services | 157,075,139,070 | 69.8 |
| VRSK | Verisk Analytics, Inc. | Technology Services | 33,492,553,797 | 69.8 |
| CDNS | Cadence Design Systems, Inc. | Technology Services | 59,943,285,720 | 67.8 |
| VFC | VF Corporation | Consumer Non-Durables | 7,781,256,556 | 66.5 |
| IBM | International Business Machines Corporation | Technology Services | 128,825,393,714 | 65.6 |
| INVH | Invitation Homes Inc. | Finance | 20,512,773,371 | 65.0 |
| SNPS | Synopsys, Inc. | Technology Services | 64,823,017,177 | 63.9 |
| COO | The Cooper Companies, Inc. | Health Technology | 18,266,444,058 | 63.5 |
| INTU | Intuit Inc. | Technology Services | 136,097,826,356 | 61.4 |
| TSLA | Tesla, Inc. | Consumer Durables | 683,964,053,782 | 61.1 |
| TSN | Tyson Foods, Inc. | Consumer Non-Durables | 19,041,794,421 | 58.2 |
| WST | West Pharmaceutical Services, Inc. | Health Technology | 28,641,162,474 | 56.5 |
| EL | Estee Lauder Companies, Inc. (The) | Consumer Non-Durables | 56,003,044,623 | 56.2 |
| CPT | Camden Property Trust | Finance | 11,353,978,655 | 55.4 |
| PTC | PTC Inc. | Technology Services | 16,628,330,745 | 54.2 |
| XYL | Xylem Inc. | Producer Manufacturing | 23,952,806,803 | 52.9 |
| SPGI | S&P Global Inc. | Commercial Services | 121,552,406,207 | 52.8 |
| PWR | Quanta Services, Inc. | Industrial Services | 29,485,556,313 | 51.9 |
| MPWR | Monolithic Power Systems, Inc. | Electronic Technology | 23,042,851,851 | 51.7 |
| ADSK | Autodesk, Inc. | Technology Services | 42,676,891,922 | 51.7 |
| CHD | Church & Dwight Company, Inc. | Consumer Non-Durables | 22,904,513,082 | 51.7 |
| PAYC | Paycom Software, Inc. | Technology Services | 17,010,591,901 | 51.7 |
| FICO | Fair Isaac Corporation | Technology Services | 21,032,433,973 | 51.4 |
| IDXX | IDEXX Laboratories, Inc. | Health Technology | 40,155,591,970 | 51.3 |
| ROL | Rollins, Inc. | Consumer Services | 19,865,604,921 | 50.9 |
| DUK | Duke Energy Corporation (Holding Company) | Utilities | 70,288,528,982 | 50.8 |
| ZBH | Zimmer Biomet Holdings, Inc. | Health Technology | 24,904,346,934 | 49.6 |
| BDX | Becton, Dickinson and Company | Health Technology | 79,399,811,792 | 49.6 |
| ANSS | ANSYS, Inc. | Technology Services | 25,394,198,567 | 48.8 |
| ADBE | Adobe Inc. | Technology Services | 231,605,653,875 | 48.5 |
| SBAC | SBA Communications Corporation | Finance | 23,946,080,316 | 47.8 |
| GNRC | Generac Holdings Inc. | Producer Manufacturing | 7,055,196,136 | 47.2 |
| CMG | Chipotle Mexican Grill, Inc. | Consumer Services | 51,015,016,997 | 46.2 |
| PGR | Progressive Corporation (The) | Finance | 78,393,735,374 | 45.9 |
| TDG | Transdigm Group Inc. | Electronic Technology | 47,299,142,061 | 45.7 |
| IRM | Iron Mountain Incorporated (Delaware) | Finance | 17,090,877,940 | 45.6 |
| MSCI | MSCI Inc. | Technology Services | 41,139,536,988 | 45.6 |
| FE | FirstEnergy Corp. | Utilities | 20,738,516,151 | 45.3 |
| EFX | Equifax, Inc. | Commercial Services | 23,581,893,254 | 45.2 |
| TECH | Bio-Techne Corp | Health Technology | 12,317,835,653 | 44.3 |
| CEG | Constellation Energy Corporation | Utilities | 33,693,159,671 | 43.9 |
| GLW | Corning Incorporated | Electronic Technology | 27,423,368,120 | 43.9 |
| ECL | Ecolab Inc. | Process Industries | 51,120,832,419 | 43.7 |
| LHX | L3Harris Technologies, Inc. | Electronic Technology | 34,323,800,660 | 43.3 |
| NFLX | Netflix, Inc. | Technology Services | 179,266,158,431 | 43.0 |
| AJG | Arthur J. Gallagher & Co. | Finance | 47,529,846,652 | 43.0 |
| FTNT | Fortinet, Inc. | Technology Services | 44,889,857,888 | 42.9 |
| MNST | Monster Beverage Corporation | Consumer Non-Durables | 60,085,650,293 | 42.4 |
| O | Realty Income Corporation | Finance | 40,315,835,840 | 42.4 |
| MCO | Moody’s Corporation | Commercial Services | 60,008,170,000 | 42.1 |
| BF.B | Brown Forman Inc | Consumer Non-Durables | 32,777,590,369 | 41.6 |
| CL | Colgate-Palmolive Company | Consumer Non-Durables | 61,629,853,437 | 41.6 |
| ROP | Roper Technologies, Inc. | Technology Services | 51,684,358,159 | 41.5 |
| MGM | MGM Resorts International | Consumer Services | 14,926,825,903 | 41.4 |
| GPN | Global Payments Inc. | Commercial Services | 32,254,843,664 | 41.4 |
| COST | Costco Wholesale Corporation | Retail Trade | 241,489,319,696 | 40.4 |
| INCY | Incyte Corporation | Health Technology | 14,350,575,608 | 39.3 |
| SYK | Stryker Corporation | Health Technology | 105,544,181,735 | 39.3 |
| CTVA | Corteva, Inc. | Process Industries | 36,027,619,693 | 39.2 |
| VMC | Vulcan Materials Company (Holding Company) | Non-Energy Minerals | 28,141,054,023 | 39.0 |
| IR | Ingersoll Rand Inc. | Producer Manufacturing | 26,888,520,479 | 38.7 |
| AOS | A.O. Smith Corporation | Producer Manufacturing | 10,371,810,403 | 38.6 |
| HWM | Howmet Aerospace Inc. | Electronic Technology | 20,107,506,873 | 38.5 |
| ZTS | Zoetis Inc. | Health Technology | 83,579,740,494 | 38.2 |
| TRMB | Trimble Inc. | Technology Services | 13,106,417,733 | 38.1 |
| ORCL | Oracle Corporation | Technology Services | 316,102,599,449 | 38.0 |
| HOLX | Hologic, Inc. | Health Technology | 17,917,512,979 | 37.9 |
| ICE | Intercontinental Exchange Inc. | Finance | 63,734,283,637 | 37.8 |
| CTAS | Cintas Corporation | Consumer Services | 49,389,425,174 | 37.4 |
| MRNA | Moderna, Inc. | Health Technology | 38,675,818,252 | 37.3 |
| LUV | Southwest Airlines Company | Transportation | 19,149,624,084 | 37.2 |
| MKTX | MarketAxess Holdings, Inc. | Finance | 9,351,536,705 | 37.0 |
| IQV | IQVIA Holdings, Inc. | Health Services | 39,184,501,014 | 36.8 |
| MA | Mastercard Incorporated | Commercial Services | 369,364,486,503 | 36.8 |
| EA | Electronic Arts Inc. | Technology Services | 32,065,103,661 | 36.7 |
| TMO | Thermo Fisher Scientific Inc | Health Technology | 205,471,945,947 | 36.4 |
| CPRT | Copart, Inc. | Commercial Services | 41,460,875,531 | 36.3 |
| ABT | Abbott Laboratories | Health Technology | 179,973,982,046 | 35.3 |
| JNJ | Johnson & Johnson | Health Technology | 448,296,231,871 | 34.9 |
| ALK | Alaska Air Group, Inc. | Transportation | 5,441,388,923 | 34.7 |
| ODFL | Old Dominion Freight Line, Inc. | Transportation | 42,995,898,919 | 34.2 |
| AKAM | Akamai Technologies, Inc. | Technology Services | 15,307,872,094 | 34.1 |
| ARE | Alexandria Real Estate Equities, Inc. | Finance | 20,102,417,897 | 34.1 |
| FTV | Fortive Corporation | Electronic Technology | 26,782,014,150 | 33.9 |
| EW | Edwards Lifesciences Corporation | Health Technology | 46,554,232,956 | 33.9 |
| WY | Weyerhaeuser Company | Finance | 23,500,855,113 | 33.9 |
| BR | Broadridge Financial Solutions, Inc. | Technology Services | 21,142,918,055 | 33.8 |
| ANET | Arista Networks, Inc. | Electronic Technology | 55,891,684,799 | 33.3 |
| ATVI | Activision Blizzard, Inc | Technology Services | 71,181,646,046 | 33.1 |
| META | Meta Platforms, Inc. | Technology Services | 728,967,239,293 | 33.0 |
| ENPH | Enphase Energy, Inc. | Electronic Technology | 17,772,560,194 | 33.0 |
| FDS | FactSet Research Systems Inc. | Technology Services | 16,379,991,200 | 32.9 |
| PLD | Prologis, Inc. | Finance | 113,828,796,051 | 32.9 |
| MKC | McCormick & Company, Incorporated | Consumer Non-Durables | 22,897,411,947 | 32.8 |
| LIN | Linde plc | Process Industries | 183,028,485,644 | 32.7 |
| MSFT | Microsoft Corporation | Technology Services | 2,351,371,643,107 | 32.7 |
| NKE | Nike, Inc. | Consumer Non-Durables | 160,367,096,321 | 32.5 |
| ETN | Eaton Corporation, PLC | Producer Manufacturing | 85,645,351,950 | 31.7 |
| HLT | Hilton Worldwide Holdings Inc. | Consumer Services | 39,436,241,542 | 31.6 |
| MSI | Motorola Solutions, Inc. | Electronic Technology | 46,378,007,432 | 31.5 |
| SEDG | SolarEdge Technologies, Inc. | Producer Manufacturing | 9,181,596,018 | 31.5 |
| KIM | Kimco Realty Corporation (HC.) | Finance | 11,746,784,396 | 31.4 |
| A | Agilent Technologies, Inc. | Health Technology | 35,223,566,565 | 31.3 |
| PEP | PepsiCo, Inc. | Consumer Non-Durables | 245,279,121,127 | 31.2 |
| CBRE | CBRE Group Inc | Finance | 25,496,578,260 | 31.2 |
| BKR | Baker Hughes Company | Industrial Services | 35,600,396,505 | 31.1 |
| PRU | Prudential Financial, Inc. | Finance | 33,686,399,336 | 31.0 |
| JKHY | Jack Henry & Associates, Inc. | Technology Services | 11,297,858,295 | 30.9 |
| ABBV | AbbVie Inc. | Health Technology | 265,004,108,705 | 30.8 |
| V | Visa Inc. | Commercial Services | 485,525,515,662 | 30.8 |
| ADP | Automatic Data Processing, Inc. | Technology Services | 103,429,305,077 | 30.6 |
| WMT | Walmart Inc. | Retail Trade | 425,279,432,050 | 30.4 |
| FI | Fiserv, Inc. | Finance | 73,202,554,483 | 30.3 |
| SHW | Sherwin-Williams Company (The) | Process Industries | 69,468,699,540 | 30.0 |
| TER | Teradyne, Inc. | Electronic Technology | 15,564,628,272 | 30.0 |
| HES | Hess Corporation | Energy Minerals | 47,766,412,551 | 29.9 |
| KDP | Keurig Dr Pepper Inc. | Consumer Non-Durables | 47,157,502,166 | 29.9 |
| MTD | Mettler-Toledo International, Inc. | Health Technology | 25,902,812,743 | 29.8 |
| VRSN | VeriSign, Inc. | Technology Services | 20,764,952,544 | 29.8 |
| WAB | Westinghouse Air Brake Technologies Corporation | Producer Manufacturing | 19,946,161,288 | 29.7 |
| DHR | Danaher Corporation | Health Technology | 185,629,109,809 | 29.6 |
| SBUX | Starbucks Corporation | Consumer Services | 111,367,244,022 | 29.6 |
| RSG | Republic Services, Inc. | Industrial Services | 46,272,159,042 | 29.5 |
| FAST | Fastenal Company | Distribution Services | 32,845,933,656 | 29.3 |
| AAPL | Apple Inc. | Electronic Technology | 2,728,017,215,293 | 29.3 |
| CVS | CVS Health Corporation | Retail Trade | 85,810,704,307 | 29.3 |
| APTV | Aptiv PLC | Producer Manufacturing | 27,117,191,257 | 29.1 |
| APD | Air Products and Chemicals, Inc. | Process Industries | 63,272,413,581 | 29.1 |
| EQR | Equity Residential | Finance | 24,167,105,804 | 29.0 |
| CMCSA | Comcast Corporation | Consumer Services | 188,766,086,139 | 29.0 |
| AWK | American Water Works Company, Inc. | Utilities | 27,051,153,636 | 29.0 |
| MDT | Medtronic plc. | Health Technology | 108,454,644,596 | 28.9 |
| AME | AMETEK, Inc. | Producer Manufacturing | 35,633,484,769 | 28.9 |
| MMC | Marsh & McLennan Companies, Inc. | Finance | 93,278,220,336 | 28.8 |
| ESS | Essex Property Trust, Inc. | Finance | 15,176,141,995 | 28.7 |
| UDR | UDR, Inc. | Finance | 12,668,514,888 | 28.7 |
| REG | Regency Centers Corporation | Finance | 10,502,247,044 | 28.7 |
| DPZ | Domino’s Pizza Inc | Consumer Services | 13,295,983,656 | 28.6 |
| WM | Waste Management, Inc. | Industrial Services | 64,351,801,621 | 28.5 |
| KMX | CarMax Inc | Retail Trade | 13,050,712,231 | 28.5 |
| IT | Gartner, Inc. | Technology Services | 25,866,495,836 | 28.4 |
| IEX | IDEX Corporation | Producer Manufacturing | 16,588,516,144 | 28.4 |
| MLM | Martin Marietta Materials, Inc. | Non-Energy Minerals | 26,648,120,683 | 28.3 |
| FFIV | F5, Inc. | Technology Services | 9,211,473,469 | 28.2 |
| MAA | Mid-America Apartment Communities, Inc. | Finance | 16,760,646,235 | 28.1 |
| PAYX | Paychex, Inc. | Technology Services | 43,438,555,136 | 28.0 |
| EIX | Edison International | Utilities | 26,462,257,324 | 27.9 |
| TFX | Teleflex Incorporated | Health Technology | 10,225,964,365 | 27.9 |
| APH | Amphenol Corporation | Electronic Technology | 50,835,765,835 | 27.7 |
| BRO | Brown & Brown, Inc. | Finance | 20,247,139,684 | 27.7 |
| MTCH | Match Group, Inc. | Technology Services | 12,347,052,590 | 27.4 |
| RMD | ResMed Inc. | Health Technology | 24,365,321,134 | 27.2 |
| GOOG | Alphabet Inc. | Technology Services | 1,611,856,497,958 | 27.1 |
| TMUS | T-Mobile US, Inc. | Communications | 160,162,887,737 | 27.1 |
| ACN | Accenture plc | Technology Services | 201,246,616,516 | 27.0 |
| GOOGL | Alphabet Inc. | Technology Services | 1,610,343,852,181 | 27.0 |
| FCX | Freeport-McMoRan, Inc. | Non-Energy Minerals | 55,682,405,984 | 26.8 |
| VRTX | Vertex Pharmaceuticals Incorporated | Health Technology | 88,996,253,919 | 26.7 |
| EPAM | EPAM Systems, Inc. | Technology Services | 13,875,229,380 | 26.6 |
| KMB | Kimberly-Clark Corporation | Consumer Non-Durables | 43,368,862,403 | 26.4 |
| BKNG | Booking Holdings Inc. Common Stock | Consumer Services | 109,161,968,068 | 26.4 |
| OTIS | Otis Worldwide Corporation | Producer Manufacturing | 34,475,407,689 | 26.4 |
| TJX | TJX Companies, Inc. (The) | Retail Trade | 102,879,833,860 | 26.3 |
| AVGO | Broadcom Inc. | Electronic Technology | 340,812,095,959 | 26.1 |
| NDSN | Nordson Corporation | Producer Manufacturing | 13,240,734,933 | 26.1 |
| YUM | Yum! Brands, Inc. | Consumer Services | 36,180,879,085 | 26.1 |
| ORLY | O’Reilly Automotive, Inc. | Retail Trade | 56,522,324,456 | 26.0 |
| PPL | PPL Corporation | Utilities | 18,648,340,336 | 26.0 |
| MCD | McDonald’s Corporation | Consumer Services | 205,321,797,459 | 25.9 |
| PG | Procter & Gamble Company (The) | Consumer Non-Durables | 359,583,481,922 | 25.9 |
| AVY | Avery Dennison Corporation | Process Industries | 14,275,248,552 | 25.5 |
| CCI | Crown Castle Inc. | Finance | 43,276,780,689 | 25.5 |
| CDW | CDW Corporation | Technology Services | 26,849,788,706 | 25.5 |
| AON | Aon plc | Finance | 65,741,012,217 | 25.2 |
| KO | Coca-Cola Company (The) | Consumer Non-Durables | 263,568,843,499 | 25.2 |
| ROST | Ross Stores, Inc. | Retail Trade | 40,442,662,027 | 25.2 |
| HSY | The Hershey Company | Consumer Non-Durables | 44,733,542,105 | 25.2 |
| TDY | Teledyne Technologies Incorporated | Electronic Technology | 19,000,723,618 | 25.1 |
| PPG | PPG Industries, Inc. | Process Industries | 32,861,130,701 | 25.0 |
| ADI | Analog Devices, Inc. | Electronic Technology | 88,903,581,159 | 24.9 |
| CME | CME Group Inc. | Finance | 73,291,701,083 | 24.9 |
| PH | Parker-Hannifin Corporation | Producer Manufacturing | 51,031,053,903 | 24.9 |
| CBOE | Cboe Global Markets, Inc. | Finance | 15,840,189,893 | 24.6 |
| K | Kellogg Company | Consumer Non-Durables | 21,174,142,244 | 24.6 |
| CNP | CenterPoint Energy, Inc (Holding Co) | Utilities | 17,793,079,273 | 24.4 |
| TT | Trane Technologies plc | Producer Manufacturing | 44,982,944,153 | 24.3 |
| MET | MetLife, Inc. | Finance | 46,820,918,533 | 24.2 |
| SO | Southern Company (The) | Utilities | 73,949,967,038 | 24.0 |
| WAT | Waters Corporation | Health Technology | 15,957,788,758 | 23.8 |
| ROK | Rockwell Automation, Inc. | Electronic Technology | 33,486,310,147 | 23.8 |
| MDLZ | Mondelez International, Inc. | Consumer Non-Durables | 96,766,517,287 | 23.6 |
| ITW | Illinois Tool Works Inc. | Producer Manufacturing | 71,297,588,138 | 23.3 |
| JBHT | J.B. Hunt Transport Services, Inc. | Transportation | 19,739,854,678 | 23.3 |
| NDAQ | Nasdaq, Inc. | Finance | 25,450,176,296 | 23.2 |
| POOL | Pool Corporation | Distribution Services | 13,648,272,928 | 23.2 |
| LH | Laboratory Corporation of America Holdings | Health Services | 18,998,497,128 | 23.2 |
| HRL | Hormel Foods Corporation | Consumer Non-Durables | 21,462,877,957 | 23.1 |
| DLTR | Dollar Tree, Inc. | Retail Trade | 31,473,233,922 | 23.1 |
| HON | Honeywell International Inc. | Electronic Technology | 123,881,919,976 | 23.1 |
| J | Jacobs Solutions Inc. | Technology Services | 16,816,288,687 | 23.0 |
| TRGP | Targa Resources, Inc. | Utilities | 18,959,615,960 | 22.9 |
| MAR | Marriott International | Consumer Services | 60,271,239,997 | 22.8 |
| CMS | CMS Energy Corporation | Utilities | 16,608,000,108 | 22.8 |
| RTX | RTX Corporation | Electronic Technology | 124,883,190,494 | 22.7 |
| JNPR | Juniper Networks, Inc. | Technology Services | 9,062,356,138 | 22.5 |
| HSIC | Henry Schein, Inc. | Distribution Services | 9,992,333,348 | 22.4 |
| PNR | Pentair plc. | Producer Manufacturing | 10,996,547,428 | 22.4 |
| UNH | UnitedHealth Group Incorporated | Health Services | 461,707,513,407 | 22.3 |
| DOW | Dow Inc. | Process Industries | 37,980,089,510 | 22.3 |
| HPE | Hewlett Packard Enterprise Company | Electronic Technology | 21,955,806,240 | 22.0 |
| ABC | AmerisourceBergen Corporation | Distribution Services | 36,234,062,305 | 22.0 |
| AIZ | Assurant, Inc. | Finance | 7,460,822,436 | 21.9 |
| TSCO | Tractor Supply Company | Retail Trade | 23,863,741,820 | 21.9 |
| PNW | Pinnacle West Capital Corporation | Utilities | 8,866,680,052 | 21.9 |
| CHRW | C.H. Robinson Worldwide, Inc. | Transportation | 11,059,815,670 | 21.9 |
| ZBRA | Zebra Technologies Corporation | Electronic Technology | 13,963,008,080 | 21.7 |
| BALL | Ball Corporation | Process Industries | 17,192,747,934 | 21.7 |
| REGN | Regeneron Pharmaceuticals, Inc. | Health Technology | 88,178,356,962 | 21.5 |
| LOW | Lowe’s Companies, Inc. | Retail Trade | 128,534,892,552 | 21.4 |
| SLB | Schlumberger N.V. | Industrial Services | 82,471,424,751 | 21.2 |
| CAG | ConAgra Brands, Inc. | Consumer Non-Durables | 14,426,798,781 | 21.2 |
| CARR | Carrier Global Corporation | Producer Manufacturing | 44,720,954,523 | 21.2 |
| FLT | FleetCor Technologies, Inc. | Commercial Services | 19,393,853,060 | 21.1 |
| CRL | Charles River Laboratories International, Inc. | Commercial Services | 10,197,872,196 | 21.1 |
| ON | ON Semiconductor Corporation | Electronic Technology | 39,152,622,117 | 20.8 |
| PEAK | Healthpeak Properties, Inc. | Finance | 11,195,662,015 | 20.8 |
| DVA | DaVita Inc. | Health Services | 9,272,428,253 | 20.8 |
| EXR | Extra Space Storage Inc | Finance | 26,713,801,747 | 20.8 |
| FRT | Federal Realty Investment Trust | Finance | 7,891,495,663 | 20.7 |
| SYY | Sysco Corporation | Transportation | 36,212,584,375 | 20.6 |
| UNP | Union Pacific Corporation | Transportation | 137,286,101,364 | 20.6 |
| KEYS | Keysight Technologies Inc. | Electronic Technology | 23,075,436,555 | 20.5 |
| AEP | American Electric Power Company, Inc. | Utilities | 40,709,208,895 | 20.5 |
| HD | Home Depot, Inc. (The) | Retail Trade | 329,129,972,182 | 20.4 |
| AVB | AvalonBay Communities, Inc. | Finance | 25,423,547,900 | 20.2 |
| GWW | W.W. Grainger, Inc. | Distribution Services | 35,178,118,744 | 20.2 |
| WTW | Willis Towers Watson Public Limited Company | Finance | 20,853,466,852 | 20.2 |
| WEC | WEC Energy Group, Inc. | Utilities | 27,124,217,149 | 20.1 |
| ATO | Atmos Energy Corporation | Utilities | 17,364,171,547 | 20.0 |
| TXN | Texas Instruments Incorporated | Electronic Technology | 151,167,305,708 | 20.0 |
| MOH | Molina Healthcare Inc | Health Services | 18,319,608,038 | 19.9 |
| KLAC | KLA Corporation | Electronic Technology | 65,346,729,935 | 19.8 |
| DRI | Darden Restaurants, Inc. | Consumer Services | 19,154,797,608 | 19.8 |
| JCI | Johnson Controls International plc | Producer Manufacturing | 40,336,176,749 | 19.8 |
| TEL | TE Connectivity Ltd. New Switzerland Registered Shares | Electronic Technology | 40,089,961,794 | 19.7 |
| LRCX | Lam Research Corporation | Producer Manufacturing | 86,522,191,352 | 19.7 |
| GRMN | Garmin Ltd. | Electronic Technology | 19,441,906,966 | 19.6 |
| BLK | BlackRock, Inc. | Finance | 100,070,096,351 | 19.6 |
| DOV | Dover Corporation | Producer Manufacturing | 19,662,063,762 | 19.5 |
| DGX | Quest Diagnostics Incorporated | Health Services | 14,983,373,204 | 19.5 |
| AZO | AutoZone, Inc. | Retail Trade | 44,634,454,686 | 19.4 |
| LNT | Alliant Energy Corporation | Utilities | 12,792,640,463 | 19.3 |
| ES | Eversource Energy (D/B/A) | Utilities | 22,505,561,561 | 19.1 |
| NSC | Norfolk Southern Corporation | Transportation | 48,152,211,047 | 19.1 |
| EXPE | Expedia Group, Inc. | Consumer Services | 15,880,434,951 | 18.9 |
| AEE | Ameren Corporation | Utilities | 21,169,731,270 | 18.9 |
| AMAT | Applied Materials, Inc. | Producer Manufacturing | 119,798,366,106 | 18.8 |
| EXC | Exelon Corporation | Utilities | 39,818,718,370 | 18.8 |
| LDOS | Leidos Holdings, Inc. | Electronic Technology | 13,199,442,297 | 18.7 |
| NXPI | NXP Semiconductors NV. | Electronic Technology | 50,676,169,200 | 18.6 |
| XEL | Xcel Energy Inc. | Utilities | 32,093,691,218 | 18.4 |
| ALLE | Allegion plc | Producer Manufacturing | 9,447,763,156 | 18.4 |
| GD | General Dynamics Corporation | Electronic Technology | 61,276,213,340 | 18.4 |
| ULTA | Ulta Beauty, Inc. | Retail Trade | 22,556,636,549 | 18.4 |
| NI | NiSource Inc | Utilities | 10,926,457,806 | 18.4 |
| MCHP | Microchip Technology Incorporated | Electronic Technology | 43,225,585,100 | 18.4 |
| HUM | Humana Inc. | Health Services | 60,762,631,654 | 18.3 |
| PM | Philip Morris International Inc | Consumer Non-Durables | 146,479,296,866 | 18.3 |
| FMC | FMC Corporation | Process Industries | 11,101,283,966 | 18.1 |
| GPC | Genuine Parts Company | Distribution Services | 21,749,626,175 | 18.1 |
| TGT | Target Corporation | Retail Trade | 60,561,239,513 | 18.0 |
| PCG | Pacific Gas & Electric Co. | Utilities | 34,965,556,809 | 18.0 |
| D | Dominion Energy, Inc. | Utilities | 40,524,914,060 | 18.0 |
| SRE | DBA Sempra | Utilities | 44,501,454,004 | 17.9 |
| CSCO | Cisco Systems, Inc. | Technology Services | 224,291,209,687 | 17.9 |
| SPG | Simon Property Group, Inc. | Finance | 37,348,857,720 | 17.8 |
| AMGN | Amgen Inc. | Health Technology | 140,047,831,256 | 17.7 |
| RVTY | Revvity, Inc. | Health Technology | 14,054,537,712 | 17.6 |
| GILD | Gilead Sciences, Inc. | Health Technology | 94,547,572,998 | 17.5 |
| EBAY | eBay Inc. | Retail Trade | 22,877,444,824 | 17.4 |
| EXPD | Expeditors International of Washington, Inc. | Transportation | 17,130,929,366 | 17.4 |
| ELV | Elevance Health, Inc. | Health Services | 109,053,095,545 | 17.3 |
| TXT | Textron Inc. | Electronic Technology | 14,904,812,353 | 17.3 |
| SCHW | Charles Schwab Corporation (The) | Finance | 108,392,664,416 | 17.3 |
| TRV | The Travelers Companies, Inc. | Finance | 37,196,259,853 | 17.3 |
| EVRG | Evergy, Inc. | Utilities | 12,955,201,859 | 17.2 |
| SWK | Stanley Black & Decker, Inc. | Consumer Durables | 13,747,798,996 | 17.1 |
| CAT | Caterpillar, Inc. | Producer Manufacturing | 139,677,186,754 | 17.0 |
| FDX | FedEx Corporation | Transportation | 66,059,205,171 | 16.9 |
| HII | Huntington Ingalls Industries, Inc. | Electronic Technology | 8,748,547,609 | 16.9 |
| NEE | NextEra Energy, Inc. | Utilities | 137,268,524,235 | 16.8 |
| PYPL | PayPal Holdings, Inc. | Commercial Services | 65,245,385,101 | 16.6 |
| BMY | Bristol-Myers Squibb Company | Health Technology | 129,649,721,909 | 16.5 |
| LMT | Lockheed Martin Corporation | Electronic Technology | 113,339,268,033 | 16.5 |
| DTE | DTE Energy Company | Utilities | 21,770,081,535 | 16.4 |
| CPB | Campbell Soup Company | Consumer Non-Durables | 12,767,276,566 | 16.4 |
| BEN | Franklin Resources, Inc. | Finance | 13,103,157,503 | 16.4 |
| AXP | American Express Company | Finance | 118,002,804,852 | 16.3 |
| GIS | General Mills, Inc. | Consumer Non-Durables | 40,804,707,812 | 16.3 |
| CZR | Caesars Entertainment, Inc. | Consumer Services | 11,216,602,452 | 16.3 |
| SWKS | Skyworks Solutions, Inc. | Electronic Technology | 16,688,402,341 | 16.1 |
| CTSH | Cognizant Technology Solutions Corporation | Technology Services | 34,746,850,091 | 16.1 |
| TROW | T. Rowe Price Group, Inc. | Finance | 24,136,394,198 | 16.1 |
| MAS | Masco Corporation | Producer Manufacturing | 12,773,550,021 | 16.1 |
| WMB | Williams Companies, Inc. (The) | Industrial Services | 42,294,976,607 | 16.0 |
| KMI | Kinder Morgan, Inc. | Industrial Services | 38,836,921,228 | 15.7 |
| MCK | McKesson Corporation | Distribution Services | 56,717,006,874 | 15.7 |
| AMP | Ameriprise Financial, Inc. | Finance | 34,109,837,410 | 15.6 |
| CSX | CSX Corporation | Transportation | 61,935,406,680 | 15.6 |
| PKG | Packaging Corporation of America | Process Industries | 13,215,717,773 | 15.5 |
| DG | Dollar General Corporation | Retail Trade | 35,750,412,530 | 15.4 |
| HST | Host Hotels | Finance | 11,250,473,110 | 15.2 |
| LYB | LyondellBasell Industries NV | Process Industries | 31,573,566,550 | 15.1 |
| BXP | Boston Properties, Inc. | Finance | 9,891,878,595 | 15.0 |
| MS | Morgan Stanley | Finance | 140,659,902,525 | 15.0 |
| SNA | Snap-On Incorporated | Consumer Durables | 14,210,738,458 | 14.9 |
| UPS | United Parcel Service, Inc. | Transportation | 146,457,435,764 | 14.8 |
| RHI | Robert Half Inc. | Commercial Services | 7,993,692,328 | 14.8 |
| RL | Ralph Lauren Corporation | Consumer Non-Durables | 7,536,188,250 | 14.8 |
| ETR | Entergy Corporation | Utilities | 20,210,926,603 | 14.6 |
| HAL | Halliburton Company | Industrial Services | 35,402,723,240 | 14.5 |
| FOXA | Fox Corporation | Consumer Services | 15,882,819,682 | 14.5 |
| QCOM | QUALCOMM Incorporated | Electronic Technology | 122,871,602,043 | 14.4 |
| CB | Chubb Limited | Finance | 82,105,914,715 | 14.4 |
| EMN | Eastman Chemical Company | Process Industries | 9,914,815,964 | 14.3 |
| NOC | Northrop Grumman Corporation | Electronic Technology | 65,084,593,072 | 14.3 |
| BIIB | Biogen Inc. | Health Technology | 37,820,613,606 | 14.2 |
| CHTR | Charter Communications, Inc. | Consumer Services | 62,932,140,344 | 14.1 |
| LKQ | LKQ Corporation | Consumer Durables | 14,017,277,724 | 14.0 |
| GS | Goldman Sachs Group, Inc. (The) | Finance | 107,120,020,932 | 13.9 |
| VICI | VICI Properties Inc. | Finance | 30,068,411,822 | 13.9 |
| NTRS | Northern Trust Corporation | Finance | 15,885,500,213 | 13.8 |
| URI | United Rentals, Inc. | Finance | 30,823,490,807 | 13.7 |
| LW | Lamb Weston Holdings, Inc. | Consumer Non-Durables | 13,814,381,270 | 13.7 |
| KR | Kroger Company (The) | Retail Trade | 34,143,153,872 | 13.7 |
| GE | General Electric Company | Producer Manufacturing | 121,669,808,694 | 13.6 |
| WRB | W.R. Berkley Corporation | Finance | 15,950,992,307 | 13.6 |
| AMCR | Amcor plc | Process Industries | 14,081,716,005 | 13.6 |
| FOX | Fox Corporation | Consumer Services | 15,827,508,133 | 13.5 |
| IPG | Interpublic Group of Companies, Inc. (The) | Commercial Services | 12,452,637,209 | 13.4 |
| UHS | Universal Health Services, Inc. | Health Services | 7,988,758,160 | 13.3 |
| RJF | Raymond James Financial, Inc. | Finance | 21,949,247,064 | 13.3 |
| BBY | Best Buy Co., Inc. | Retail Trade | 17,149,165,469 | 13.3 |
| HCA | HCA Healthcare, Inc. | Health Services | 73,175,649,258 | 13.2 |
| KHC | The Kraft Heinz Company | Consumer Non-Durables | 41,344,396,816 | 13.2 |
| CNC | Centene Corporation | Health Services | 34,492,224,212 | 13.1 |
| GL | Globe Life Inc. | Finance | 10,661,524,446 | 13.1 |
| CMI | Cummins Inc. | Producer Manufacturing | 33,091,600,533 | 13.1 |
| SEE | Sealed Air Corporation | Process Industries | 4,976,373,834 | 13.1 |
| NTAP | NetApp, Inc. | Electronic Technology | 15,876,504,006 | 13.0 |
| NVR | NVR, Inc. | Consumer Durables | 19,843,738,198 | 13.0 |
| ED | Consolidated Edison, Inc. | Utilities | 30,808,574,522 | 12.8 |
| BK | The Bank of New York Mellon Corporation | Finance | 34,282,000,487 | 12.8 |
| ACGL | Arch Capital Group Ltd. | Finance | 28,061,078,428 | 12.6 |
| CI | The Cigna Group | Health Services | 81,693,476,157 | 12.6 |
| PCAR | PACCAR Inc. | Producer Manufacturing | 44,260,681,014 | 12.2 |
| CINF | Cincinnati Financial Corporation | Finance | 16,292,648,435 | 12.1 |
| OKE | ONEOK, Inc. | Industrial Services | 29,367,465,542 | 12.1 |
| PSA | Public Storage | Finance | 47,892,431,291 | 11.8 |
| PFG | Principal Financial Group Inc | Finance | 18,483,939,432 | 11.8 |
| HPQ | HP Inc. | Electronic Technology | 30,623,796,049 | 11.8 |
| OMC | Omnicom Group Inc. | Commercial Services | 15,787,922,806 | 11.8 |
| L | Loews Corporation | Finance | 13,889,077,998 | 11.8 |
| DE | Deere & Company | Producer Manufacturing | 116,403,156,028 | 11.7 |
| F | Ford Motor Company | Consumer Durables | 47,866,618,001 | 11.7 |
| EG | Everest Group, Ltd. | Finance | 15,121,807,278 | 11.6 |
| BBWI | Bath & Body Works, Inc. | Retail Trade | 8,359,850,871 | 11.6 |
| HIG | Hartford Financial Services Group, Inc. (The) | Finance | 21,963,744,975 | 11.5 |
| COP | ConocoPhillips | Energy Minerals | 140,453,676,582 | 11.3 |
| MO | Altria Group, Inc. | Consumer Non-Durables | 76,148,513,926 | 11.3 |
| ADM | Archer-Daniels-Midland Company | Process Industries | 44,405,297,970 | 11.1 |
| PEG | Public Service Enterprise Group Incorporated | Utilities | 30,355,935,039 | 10.9 |
| IVZ | Invesco Ltd | Finance | 6,836,977,250 | 10.9 |
| OXY | Occidental Petroleum Corporation | Energy Minerals | 56,681,568,220 | 10.9 |
| WFC | Wells Fargo & Company | Finance | 155,498,290,602 | 10.6 |
| AAP | Advance Auto Parts Inc. | Retail Trade | 4,150,964,094 | 10.4 |
| USB | U.S. Bancorp | Finance | 56,474,449,436 | 10.2 |
| CVX | Chevron Corporation | Energy Minerals | 306,932,521,814 | 10.2 |
| PXD | Pioneer Natural Resources Company | Energy Minerals | 55,454,957,524 | 10.1 |
| CE | Celanese Corporation | Process Industries | 12,811,907,064 | 10.1 |
| AFL | AFLAC Incorporated | Finance | 44,465,578,484 | 10.0 |
| BWA | BorgWarner Inc. | Producer Manufacturing | 9,317,898,137 | 9.8 |
| AIG | American International Group, Inc. New | Finance | 41,254,582,631 | 9.8 |
| GEN | Gen Digital Inc. | Technology Services | 13,025,375,345 | 9.8 |
| PFE | Pfizer, Inc. | Health Technology | 206,980,864,752 | 9.8 |
| JPM | JP Morgan Chase & Co. | Finance | 432,919,527,223 | 9.6 |
| APA | APA Corporation | Energy Minerals | 13,587,276,256 | 9.5 |
| STT | State Street Corporation | Finance | 21,651,610,699 | 9.2 |
| TPR | Tapestry, Inc. | Retail Trade | 4,017,225,400 | 8.9 |
| DAL | Delta Air Lines, Inc. | Transportation | 26,695,428,470 | 8.9 |
| BRK.B | Berkshire Hathaway Inc. New | Finance | 768,891,898,463 | 8.9 |
| EOG | EOG Resources, Inc. | Energy Minerals | 76,060,734,193 | 8.8 |
| XOM | Exxon Mobil Corporation | Energy Minerals | 440,511,349,736 | 8.8 |
| BG | Bunge Limited Bunge Limited | Process Industries | 16,951,788,665 | 8.7 |
| PNC | PNC Financial Services Group, Inc. (The) | Finance | 49,064,967,725 | 8.4 |
| BAC | Bank of America Corporation | Finance | 231,318,896,391 | 8.4 |
| DHI | D.R. Horton, Inc. | Consumer Durables | 39,685,570,607 | 8.3 |
| MRO | Marathon Oil Corporation | Energy Minerals | 15,984,085,071 | 8.3 |
| RF | Regions Financial Corporation | Finance | 18,335,895,562 | 8.3 |
| IP | International Paper Company | Process Industries | 11,940,429,299 | 8.1 |
| COF | Capital One Financial Corporation | Finance | 40,066,608,402 | 8.0 |
| LEN | Lennar Corporation | Consumer Durables | 33,253,127,551 | 8.0 |
| DD | DuPont de Nemours, Inc. | Process Industries | 34,613,202,897 | 7.8 |
| NUE | Nucor Corporation | Non-Energy Minerals | 41,869,944,440 | 7.8 |
| FANG | Diamondback Energy, Inc. | Energy Minerals | 26,472,277,971 | 7.7 |
| OGN | Organon & Co. | Health Technology | 5,747,731,853 | 7.6 |
| MTB | M&T Bank Corporation | Finance | 21,189,871,113 | 7.6 |
| VTRS | Viatris Inc. | Health Technology | 13,506,735,802 | 7.4 |
| FITB | Fifth Third Bancorp | Finance | 17,423,942,985 | 7.3 |
| KEY | KeyCorp | Finance | 10,136,001,927 | 7.2 |
| HBAN | Huntington Bancshares Incorporated | Finance | 16,129,408,764 | 7.2 |
| CTRA | Coterra Energy Inc. | Energy Minerals | 20,975,165,115 | 7.0 |
| DVN | Devon Energy Corporation | Energy Minerals | 32,028,594,507 | 6.8 |
| C | Citigroup, Inc. | Finance | 81,360,929,490 | 6.7 |
| TFC | Truist Financial Corporation | Finance | 38,334,266,994 | 6.6 |
| VZ | Verizon Communications Inc. | Communications | 139,490,054,291 | 6.6 |
| PHM | PulteGroup, Inc. | Consumer Durables | 17,402,024,374 | 6.6 |
| CF | CF Industries Holdings, Inc. | Process Industries | 15,252,509,998 | 6.5 |
| DFS | Discover Financial Services | Finance | 23,330,145,444 | 6.5 |
| CFG | Citizens Financial Group, Inc. | Finance | 13,087,278,227 | 6.3 |
| MOS | Mosaic Company (The) | Process Industries | 13,128,383,057 | 6.2 |
| SYF | Synchrony Financial | Finance | 13,871,133,172 | 6.1 |
| STLD | Steel Dynamics, Inc. | Non-Energy Minerals | 17,432,416,419 | 6.1 |
| ZION | Zions Bancorporation N.A. | Finance | 5,145,080,633 | 6.1 |
| UAL | United Airlines Holdings, Inc. | Transportation | 16,103,803,158 | 6.1 |
| ALB | Albemarle Corporation | Process Industries | 21,520,223,515 | 5.5 |
| MPC | Marathon Petroleum Corporation | Energy Minerals | 57,825,449,488 | 5.2 |
| PSX | Phillips 66 | Energy Minerals | 50,869,691,865 | 5.0 |
| CMA | Comerica Incorporated | Finance | 6,229,076,130 | 4.9 |
| EQT | EQT Corporation | Energy Minerals | 15,721,259,481 | 4.9 |
| GM | General Motors Company | Consumer Durables | 45,569,980,121 | 4.6 |
| VLO | Valero Energy Corporation | Energy Minerals | 47,171,490,774 | 4.6 |
| AAL | American Airlines Group, Inc. | Transportation | 9,826,571,023 | 4.1 |
| AMD | Advanced Micro Devices, Inc. | Electronic Technology | 170,372,551,712 | |
| INTC | Intel Corporation | Electronic Technology | 137,157,007,708 | |
| BA | Boeing Company (The) | Electronic Technology | 136,716,081,029 | |
| T | AT&T Inc. | Communications | 100,443,451,641 | |
| MU | Micron Technology, Inc. | Electronic Technology | 69,650,232,522 | |
| MMM | 3M Company | Producer Manufacturing | 55,204,764,744 | |
| EMR | Emerson Electric Company | Electronic Technology | 54,743,986,919 | |
| STZ | Constellation Brands, Inc. | Consumer Non-Durables | 47,126,533,141 | |
| FIS | Fidelity National Information Services, Inc. | Technology Services | 32,816,665,687 | |
| WBD | Warner Bros. Discovery, Inc. – Series A | Consumer Services | 31,149,774,743 | |
| GEHC | GE HealthCare Technologies Inc. | Health Technology | 31,092,740,873 | |
| NEM | Newmont Corporation | Non-Energy Minerals | 30,358,778,395 | |
| ALL | Allstate Corporation (The) | Finance | 27,776,518,622 | |
| ILMN | Illumina, Inc. | Health Technology | 26,470,927,558 | |
| RCL | Royal Caribbean Cruises Ltd. | Consumer Services | 25,412,398,028 | |
| TTWO | Take-Two Interactive Software, Inc. | Technology Services | 23,344,937,234 | |
| WBA | Walgreens Boots Alliance, Inc. | Health Technology | 22,910,957,788 | |
| BAX | Baxter International Inc. | Health Technology | 21,162,657,247 | |
| CCL | Carnival Corporation | Consumer Services | 19,539,465,362 | |
| IFF | International Flavors & Fragrances, Inc. | Consumer Non-Durables | 16,257,038,604 | |
| SJM | J.M. Smucker Company (The) New | Consumer Non-Durables | 14,495,721,164 | |
| STX | Seagate Technology Holdings PLC | Electronic Technology | 13,345,754,687 | |
| WDC | Western Digital Corporation | Electronic Technology | 12,714,314,114 | |
| AES | The AES Corporation | Utilities | 12,060,019,390 | |
| BIO | Bio-Rad Laboratories, Inc. | Health Technology | 11,078,910,391 | |
| CDAY | Ceridian HCM Holding Inc. | Technology Services | 10,871,092,807 | |
| WYNN | Wynn Resorts, Limited | Consumer Services | 10,696,343,017 | |
| PARA | Paramount Global | Consumer Services | 9,777,476,050 | |
| QRVO | Qorvo, Inc. | Electronic Technology | 9,689,217,753 | |
| ETSY | Etsy, Inc. | Retail Trade | 9,075,957,865 | |
| HAS | Hasbro, Inc. | Consumer Durables | 8,846,118,248 | |
| NRG | NRG Energy, Inc. | Utilities | 8,351,330,487 | |
| WRK | Westrock Company | Process Industries | 8,229,130,931 | |
| XRAY | DENTSPLY SIRONA Inc. | Health Technology | 7,897,006,636 | |
| WHR | Whirlpool Corporation | Consumer Durables | 7,408,622,278 | |
| NCLH | Norwegian Cruise Line Holdings Ltd. | Consumer Services | 7,096,065,671 | |
| MHK | Mohawk Industries, Inc. | Non-Energy Minerals | 6,216,015,268 | |
| LNC | Lincoln National Corporation | Finance | 4,368,181,590 | |
| NWL | Newell Brands Inc. | Producer Manufacturing | 4,365,668,193 | |
| DXC | DXC Technology Company | Technology Services | 4,154,780,819 |
Data: TradingView 2024
Get this S&P 500 List Live at TradingView
TradingView 4.8/5⭐ : The Best Trading Platform I’ve Tested in 20+ Years
With lightning-fast charts, powerful pattern recognition, smart screening, backtesting, and a global community of 20+ million traders — it’s a powerful edge in today’s markets.

If you want one platform that gives you an edge, this is it.
How to Get This S&P 500 List in Excel
- Drag Your Mouse Over the Table
- Right Click -> Select Copy
- Open Excel
- Right Click the First Cell A1 -> Click Paste
Our Other S&P 500 & Nasdaq 100 Companies Lists
- S&P 500 Companies by #Employees
- S&P 500 Companies Listed Alphabetically
- NASDAQ 100 Companies List (Sorted By Employees)
- NASDAQ 100 Companies List (Sorted By Sector & Market Cap)
- NASDAQ 100 Index Companies List by Market Capitalization
Related Articles
- Learn more about the best-performing stock sectors over the last 10 years.
- Learn about Stock Sector Rotation Strategies.
Beat The Market, Avoid Crashes & Lower Your Risks
Nobody wants to see their hard-earned money disappear in a stock market crash.
Over the past century, the US stock market has had 6 major crashes that have caused investors to lose trillions of dollars.

The MOSES Index ETF Investing Strategy will help you minimize the impact of major stock market crashes. MOSES will alert you before the next crash happens so you can protect your portfolio. You will also know when the bear market is over and the new rally begins so you can start investing again.
MOSES Helps You Secure & Grow Your Biggest Investments
★ 3 Index ETF Strategies ★
★ Outperforms the NASDAQ 100, S&P500 & Russell 3000 ★
★ Beats the DAX, CAC40 & EURO STOXX Indices ★
★ Buy & Sell Signals Generated ★
MOSES Helps You Sleep Better At Night Knowing You Are Prepared For Future Disasters