The debt-to-EBITDA ratio assesses a company’s ability to pay off its debt.
It compares a company’s total debt to earnings before interest, taxes, depreciation, and amortization (EBITDA).
This ratio is a barometer for a company’s financial health, indicating how many years it would take to pay back the debt if EBITDA and debt levels remained constant.
Investors and creditors rely on this measurement to evaluate the risk of lending to or investing in a company.
Key Takeaways
- The Debt to EBITDA ratio is critical for evaluating a company’s ability to pay down debt.
- Calculating the ratio helps determine a company’s leverage and financial health.
- Industry benchmarks are essential for interpreting the ratio’s significance.

Calculating the Debt to EBITDA ratio involves dividing a company’s total debt by its EBITDA. The result clearly indicates the company’s over-leverage and financial stability, revealing the potential risks of increased borrowing costs.
The ratio varies by industry; hence, it is important to compare it against industry benchmarks. A high ratio suggests that a company may have too much debt compared to its earnings, which could hinder its ability to secure new loans or meet financial obligations in challenging economic times.
☆ Debt-to-EBITDA Ratio Calculator ☆
Understanding Debt to EBITDA Ratio
The debt-to-EBITDA ratio is an essential metric for assessing a company’s financial leverage and ability to repay debt. It gives investors and analysts insights into a company’s financial health relative to its debt obligations.
Definition and Significance
Debt to EBITDA Ratio is a financial measurement that compares a company’s total debt to its earnings before interest, taxes, depreciation, and amortization (EBITDA). This ratio is significant because it illustrates how many years it would take for a company to pay back its debt if EBITDA is fixed and used solely for debt repayment. It is frequently used by creditors and investors to gauge a company’s ability to service its debt and to evaluate financial risk.
Components of the Ratio
The components of the Debt to EBITDA ratio include:
- Debt: This encompasses both the company’s short-term and long-term financial obligations.
- EBITDA: It represents the company’s earnings before subtracting interest, taxes, depreciation, and amortization. EBITDA offers an approximation of the company’s operational profitability.
The calculation: Debt-to-EBITDA Ratio = Total Debt / EBITDA
Understanding these components helps evaluate whether a company can comfortably sustain its debt and potentially handle additional loans.

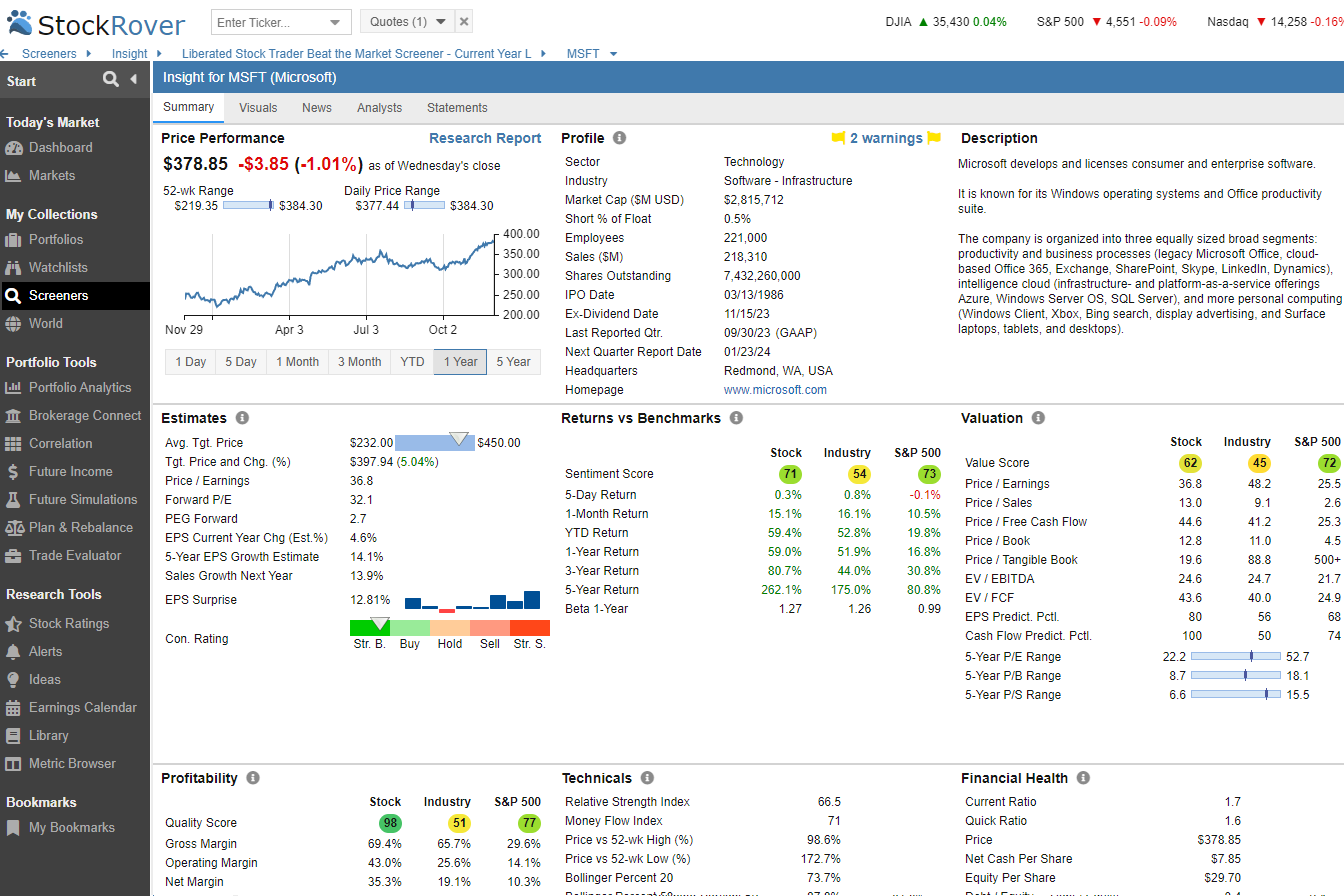
Try Powerful Financial Analysis & Research with Stock Rover
Calculating Debt to EBITDA
This section details the specific methodology for calculating the Debt to EBITDA ratio and interpreting its financial implications.
The Formula for Debt to EBITDA Ratio
The Debt to EBITDA Ratio is calculated by dividing a company’s total debt by its earnings before interest, taxes, depreciation, and amortization (EBITDA). It measures the company’s ability to pay off its incurred debt.
Formula:
Debt to EBITDA Ratio = Total Debt / EBITDA
Total debt refers to the sum of both short-term debt and long-term debt. Short-term debts are financial obligations due within one year, while long-term debts are due beyond one year.
Interpreting the Results
The ratio’s outcome serves as an indicator of financial health. A lower ratio suggests that a company can cover its debts more easily, signaling strength and stability, while a higher ratio may indicate potential financial stress.
For more detailed insights, analysts often look at the net debt-to-EBITDA ratio, which is the ratio of a company’s net debt (total debt minus cash and cash equivalents) over its EBITDA. This provides a clearer picture of debt management as it considers available cash reserves.
Applications in Financial Analysis
The debt-to-EBITDA ratio is a vital metric in financial analysis, serving dual purposes. It acts as a barometer for creditworthiness from a lending perspective and serves as a leverage indicator for investment decisions.
Debt to EBITDA in Credit Analysis
Credit rating agencies use the debt-to-EBITDA ratio to assess a company’s debt repayment ability. A lower ratio suggests a company has less debt in relation to its earnings, highlighting a stronger liquidity stance. This can translate into more favorable borrowing terms and a higher credit rating. For instance, when performing financial modeling, it’s crucial to consider this ratio, as it reflects how many years it would take for a company to pay back its debt if net debt and EBITDA are held constant.
Leverage Ratio for Investors
For investors, the ratio serves as a gauge of financial leverage. They scrutinize a company’s debt-to-EBITDA to determine if it is assuming too much debt relative to its earnings capacity. While a higher ratio could indicate potential issues with debt repayment, it may also signal that a company is strategically utilizing leverage to fuel growth. Investors often compare leverage ratios across similar companies to gain industry insights and inform their investment strategies. It is a fundamental component in evaluating investment risk and return potential.
Example: Net Debt to EBITDA Ratio
Here is a practical example of the net debt-to-EBITDA ratio using two fictitious companies: Alpha Tech and Beta Innovations.
| Net Debt-to-EBITDA | Alpha Tech | Beta Innovations |
|---|---|---|
| Net debt (in $ million) | 500 | 800 |
| EBITDA (in $ million) | 250 | 300 |
| Net Debt-to-EBITDA Ratio | 2.0 | 2.67 |
The Net Debt-to-EBITDA ratio is calculated as follows: Net Debt-to-EBITDA Ratio = Net Debt / EBITDA.
So for Alpha Tech, the Net Debt-to-EBITDA ratio is 500/250 = 2.0, and for Beta Innovations, the Net Debt-to-EBITDA ratio is 800/300 = 2.67
In our example, Alpha Tech has a lower net debt-to-EBITDA ratio than Beta Innovations. This means Alpha Tech is better positioned to pay off its debt using its earnings before interest, taxes, depreciation, and amortization. On the other hand, Beta Innovations has a higher ratio, indicating it’s more leveraged and may have trouble paying off its debt.
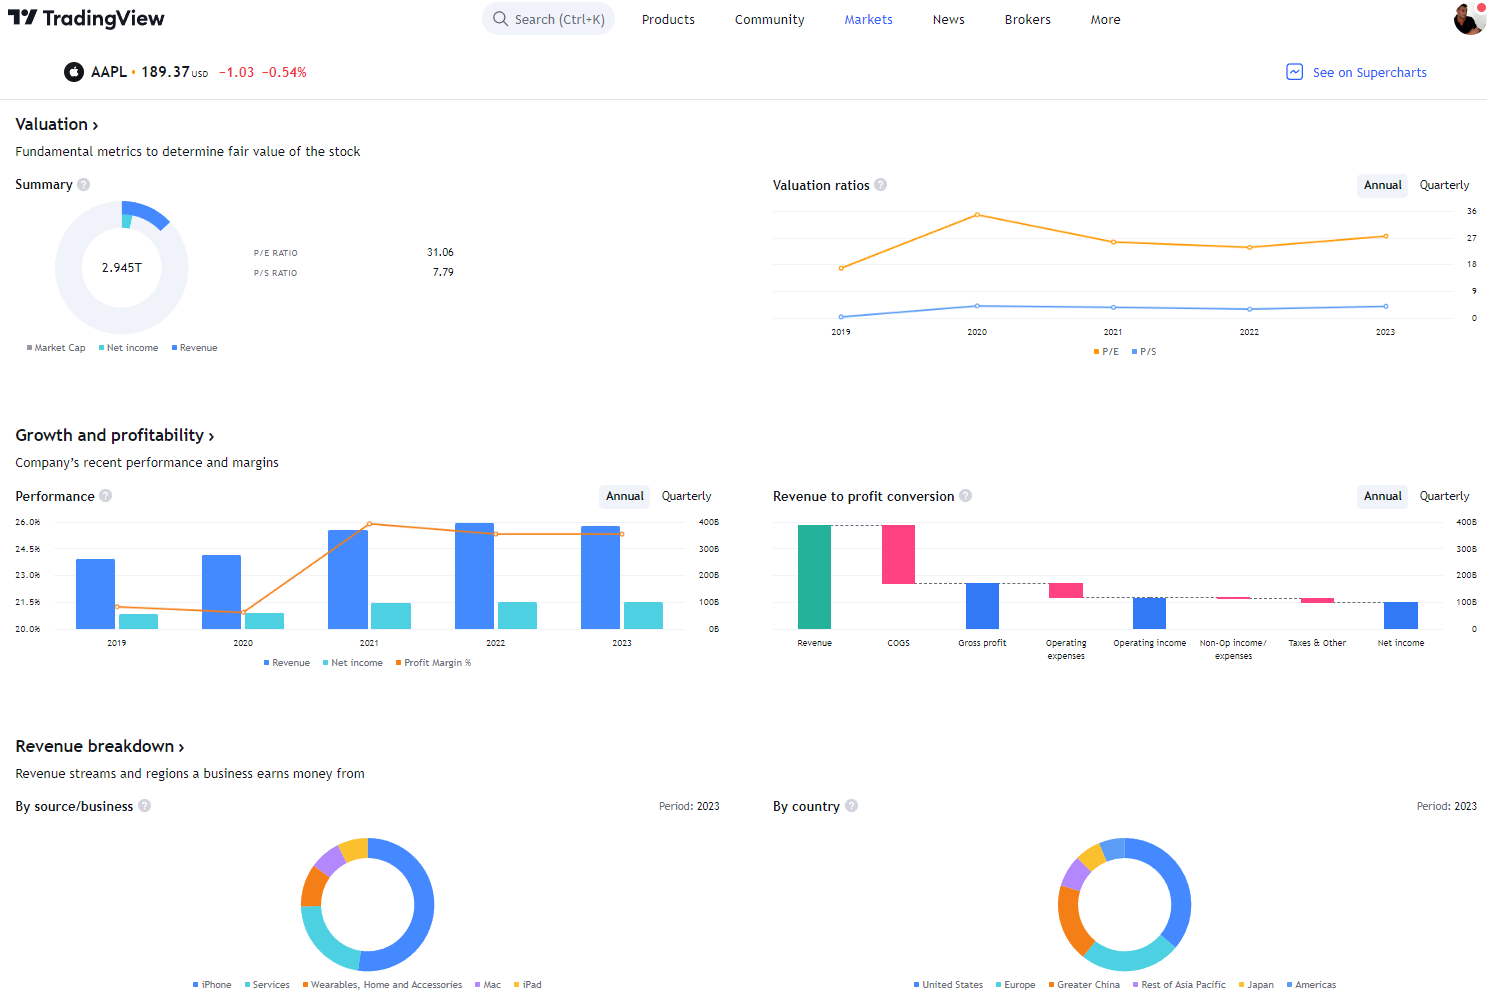
Try TradingView, Our Recommended Tool for International Traders
Global Community, Charts, Screening, Analysis & Broker Integration

Global Financial Analysis for Free on TradingView
Industry Benchmarks and Limitations
Evaluating the Net Debt to EBITDA ratio provides insight into a company’s financial health by illustrating how many years it would take to pay off debt if net debt and EBITDA remain constant. Benchmarks vary significantly across industries due to capital structure differences and operating performance.
Comparing Across Industries
REIT – Office and REIT – Healthcare Facilities typically exhibit higher average Net Debt to EBITDA ratios with values of 8.74 and 6.86, respectively. These figures demonstrate the capital-intensive nature of real estate investments. In stark contrast, industries such as Insurance – Reinsurance and Computer Hardware maintain negative average ratios, suggesting greater liquidity and lower reliance on debt funding.
Industries involving large ongoing investments in infrastructure, like oil and gas or telecommunication, also tend to report higher ratios, reflecting their significant initial capital outlays and subsequent debt levels. Industry benchmarks thus serve as vital tools for comparing companies within sectors, revealing norms and expectations regarding leverage and operating performance.
Understanding the Limitations
While the rule of thumb suggests a ratio of less than 3 implies manageable debt levels, and above 4 or 5 could signal excessive debt, these figures must be interpreted cautiously. The net Debt to EBITDA ratio’s limitations stem from its inability to adequately account for sector-specific financial norms or the volatility of earnings and spending in capital-intensive industries.
Moreover, the ratio does not directly measure an entity’s ability to service its debt from its current cash flow, diminishing its utility in evaluating short-term liquidity. Such limitations advocate for a comprehensive analysis that includes a multitude of financial metrics to assess a company’s financial standing accurately.
Case Studies and Real-World Examples
When assessing a corporation’s financial health, the debt-to-EBITDA ratio serves as a pivotal indicator for creditors and investors alike. It integrates elements from the income statement and balance sheet to determine how many years a company would require to pay off its debt, assuming net debt and EBITDA remain constant.
Example 1: Technology Industry Merger
In a high-profile merger, the acquiring company showcased a debt-to-EBITDA ratio of 1.5x, signaling strong operational efficiency and an ability to service its debt. The company’s balance sheet reflected stable working capital, fortifying creditor confidence.
| Company | Pre-Merger Debt/EBITDA Ratio |
|---|---|
| Acquirer | 1.5x |
| Acquiree | 3.2x |
Example 2: Retail Chain Expansion
A national retail chain planning to expand utilized its low debt-to-EBITDA ratio as a testament to its financial robustness during investor briefings. Pertinent to the retail industry, where cash flow is king, this practical example demonstrates how their earnings can comfortably cover debt obligations.
| Industry | Average Debt/EBITDA Ratio |
|---|---|
| Retail Chain | 2.0x |
Analysis of S&P 500 Data
A sector-wise comparison within the S&P 500 showed that industries with capital-intensive businesses tended to have higher ratios. However, as presented in our S&P 500 data overview, knowledge of historical sector averages can offer a nuanced understanding.
In conclusion, recognizing the intricacies of the Debt to EBITDA ratio in real-world contexts assists stakeholders in contemplating financial strategies, evaluating potential mergers, and ensuring sustainable growth.
Investing In Stocks Can Be Complicated, Stock Rover Makes It Easy.
Stock Rover is our #1 rated stock investing tool for:
★ Growth Investing - With industry Leading Research Reports ★
★ Value Investing - Find Value Stocks Using Warren Buffett's Strategies ★
★ Income Investing - Harvest Safe Regular Dividends from Stocks ★

"I have been researching and investing in stocks for 20 years! I now manage all my stock investments using Stock Rover." Barry D. Moore - Founder: LiberatedStockTrader.com
FAQ
What is the best program for financial analysis and stock research?
Stock Rover has the broadest selection of financial metrics and ratios for in-depth stock research and analysis. With over 650 financial screening metrics, we recommend Stock Rover.
How is the Debt to EBITDA ratio calculated?
The Debt to EBITDA ratio measures a company's financial leverage and is computed by dividing its total debt by its earnings before interest, taxes, depreciation, and amortization (EBITDA). Understanding This Crucial Financial Ratio breaks down the formula and its components.
What indicates a healthy Debt to EBITDA ratio?
A healthy Debt to EBITDA ratio varies by industry. Generally, a ratio below 3 or 4 is often perceived as healthy, indicating that the company has a reasonable level of debt relative to its earnings. Ratios higher than this are seen as a potential risk. Investopedia's take on the ratio provides further insights into what the ratio signifies.
How does Debt to EBITDA differ from Debt to Equity?
Debt to EBITDA focuses on the relationship between debt and operating earnings, while the Debt to Equity ratio compares total debt to total shareholder equity. This shows different perspectives on leverage: one is based on operating performance, and the other on financing structure.
Why is the Debt to EBITDA ratio important in private equity?
In private equity, the Debt to EBITDA ratio is crucial because it allows investors to assess leverage and the ability of a company to service debt, which can influence investment decisions, particularly in leveraged buyouts.
How does leverage affect the Debt to EBITDA ratio?
Leverage amplifies the Debt to EBITDA ratio. As a company takes on more debt relative to its EBITDA, the ratio increases, suggesting higher risk and potentially less financial flexibility. The ratio is sensitive to changes in debt levels and the company's operational efficiency.
Can the Debt to EBITDA ratio influence a company's credit rating?
Yes, the Debt to EBITDA ratio can influence a company's credit rating. Credit rating agencies consider it as a measure of a company's ability to repay debt. A higher ratio may signal higher risk, which could lead to a lower credit rating. Net Debt to EBITDA Ratio highlights the ratio's impact on credit assessment.
