The stock market is often volatile, and predicting its performance is challenging.
But over the long term, the S&P 500’s average returns were 6.2% until 2010. Since 2010, annual returns have averaged 10.5%.
The big question is, what is the forecast for the next ten years of stock market returns? Making long-term stock market predictions is difficult and fraught with error, but I will base my investing decision on this research.
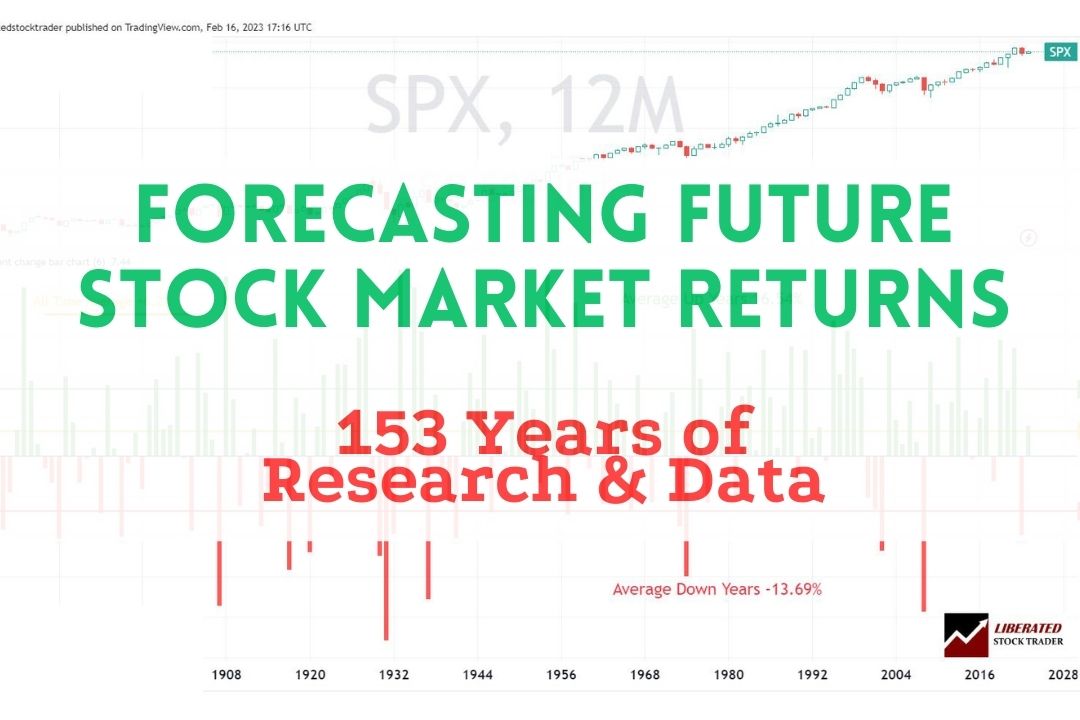
Results: A Data-Driven 10-year Stock Market Forecast
154 years of S&P 500 stock research data from 1871 to 2024 forecasts a 90% chance that the next ten years will be profitable, averaging 6.2% profit per year. The average positive gains year will be 16.54%, and the average negative year will be 13.69%. Only 10% of rolling decades in the last 150 years have produced a loss.
If you want to understand how we made these predictions, read on.
What is the stock market prediction for the next ten years?
Our research shows investors should expect a 90% chance of a 6.5% annual stock market return over the next ten years and a 10% chance of an annual gain of 14.4%. There is a 10% chance the market might lose 0.9% and a 0.8% chance of a 2.9% loss.
The stock market is unpredictable, so it is impossible to predict the exact return you will get over the next ten years. Several factors can affect stock market performance, including economic growth, political stability, and investor sentiment. Generally speaking, long-term investors should expect an average return of approximately 6-7 percent per year from the US stock market. However, past performance does not guarantee future results.
Forecasting stock market returns for the next 10 years
There are two ways to attempt to forecast future stock market returns: the fundamental and technical analysis approaches. The fundamental approach involves analyzing current political and economic events and attempting to extrapolate their outcomes into the future. In the technical analysis approach, one can examine the stock market’s historical behavior and analyze the data to produce expected outcomes.
We will start with the technical analysis approach to forecasting the next 10 years of stock market returns.
A Data-Driven 10-Year Stock Market Forecast
10-Year Stock Market Forecast Based on Historical Returns
Looking at 154 years of data, we see the S&P 500 was positive 66% of the time, with 101 positive years. The average of the winning years was a 16.54% profit. The average loss of the 51 losing years was -13.69%. Over the entire 154 years, the S&P 500 averaged a 6.20% gain.
This data provides us with incredible insight into what to expect from the stock market in the future. We should expect an average 6.2% gain over the long term. But 66% of the time, we should expect an average gain of 16.54%. It makes sense to be a long-term investor because the positive years can be really good, and you can regularly see gains of over 20%. This is why the stock market is the most compelling investment, beating bonds (1-4%), real estate (5-7%), and even fine art and wine (Which are rigged markets).
Chart: 154 Years of US S&P 500 Historical Returns
This chart, mapped using TradingView, shows the last 154 years of S&P 500 returns. It is not a typical stock chart; it shows only the percentage gain or loss for each calendar year. Take time to examine the chart.
")
See this custom chart, live in TradingView
A Stock Market Forecast for 10 Years
Based on the data, you should expect an average annual US stock market return of 6.2 percent over the next ten years. Suppose most of the years are positive, and we enter a period of economic and political stability and growth. In that case, you can expect the average yearly profits to be 10.5%, with some years averaging well over 20%.
But what if you are investing for a full ten years? What is the forecast for a decade of investing? This is where we take the data to the next level.
A 10-Year Stock Market Forecast Based on Rolling 10-Year Average Returns
What should you expect if you are a smart investor investing for at least ten years?
A 10-Year Stock Market Forecast Based on a Decade of Investment
If you are invested in the stock market for ten years, we forecast a 90% chance you will make a 6.3% annual profit. 90% of the decades since its inception, the S%P 500 made an average profit of 6.3%. However, there is a 10% chance you will make a 0.9% loss.
How do we get to these numbers? See the chart below.
Chart: 10-Year Stock Market Rolling Returns Forecast
This chart shows the rolling 10-year profits of the S&P 500. Each bar on the chart depicts the average profit of the preceding ten years. For example, look at the bar for 2021; it shows a 14.8% profit. This data means if you invested from 2012 to 2021, you would have made 14.8% profit per year.

See this custom chart, live in TradingView
The chart above is spectacular; you must take the time to appreciate what it is saying. You can see that the rolling decade returns move in waves, with dips in 1921, 1939, 1977, and 2007. We see long periods in the 20th century of 10-year positive returns.
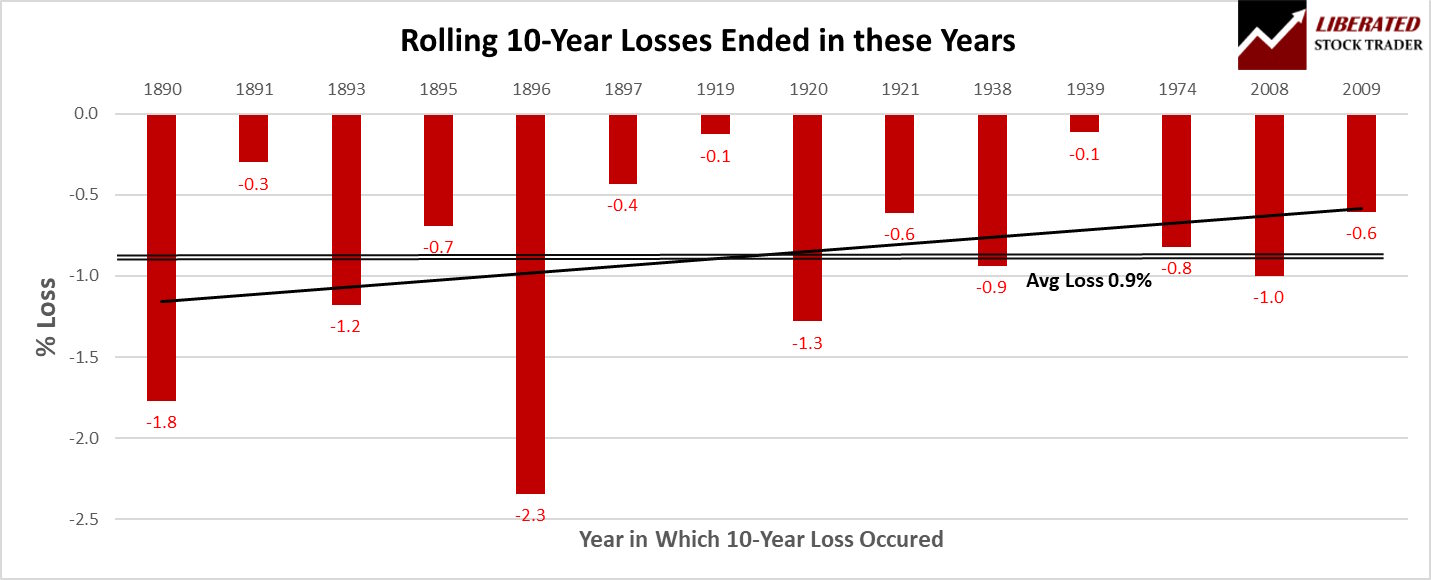
10% of 10-year periods produced losses
There is a 10% chance your 10-year investment might not be profitable. Fourteen rolling decades produced losses. Although the losses were incredibly small, averaging 0.9%, with a maximum of 2.3% loss. What should you do in this situation? Stay invested longer. The data shows that the stock market always bounced back.
Chart: Rolling 10-Year Losses on the S&P 500
This chart shows the losing decades are very few (10%) and minor, averaging a 0.9% loss. You can also see the trend line that shows the decade losses are decreasing into the 21st century.
See this custom chart, live in TradingView
90% of the time, the stock market makes 7.2% per year
The data predicts that 90% of 10-year investments in an S&P 500 index-tracking fund will return 7.2% on average. Also, 30% of the time, you can expect a 20%+ annual gain over ten years.
Chart: 1870 to 2023 Rolling Decade Stock Market Returns
The data shows that all positive decades of investing produce an average 7.2% gain. But look at the chart below and observe how many decades produced over 10% or even 12% annual returns.
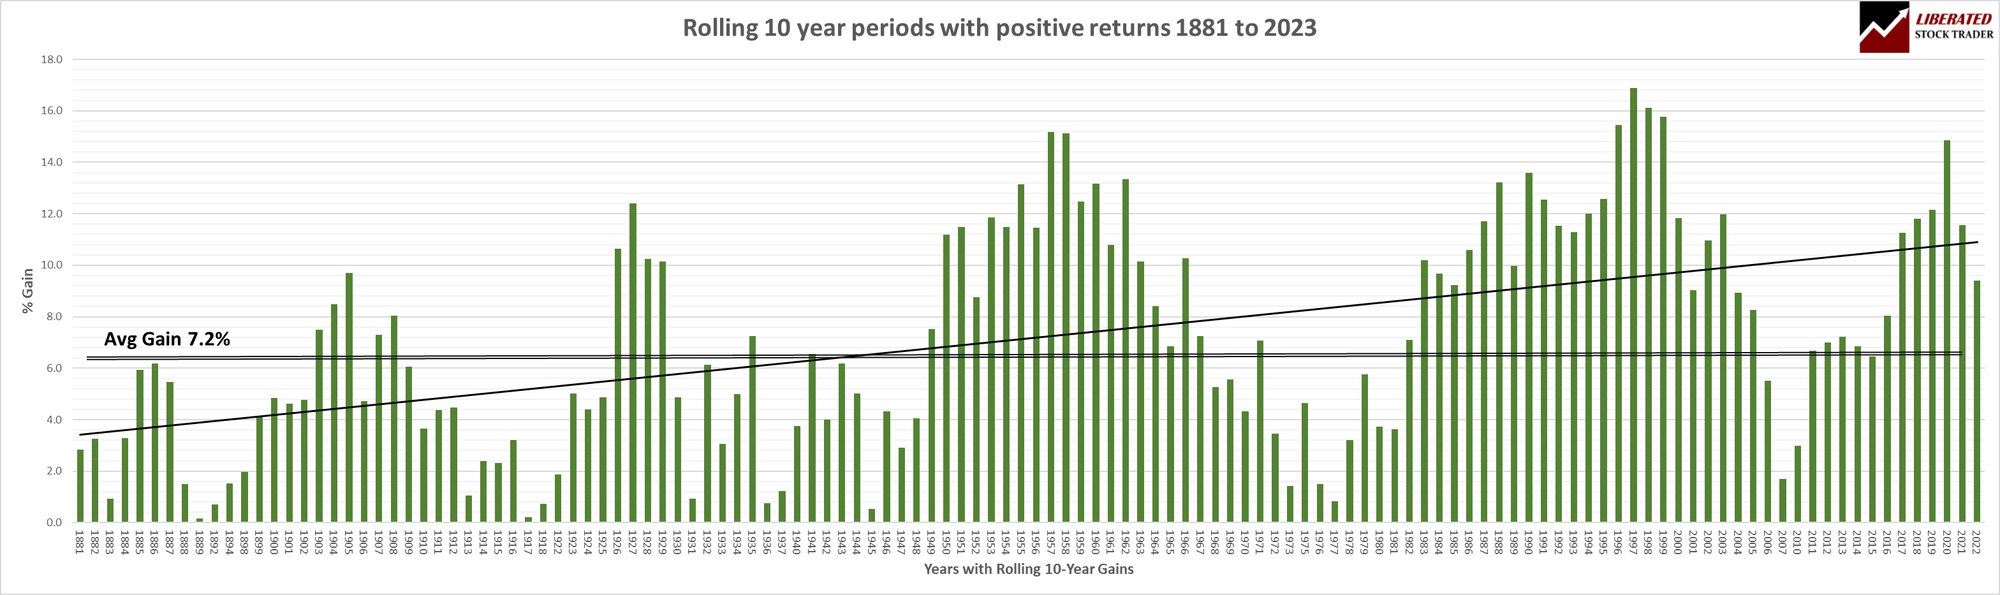
Chart: Rolling 10-Year Forecast for the US S&P 500 1881 to 2023
See this custom chart, live in TradingView
TradingView 4.8/5⭐ : The Best Trading Platform I’ve Tested in 20+ Years
With lightning-fast charts, powerful pattern recognition, smart screening, backtesting, and a global community of 20+ million traders — it’s a powerful edge in today’s markets.

If you want one platform that gives you an edge, this is it.
A Fundamental Approach to a 10-Year Stock Market Forecast
We have examined the data-driven approach to predicting the next ten years of stock market returns; now, we can examine the current political and economic variables that might dictate if we see negative or positive stock market years. Think of the next section as a guide to what to look for.
How political & economic variables impact stock market forecasting
Many analysts believe the US stock market will have at least two years of economic pain before fully recovering. Still, that knowledge does not help us forecast a decade of stock market returns. But let’s look at the data and what economic and political events might impact the next ten years of stock market returns.
How technology investments bring higher returns
Technology has become a major source of growth in the United States stock market, and investing in technology stocks can lead to higher returns. Technology stocks have traditionally been some of the most profitable investments, as innovation typically leads to increased demand for products and services. Additionally, the rapid rise of new technologies such as artificial intelligence and machine learning has opened up immense investment opportunities. With more businesses investing in these cutting-edge technologies, technology companies will likely continue offering higher returns.
How high employment impacts demand for goods and services
High employment levels help stimulate consumer demand for goods and services, which can lead to greater stock market growth. When people earn more money, they’re more likely to spend it on goods and services, which can drive up the prices of stocks across sectors. Additionally, businesses have more money to invest in new technologies or increase their operations. This can also lead to higher earnings and higher stock prices, helping drive growth in the stock market.
With high employment and consumer demand, how can central banks control inflation?
Central banks can use various tools to help manage inflation when unemployment is low and consumer demand is high. These include manipulating the money supply, raising interest rates, and setting reserve requirements for financial institutions. For example, increasing the money supply can reduce the cost of borrowing, leading to more spending. Raising interest rates will also make it more expensive for companies to borrow money, which should slow economic growth. Additionally, central banks can set reserve requirements for financial institutions to limit their ability to increase their balance sheets by lending too much money. By combining these tools with other measures, such as reducing government spending or increasing taxes, central banks can strive to keep inflation in check while allowing economic growth.
What will the Federal Reserve do in the next 10 years to control inflation?
The Federal Reserve has various tools to help manage inflation without causing a recession. It can use monetary policy to adjust the money supply, raise or lower interest rates, and set reserve requirements for financial institutions. Additionally, it can engage in quantitative easing by buying and selling various assets in the market. The Fed could target specific sectors through targeted lending programs and other measures. Lastly, it could employ fiscal policy such as increasing taxes on certain goods or services or decreasing government spending to reduce inflation without causing a recession. These measures can be used together to help reach the Fed’s inflation objective while minimizing the risk of triggering a recession.
What global political events might impact a 10-year forecast?
Global political events, both positive and negative, can significantly impact the stock market. A few examples of political events that may influence stock market returns over the next ten years include:
- Trade war negotiations between major economies such as the United States and China
- Brexit negotiations between the European Union and the United Kingdom
- Tensions in the Middle East region or concerning other world powers
- Elections in major countries around the world
- National fiscal policies affecting taxation and government spending
- Each of these events can positively or negatively affect global markets, causing stock prices to increase or decrease. Investors need to stay up-to-date on global news and political developments.
Potential effects of trade war negotiations on the stock market
Trade negotiations between major economies such as the United States and China can potentially significantly impact the stock market. This is because tariffs and other trade restrictions can increase business costs, reduce profits, and lower stock prices. Additionally, changes in trade policies can cause shifts in global supply and demand dynamics, leading to further disruption of prices and stock market volatility.
Investors need to be aware of ongoing trade war negotiations and their potential implications for stocks. It is important to stay up-to-date on the news regarding these international conflicts and how they could potentially affect the economy, investment performance, and individual stock holdings.
How will the fight between democratic and autocratic rule affect future stock market returns?
In the long term, the battle between democratic and autocratic rule can significantly impact stock market returns. Democracies that adhere to the rule of law generally provide more stability, predictability, and transparency, which can create an environment favorable for investments. On the other hand, autocratic regimes often lack these qualities, leading to political instability, a lack of clarity regarding economic policies, and rampant corruption, which can all negatively affect investor confidence.
Investors should pay close attention to countries trending towards autocracy and those transitioning towards democracy. Any changes in power could lead to market uncertainty and volatility over the coming years.
How will the outcome of the Ukraine-Russian War impact future stock market returns?
The outcome of the Ukraine-Russian War has the potential to significantly influence future stock market returns, both domestically and internationally. In a best-case scenario, an agreement that ends the conflict would help restore diplomatic relations between Russia and Ukraine, leading to improved economic conditions in the region, which could benefit global investors.
In a worst-case scenario, a prolonged conflict could lead to increased military activity and additional sanctions. This turbulence could cause significant political upheaval, currency volatility, and disruption of global supply chains, all of which can harm stock markets worldwide.
Investors should closely monitor developments in this conflict as it unfolds, as this will give them insight into how their portfolio might be impacted in the future.
How would Russia’s victory in the Ukraine War affect global stock markets?
Russia’s victory in the Ukraine War would have wide-reaching implications for global stock markets. The conflict has already had a destabilizing effect on markets in Europe, with investors becoming increasingly concerned about the region’s economic outlook.
If Russia wins the war, it could lead to increased military activity, further sanctions, and political unrest. This instability is never good news for stock markets, as investors tend to avoid uncertainty and volatility.
In addition, such an outcome could also put pressure on other emerging markets since much of their growth depends on Russian trade. A Russian win would likely put those economies into recession, which would again impact global stock returns. As such, domestic and international investors should pay close attention to this situation as it develops.
Invest in yourself! Get all our courses & strategies for 50% off

★ Liberated Stock Trader Pro Stock Investing & Trading Course ★
★ M.O.S.E.S. Market Outperforming ETF Strategy ★
★ LST Beat the Market Stock Picking Strategy ★
★ Exclusive Bonus Course – The Stock Market Crash Detector Strategy ★
★ Fully Guided Videos, eBooks & Lifetime Email Support ★
★ 108 Videos + 3 Full eBooks + 5 Scripts for TradingView & Stock Rover ★
If political and economic events turn out positive, what is the 10-year prediction for the stock market?
If most of our current economic and political issues were resolved in favor of our free and democratic markets, we could expect a 10-year annual stock market of 10-14%. Here’s why.
Suppose Ukraine were to beat Russia in the conflict and the other conditions of high employment, inflation remaining under control, and strong economic growth remain in place. In that case, stock market annual returns would likely be good.
The stability of these factors would give investors confidence in their investments, leading them to make long-term commitments to stocks, which could result in higher annual returns over time. In addition, due to continued economic growth, companies would likely see an increase in profits, which could further drive up stock prices.
All of this, combined with lowered interest rates, should lead to higher returns for investors in the region of +14% per annum; this is the upper 10th percentile of positive decade returns, as demonstrated in the charts above.
It must be noted that stock market performance always involves risk, and no one can predict the future with absolute certainty.
All things considered, the US stock market will likely remain a strong performer over the coming decade.
FAQ
How to predict/forecast the stock market?
The are hundreds of economic and technical indicators that can be used to predict the stock market. It is often better to keep future stock market predictions long-term and general for a chance of success. Our research data shows probabilities of future stock market outcomes.
Can AI predict stock market returns?
The only capable AI I have seen that has a better than 50% chance of predicting short-term stock price movements is Trade Ideas (TI). TI uses 3 AI robots to test millions of conditions daily to make forecasts.
Is the stock market predictable?
Many believe that the stock market is random and unpredictable, but the fact is that it can be predicted within certain boundaries. For example, our 153 years of data shows the stock market has a 90% chance of averaging a 6.2% gain in any 10-year period.
Can anyone predict the stock market?
Yes, anyone can predict the stock market by saying, "The stock market will go up in the future." However, the biggest challenge in forecasting the stock market is estimating short-term timeframes, like weeks or months.
Can google trends predict the stock market?
No, Google trends cannot predict the stock market's future price moves. Google trends can highlight bullish or bearish stock market sentiment, but for real human sentiment, you need a fear and greed index.
Can the stock market be predicted?
Within certain boundaries, the stock market can be predicted. Over the long term, I predict stocks will go up. How? We know, for example, millions of employees, managers, and CEOs work hard to improve their products and services for customers and profitability for shareholders. This constant adding of value to company stocks is the overall positive impetus that increases stock prices.
Do futures predict the stock market?
Yes, futures do predict stock prices for the stock market opening bell. Stock futures are an amalgamation of the post and pre-market trading that occurs out-of-hours, so if you see S&P futures down 1.5%, the chances are it will open 1.5% down. That future prediction will only last a few minutes.
How to predict the stock market using candlesticks?
The entire reason for the candlestick chart existing is to predict future stock price movements. There are hundreds of candlestick patterns, but none are perfect predictors. There is very good candlestick pattern recognition software available on the market that can help with forecasting.
Is the stock market predictable?
In the short term, stock market movements are unpredictable. The most powerful AI trading automation can achieve, at best, a 55 percent success rate. But over the long term, stock markets are very predictable.
Is the stock market predicted to go up or down?
The stock market default prediction is up. Over the last 150 years, 90% of the 10-year periods have made positive annual returns of 6.2% per year. 10% of any 10-year periods have averaged a loss of 0.9%. 66% of all stock market years have averaged a 16% increase.
What is the best stock market prediction software?
The best stock market prediction software I have tested is the MetaStock Forecaster for long-term stock market direction. For day trading, Trade Ideas is the industry leader in AI-driven trading signals and Bot trading.