Our research combines criteria for selecting value and dividend-paying stocks to create seven strategies for finding under-valued dividend stocks.
We include the exact criteria and a step-by-step guide to implementing them into a stock screener.
Whether you are looking for companies that offer great value and a large margin of safety or for high dividend yield or continual dividend growth, we show you how to implement the strategies yourself.

What is a Value Investing Strategy
A value investing strategy is based on finding stocks trading at a significant discount to the value the stock market places on the share price. Using discounted cash flow, future earnings, the margin of safety, and fair value in a stock screener enables you to find stocks selling at a discount.
We share our seven favorite value and dividend income strategies. You can choose one and adapt it to your investing style.
All the examples and research into this article were performed using our favorite stock screener, Stock Rover.
Stock Rover 4.7/5⭐ : My Top Pick for Smart Investors
Investing In Stocks Can Be Complicated. Stock Rover Makes It Easy.
★
Growth Investing - with industry-leading
Research Reports ★
★ Value Investing - using Warren Buffett's Fair Value and Margin-of-Safety ★
★ Income Investing - rank by yield, growth, quality, and safety using 650 metrics ★

"I have been researching and investing in stocks for 20 years! I now manage all my long-term investments using Stock Rover." — Barry D. Moore, Founder: LiberatedStockTrader.com
7 Tested Value Investing Strategies
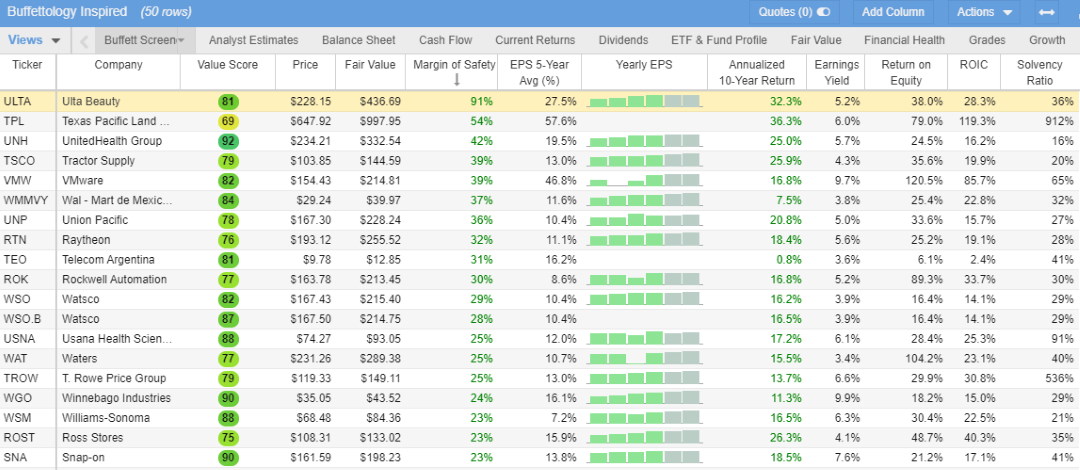
1. Fair Value & Margin of Safety Buffett Strategy – Low Risk
Fair Value & Margin of Safety Buffett Strategy Screening Criteria
*Exclusive to StockRover |
Buffett’s most important measure in deciding whether to invest in a company, the margin of safety, is the percentage difference between its fair value and actual stock price. This metric is our arsenal’s most significant valuation metric, as it is the final output of a detailed discounted cash flow analysis.
Fair Value Warren Buffett bases his Intrinsic Value / Fair Value calculations on future free cash flows. Buffett thinks cash is a company’s most important asset, so he tries to project how much future cash a business will generate and discount it against inflation. This is called the Discounted Cashflow Method.
A Strong Earnings Per Share History & Growth Rate. Earnings per share (EPS) is a very important metric for Buffett and Wall Street. Buffett looks for companies with a consistent record of earnings growth, particularly over a 5 to 10-year period.
A Consistently High Return on Equity. This profitability measure is calculated as net income as a percentage of shareholders’ equity, also called ROE. A high ROE shows an effective use of investor’s money to grow the value of the business.
Return on Invested Capital (ROIC) quantifies how well a company generates cash flow relative to the capital it has invested in its business.
Is the Company Conservatively Financed? The solvency ratio measures whether a company generates enough cash to stay solvent. It is calculated by summing net income and depreciation and dividing by current liabilities and long-term debt. A value above 20% is considered good.
If a company’s profit per share is not higher than the return of a safe asset like treasury bonds, you should not invest in it. This is an easy calculation, and we will use the Earnings Yield. Earnings Yield is the earnings per share for the most recent 12-month period divided by the current market price per share.
2. Highest Dividend Yield Strategy – Risky
Highest Yield Dividend Screening Criteria
|
The first thing someone new to income and dividend investing would do is to look for stocks with the highest dividend yield. Naturally, they will want to choose a company that will pay the most in dividends.
Using the criteria on the right will help you find those highest-yielding stocks.
Ideally, you will choose companies worth at least $500 M in Market Capitalization; any lower is far too risky. Next, you will search for stocks with a dividend yield greater than 4%. In this example, I have also chosen to scan for companies with at least three years of dividend payouts &, finally, a Payout Ratio of less than 90%.
This scan will show you a list of stocks like this; I have sorted the list on dividend yield.
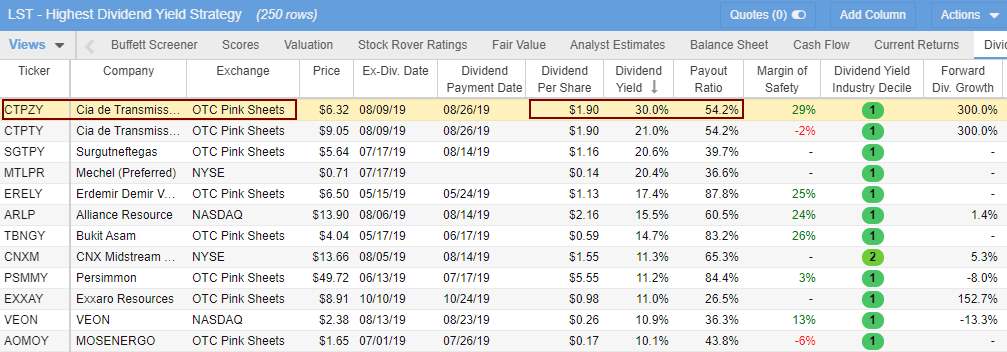
You must look deeper into any company you consider investing in. Take a look at the highest dividend yield stock in this list. CTPZY is currently yielding 30% and is listed on the OTC Pink Sheets Market. This could be a great deal, but first, let’s look closer.
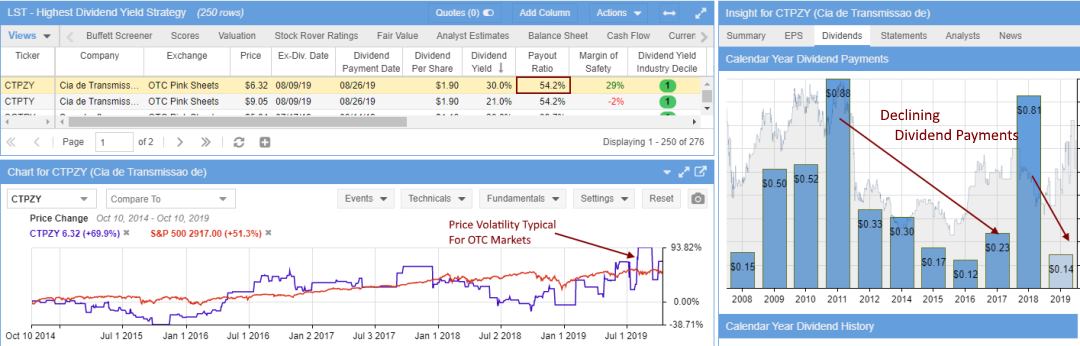
Now, although we have scanned for a dividend yield higher than 0%, you can see that the dividends are in constant decline to match the dip in share price and the reduction in earnings. Also, I am uncomfortable with a payout ratio of 54.2%; this means it is paying out over 50% of its earnings in dividends, which is on the high side and not sustainable.
Do you want to invest in that? Perhaps, if you conduct further investigation, you will find that it has a bright future in a growing market.
3. High Dividend Yield + 3-Year Dividend Growth Strategy – Less Risky
High Dividend Yield Stock Screening Criteria
|
The most obvious first strategy to pursue is to look for companies with the highest dividend yield. If a company has a current % dividend yield of 10%, should you expect a 10% income from your investment for that year?
The answer is maybe.
10% is a very high yield, possibly because of several reasons. For example, the stock price may have recently dropped dramatically, which would mean the dividend yield looks a lot higher because dividend yield is the dividend payment per share dividend by the price per share.
So, in addition to a high-yield strategy, you need to be able to ensure the dividend can be paid in the future, so you would look for a payout ratio that is not too high, ideally less than 50, which is still somewhat high.
This yields a list of 127 stocks; let’s look at the two highest-yielding stocks on the list and compare them. Which one would you rather invest in?
Screener Results – Enel Americas (Ticker: ENIA)
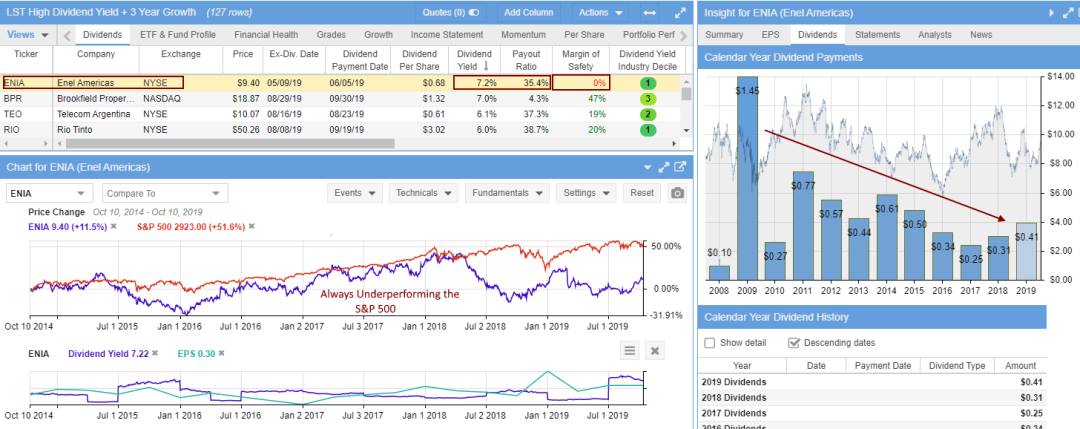
ENIA is the highest yield stock on the list, with 7.2% per year and a payout ratio of 35.4%, which looks OK. In Stock Rover, when you look at the Dividend Payments Trend on the right of the image, you can see the dividends are in continual decline. Also, if you look closely, you can see the Buffett Margin of Safety (Exclusive to Stock Rover) is at zero. The company’s capitalization (stock market valuation) equals its future discounted cash flow (see intrinsic value). So there is some risk here.
Screener Results – Brookfield Property (Ticker: BPR)
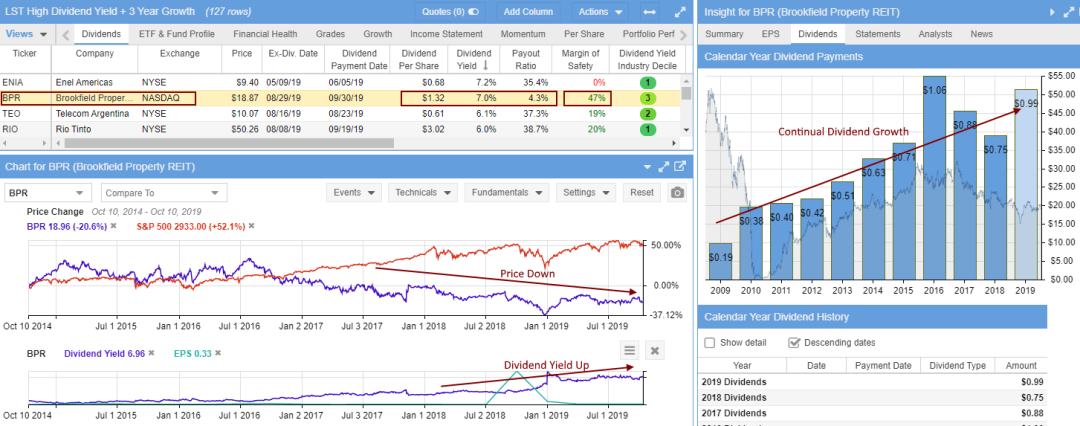
Second on the list is Brookfield Property, a Real Estate Investment Trust (REIT). High Dividend Yield & solid Dividend Growth now, this is a company I like the look of. They have an excellent dividend yield of 7%, probably because the stock price has declined so much. Here, you can see the relationship between stock price and dividend yield. The big difference between these two companies is that BPR has an excellent 10-year record of increasing dividend payments (see the right panel) and a huge margin of safety of 47%.
The problem with this stock is that if you had purchased it two years ago, you would be down 30% on the stock price, but you would be up 14% on the dividend. That would be a net loss. However, you only lose money when you sell the stock, and if you are in for the long-term and buying now, you can choose when to sell for an overall profit.
Which one would you invest in?
4. Value + Dividend Strategy – Safest
Value + Dividend Strategy Screening Criteria
|
Looking for value stocks in addition to stocks paying dividends is a great strategy and the cornerstone of Warren Buffett and Ben Graham’s investing strategy. While you may buy stock in a company for the dividends if the stock price is likely to go down within your holding period, the dividends might not offset the loss, so look for value stocks that pay a dividend. It’s like buying extra insurance and avoiding unnecessary risks.
In this strategy, you want to look for inexpensive dividend-paying companies by traditional measures such as low price to earnings, price to sales, and price to book. These companies should still be growing sales and earnings.
If you select Stock Rover as your screener, you will have access to an exclusive set of criteria based on the Warren Buffett value investing principles of Fair Value/Intrinsic Value and Margin of Safety.
So, let’s take a look at the results of this screen.
Screener Results – Carnival (Ticker: CUK)
Here, we look at the second-highest dividend yield in the stock screen results.
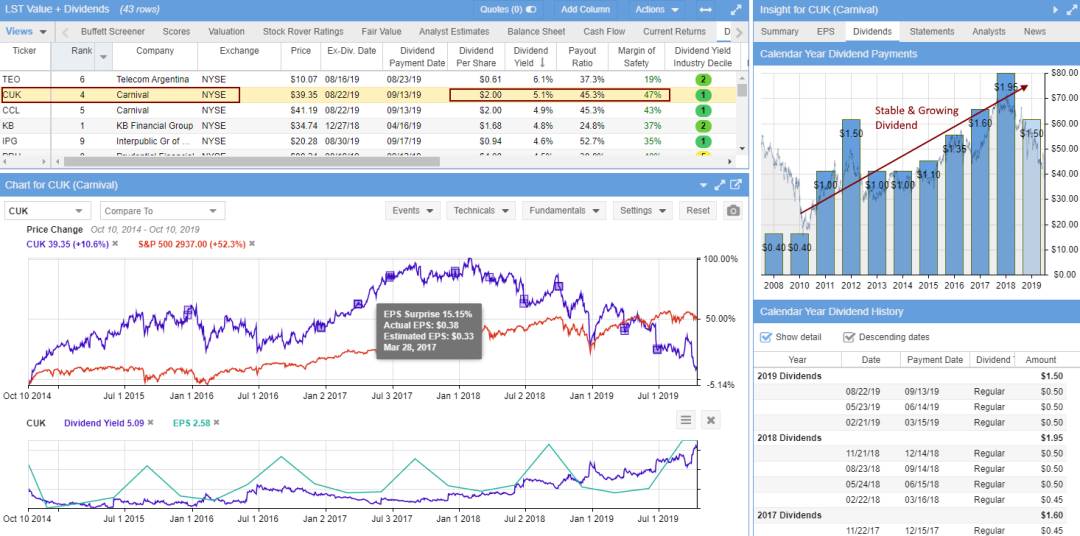
From the initial view (above), I can see that despite a terrible year for the stock price, earnings have continued to grow.
The dividend yield is 5.1%, which is healthy. It has a 45% payout ratio, which is reasonable.
It also has a nice-looking margin of safety of 47%. At this price of $39 per share, the deal has very little risk.
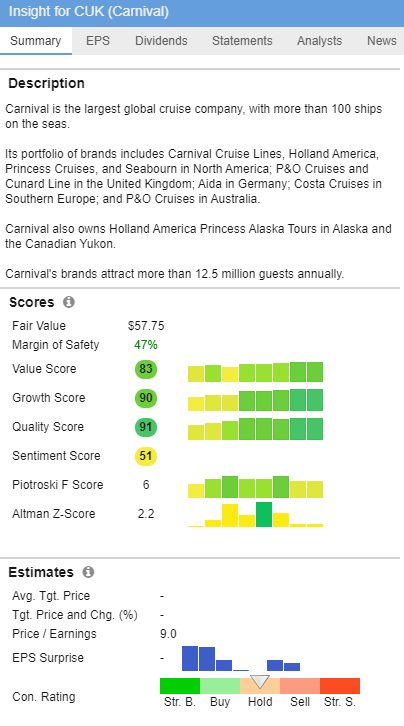
If you think this is a good stock, you should drill into the financials. On the right, you can see the Stock Rover Ratings for Carnival.
Value Score – 83. The Stock Rover value score looks at EV / EBITDA, P/E, EPS Predictability, Price / Tangible Book, and Price / Sales. The Price / Tangible Book and Price / Sales values are compared within a sector, whereas the other metrics are compared across all stocks with adequate data. The best companies score 100, and the worst score 0.
Growth Score – 90. The Stock Rover growth score looks at the five-year history and forward estimates for EBITDA, Sales, and EPS growth to rank the best companies across all stocks with adequate data. The best companies score 100, and the worst score 0.
Quality Score – 91%. The Stock Rover quality score compares profitability and balance sheet metrics to find high-quality companies. Our computation includes ROIC, Net Margin, Gross Margin, Interest Coverage, and Debt / Equity ratio values. The best companies score 100, and the worst score 0.
So, this stock is looking like something I might invest in.
5. Safe Dividends Strategy
Safe Dividends Screening Criteria
|
If you want to ensure the dividends you are banking on are safe, you should look for additional factors to help support the notion you will continue to receive dividends in the future.
Look for higher capitalized companies, preferably above $2 billion. Lowering your dividend yield expectations to greater than 1.5% will enable companies with sustainable dividends to appear in your scan. You might also want to drop your 1-year dividend change, 3-year, and 5-year dividend average criteria to >0%. This ensures they are paying a dividend over the long term.
Also, ensure your stocks are floated on a major well regulated) exchange like the LSE, DAX, NYSE, or NASDAQ.
In addition, you may want to drop your payout ratio criteria to <50 to ensure that the company is not already paying out too much about its earnings.
Finally, you will want to make sure that the company is experiencing sales growth above the dividend averages or growth. This is additional insurance, so you know sales are growing; therefore, there should not be an impact on dividends in the future.
6. Long-Term Dividend Growth Strategy
Long-term Dividend Growth Screening Criteria
|
This strategy essentially means investing in companies continually paying and increasing dividends.
You will need a stock screener with a large historical database of earnings and dividend payments, such as Stock Rover.
The criteria shown here is the calculation for 10 years [Y9 – Y1]. This would typically return a list of only 5% of the NYSE or NASDAQ listed stocks.
Some well-known names, such as IBM, Texas Instruments, and Disney, meet these criteria today.
7. Dividend Aristocrats 10-Year Dividend Growth Strategy
10-Year Dividend Growth Screening Criteria
|
The Dividend Kings or Dividend Aristocrats strategy essentially means investing in companies with a long history of continually paying and increasing dividends.
For this, you will need a stock screener with a significantly large historical database (at least ten years) of earnings and dividend payments, such as Stock Rover.
The criteria shown here is the calculation for 10 years.
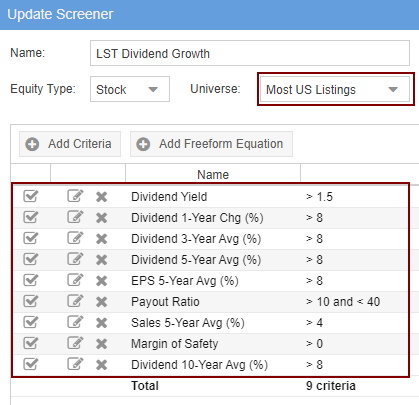
Dividend Growth Criteria Explanation:
- Dividend Yield > 1.5%. This is a simple filter designed to ensure only companies paying a dividend above 1.5% are listed—anything less than 1.5% will not even payout in line with inflation.
- Dividend 1 Year Change > 8%. We want only companies with increased dividends of over 8% in the last fiscal year.
- Dividend 3-Year Change > 8%. Next, we filter down to those companies that have at least an average increase of 8% over the last three years.

Dividend Growth Screener – Criteria Implemented Into Stock Rover - Dividend 5-Year Change > 8%. Only those companies increasing dividends by more than 8% over the last five years.
- Dividend 10 Year Change > 8%. You get the idea. :)
- Payout Ratio >10 < 40. The payout ratio ensures the company makes enough profits to continue paying dividends and sustain the increases. You can reduce the “<10” to see more stocks in the scan. We do not want companies to pay more than 40% of their profits out in dividends; they must retain cash flow for future growth and capital investments.
- Sales 5-Year Average (%) > 4%. This is designed to ensure that the company is increasing sales, at least on average, to pay for the above growth in dividends.
- Margin of Safety > 0. (Exclusive to Stock Rover) The most important criterion for me is the margin of safety, using Warren Buffett’s calculation, the forward discounted cash flow (see our article on Intrinsic Value). Essentially, the higher the margin of safety, the more of a discount you are buying a stock for.
These criteria would typically return a list of only 5% of the NYSE or NASDAQ listed stocks.