Our regularly updated list of inverse/short ETFs shows which ETFs are active and includes the ticker, market capitalization, and expense ratios.
Inverse or Short ETFs are exchange-traded funds that enable you to bet against a market, sector, or index. Typically, Short ETFs simplify shorting the market and incorporating leverage.
What Are Inverse or Short ETFs?
Inverse or Short ETFs are exchange-traded funds (ETFs) that attempt to generate returns that correspond to a specified multiple of the inverse (-1x) or short (-2x, -3x, etc.) of an index’s daily performance. These funds can provide investors with effective hedging tools and offer exposure to bear markets when stocks and other financial assets decline.
How Do Short ETFs Work?
Inverse or Short ETFs typically combine derivatives, such as futures contracts and swaps, to achieve their objectives. As ETFs can be purchased on any major exchange, investors can gain exposure to these bear-market strategies without needing to open a margin account or short individual stocks.
The Best Short & Inverse ETFs
While no single “best” short or inverse ETF exists, the best ETFs should have significant assets under management, enough trading volume to ensure liquidity, and low management fees.
Our list of the best short and inverse ETFs includes the 10-day average trading volume, net assets under management, and expense ratio.
Inverse/Short S&P 500 ETFs List
| Short S&P 500 ETFs | Ticker | Net Assets ($M) | Expense Ratio | Leverage |
| ProShares Short S&P500 | SH | $2,864 | 0.90% | 1X |
| ProShares UltraShort S&P500 | SDS | $1,091 | 0.91% | 2X |
| ProShares UltraPro Short S&P500 | SPXU | $887 | 0.93% | 3X |
| Direxion Daily S&P 500 Bear 3X Shares | SPXS | $736 | 1.07% | 3X |
| Direxion Daily S&P 500 Bear 1X Shares | SPDN | $167 | 0.50% | 1X |
| Direxion Daily S&P 500 High Beta Bear 3X Shares | HIBS | $45 | 1.07% | 3X |
Research Powered By Stock Rover, Our Recommended Stock & ETF Research Platform. Read the Stock Rover Review.
📈Live Charts: Short S&P 500 ETFs
ProShares Short S&P500 (SH) Chart
ProShares UltraShort S&P500 (SDS)
ProShares UltraPro Short S&P500 (SPXU)
Direxion Daily S&P 500 Bear 3X Shares (SPXS)
Direxion Daily S&P 500 Bear 1X Shares (SPDN)
Direxion Daily S&P 500 High Beta Bear 3X Shares (HIBS)
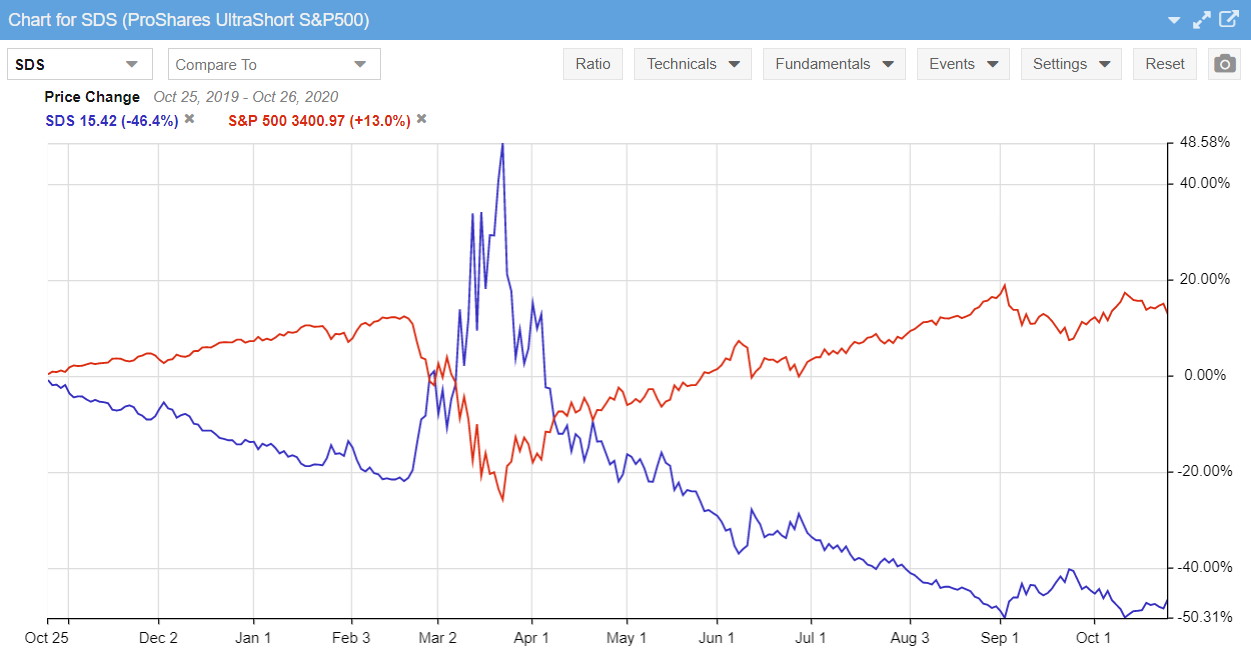
Inverse ETF Performance vs. The S&P 500
The long-term performance of inverse ETFs does not match the performance of the underlying index. This example shows a 1-year chart of the S&P 500 versus the ProShares UltraShort 2X Inverse leveraged ETF. This is the chart spanning the COVID-19 crash.
Get Stock Rover ETF Screening & Research
Inverse/Short Nasdaq ETFs List
| Inverse Nasdaq ETFs | Ticker | Net Assets ($M) | Expense Ratio | Leverage |
| ProShares UltraPro Short QQQ | SQQQ | $1,520 | 0.95% | 3X |
| ProShares Short QQQ | PSQ | $774 | 0.95% | 1X |
| ProShares UltraShort QQQ | QID | $283 | 0.95% | 2X |
| ProShares UltraShort Nasdaq Biotechnology | BIS | $12 | 0.95% | 2X |
Research Powered By Stock Rover, Our Recommended Stock & ETF Research Platform.
- Related Article: The 11 Stock Sectors & The ETFs To Trade Them
📈Live Charts: Short Nasdaq ETFs
ProShares UltraPro Short QQQ (SQQQ)
ProShares Short QQQ (PSQ)
ProShares UltraShort QQQ (QID)
ProShares UltraShort Nasdaq Biotechnology (BIS)
Dow Jones Short ETFs List
| Dow Jones Short ETFs | Ticker | Net Assets ($M) | Expense Ratio | Leverage |
| ProShares UltraPro Short Dow30 | SDOW | $516 | 0.95% | 3X |
| ProShares Short Dow30 | DOG | $408 | 0.95% | 1X |
| ProShares UltraShort Dow30 | DXD | $160 | 0.95% | 2X |
| Direxion Daily Dow Jones Internet Bear 3X Shares | WEBS | $5 | 1.07% | 3X |
Research Powered By Stock Rover, Our Recommended Stock & ETF Research Platform.
📈Live Charts: Dow Jones Short ETFs
ProShares UltraPro Short Dow30 (SDOW)
ProShares Short Dow30 (DOG)
ProShares UltraShort Dow30 (DXD)
Direxion Daily Dow Jones Internet Bear 3X Shares (WEBS)
Beat The Market, Avoid Crashes & Lower Your Risks
Nobody wants to see their hard-earned money disappear in a stock market crash.
Over the past century, the US stock market has had 6 major crashes that have caused investors to lose trillions of dollars.

The MOSES Index ETF Investing Strategy will help you minimize the impact of major stock market crashes. MOSES will alert you before the next crash happens so you can protect your portfolio. You will also know when the bear market is over and the new rally begins so you can start investing again.
MOSES Helps You Secure & Grow Your Biggest Investments
★ 3 Index ETF Strategies ★
★ Outperforms the NASDAQ 100, S&P500 & Russell 3000 ★
★ Beats the DAX, CAC40 & EURO STOXX Indices ★
★ Buy & Sell Signals Generated ★
MOSES Helps You Sleep Better At Night Knowing You Are Prepared For Future Disasters
Short Russell & Mid Cap ETFs List
| Short Russell ETFs | Ticker | Net Assets ($M) | Expense Ratio | Leverage |
| Direxion Daily Small Cap Bear 3X Shares | TZA | $526 | 1.07% | 3X |
| ProShares Short Russell2000 | RWM | $445 | 0.95% | 1X |
| ProShares UltraPro Short Russell2000 | SRTY | $151 | 0.95% | 3X |
| ProShares UltraShort Russell2000 | TWM | $114 | 0.95% | 2X |
| ProShares Short MidCap400 | MYY | $32 | 0.95% | 1X |
| ProShares UltraPro Short MidCap400 | SMDD | $13 | 0.95% | 3X |
| ProShares Short SmallCap600 | SBB | $12 | 0.95% | 1X |
| ProShares UltraShort SmallCap600 | SDD | $7 | 0.95% | 2X |
| Direxion Daily Mid Cap Bear 3X Shares | MIDZ | $6 | 1.08% | 3X |
| ProShares UltraShort MidCap400 | MZZ | $4 | 0.95% | 2X |
Research Powered By Stock Rover, Our Recommended Stock & ETF Research Platform.
Get Stock Rover ETF Screening & Research
📈Live Charts: Short Russell & Mid Cap ETFs
Direxion Daily Small Cap Bear 3X Shares (TZA)
ProShares Short Russell2000 (RWM)
ProShares UltraPro Short Russell2000 (SRTY)
ProShares UltraShort Russell2000 (TWM)
ProShares Short MidCap400 (MYY)
ProShares UltraPro Short MidCap400 (SMDD)
ProShares Short SmallCap600 (SBB)
Short Oil ETFs List
| Short Oil ETFs | Ticker | Net Assets ($M) | Expense Ratio | Leverage | 10-Day Volume (Avg) |
| ProShares UltraShort Bloomberg Crude Oil | SCO | $80 | 0.95% | 2X | 2,838,394 |
| Direxion Daily S&P Oil & Gas Exp. & Prod. Bear 2X Shares | DRIP | $49 | 1.07% | 2X | 366,216 |
| MicroSectors U.S. Big Oil Index Inverse ETNs | YGRN | $31 | 0.95% | 1X | 267 |
| ProShares UltraShort Oil & Gas | DUG | $21 | 0.95% | 2X | 63,022 |
📈Live Charts: Short Oil ETFs
ProShares UltraShort Bloomberg Crude Oil (SCO)
Direxion Daily S&P Oil & Gas Exp. & Prod. Bear 2X Shares (DRIP)
ProShares UltraShort Oil & Gas (DUG)
Short Gold ETFs List
| Short Gold ETFs | Ticker | Net Assets ($M) | Expense Ratio | Leverage |
| Direxion Daily Gold Miners Index Bear 2X Shares | DUST | $131 | 1.07% | 2X |
| Direxion Daily Junior Gold Miners Index Bear 2X Shares | JDST | $94 | 1.10% | 2X |
| ProShares UltraShort Gold | GLL | $27 | 1.32% | 2X |
| DB Gold Double Short ETN | DZZ | $6 | 0.75% | 2X |
| DB Gold Short ETN | DGZ | $3 | 0.75% | 2X |
Research Powered By Stock Rover, Our Recommended Stock & ETF Research Platform.
📈Live Charts: Short Gold ETFs
Direxion Daily Gold Miners Index Bear 2X Shares (DUST)
Direxion Daily Junior Gold Miners Index Bear 2X Shares (JDST)
ProShares UltraShort Gold (GLL)
Short/Inverse International ETFs List
| Short International ETFs | Ticker | Net Assets ($M) | Expense Ratio | Leverage |
| ProShares Short MSCI Emerging Markets | EUM | $62 | 0.95% | 1X |
| Direxion Daily MSCI Real Estate Bear 3X Shares | DRV | $40 | 1.08% | 3X |
| Direxion Daily MSCI Emerging Markets Bear 3X Shares | EDZ | $35 | 1.08% | 3X |
| ProShares UltraShort MSCI Brazil Capped | BZQ | $29 | 0.95% | 2X |
| ProShares Short MSCI EAFE | EFZ | $28 | 0.95% | 1X |
| ProShares UltraShort MSCI Emerging Markets | EEV | $12 | 0.95% | 2X |
Research Powered By Stock Rover, Our Recommended Stock & ETF Research Platform. Read the Stock Rover Review.
List of All Short/Inverse ETFs By Expense Ratio & Capitalization
| Ticker | Company | Expense Ratio | Market Cap ($M USD) |
| SPDN | Direxion Daily S&P 500 Bear 1X Shares | 0.56% | $372 |
| TAIL | Cambria Tail Risk ETF | 0.59% | $186 |
| EMTY | ProShares Decline of the Retail Store ETF | 0.65% | $10 |
| FAIL | Cambria Global Tail Risk ETF | 0.71% | $4 |
| SARK | AXS Short Innovation Daily ETF | 0.75% | $242 |
| DZZ | DB Gold Double Short ETN | 0.75% | $5 |
| DGZ | DB Gold Short ETN | 0.75% | $3 |
| CYA | Simplify Tail Risk Strategy ETF | 0.84% | $17 |
| SH | ProShares Short S&P500 | 0.89% | $1,857 |
| SPXU | ProShares UltraPro Short S&P500 | 0.90% | $1,110 |
| SDS | ProShares UltraShort S&P500 | 0.90% | $942 |
| SQQQ | ProShares UltraPro Short QQQ | 0.95% | $4,743 |
| PSQ | ProShares Short QQQ | 0.95% | $990 |
| QID | ProShares UltraShort QQQ | 0.95% | $508 |
| RWM | ProShares Short Russell2000 | 0.95% | $363 |
| DOG | ProShares Short Dow30 | 0.95% | $216 |
| FNGD | MicroSectors FANG+ Index -3X Inverse Leveraged ETN | 0.95% | $188 |
| NRGD | MicroSectors U.S. Big Oil Index -3X Inverse Leveraged ETNs | 0.95% | $166 |
| SRTY | ProShares UltraPro Short Russell2000 | 0.95% | $158 |
| SCO | ProShares UltraShort Bloomberg Crude Oil | 0.95% | $112 |
| TWM | ProShares UltraShort Russell2000 | 0.95% | $104 |
| DXD | ProShares UltraShort Dow30 | 0.95% | $83 |
| EPV | ProShares UltraShort FTSE Europe | 0.95% | $60 |
| GDXD | MicroSectors Gold Miners -3X Inverse Leveraged ETNs | 0.95% | $60 |
| SRS | ProShares UltraShort Real Estate | 0.95% | $57 |
| EFZ | ProShares Short MSCI EAFE | 0.95% | $55 |
| REK | ProShares Short Real Estate | 0.95% | $49 |
| SEF | ProShares Short Financials | 0.95% | $39 |
| EUM | ProShares Short MSCI Emerging Markets | 0.95% | $32 |
| OILD | MicroSectorsTM Oil & Gas Exploration & Production -3X Inverse Leveraged ETNs | 0.95% | $26 |
| SBB | ProShares Short SmallCap600 | 0.95% | $25 |
| FXP | ProShares UltraShort FTSE China 50 | 0.95% | $21 |
| SKF | ProShares UltraShort Financials | 0.95% | $21 |
| BERZ | MicroSectors Solactive FANG & Innovation -3X Inverse Leveraged ETNs | 0.95% | $18 |
| DUG | ProShares UltraShort Energy | 0.95% | $18 |
| BNKD | MicroSectors U.S. Big Banks Index -3X Inverse Leveraged ETNs | 0.95% | $12 |
| MYY | ProShares Short MidCap400 | 0.95% | $12 |
| BZQ | ProShares UltraShort MSCI Brazil Capped | 0.95% | $10 |
| EEV | ProShares UltraShort MSCI Emerging Markets | 0.95% | $8 |
| SSG | ProShares UltraShort Semiconductors | 0.95% | $7 |
| YXI | ProShares Short FTSE China 50 | 0.95% | $7 |
| SMDD | ProShares UltraPro Short MidCap400 | 0.95% | $6 |
| BIS | ProShares UltraShort Nasdaq Biotechnology | 0.95% | $5 |
| EWV | ProShares UltraShort MSCI Japan | 0.95% | $5 |
| WTID | MicroSectors Energy -3X Inverse Leveraged ETN | 0.95% | $5 |
| REW | ProShares UltraShort Technology | 0.95% | $4 |
| DULL | MicroSectors Gold -3X Inverse Leveraged ETN | 0.95% | $3 |
| EFU | ProShares UltraShort MSCI EAFE | 0.95% | $3 |
| JETD | MAX Airlines -3X Inverse Leveraged ETN | 0.95% | $3 |
| SDD | ProShares UltraShort SmallCap600 | 0.95% | $3 |
| SIJ | ProShares UltraShort Industrials | 0.95% | $3 |
| MZZ | ProShares UltraShort MidCap400 | 0.95% | $2 |
| SCC | ProShares UltraShort Consumer Discretionary | 0.95% | $2 |
| SKYU | ProShares Ultra Cloud Computing | 0.95% | $2 |
| SMN | ProShares UltraShort Materials | 0.95% | $2 |
| SDOW | ProShares UltraPro Short Dow30 | 0.96% | $479 |
| SOXS | Direxion Daily Semiconductor Bear 3X Shares | 1.02% | $1,111 |
| JDST | Direxion Daily Junior Gold Miners Index Bear 2X Shares | 1.02% | $132 |
| TZA | Direxion Daily Small Cap Bear 3X Shares | 1.03% | $409 |
| GGLS | Direxion Daily GOOGL Bear 1X Shares | 1.06% | $4 |
| DUST | Direxion Daily Gold Miners Index Bear 2X Shares | 1.07% | $152 |
| HIBS | Direxion Daily S&P 500 High Beta Bear 3X Shares | 1.07% | $47 |
| TSLS | Direxion Daily TSLA Bear 1X Shares | 1.07% | $46 |
| AAPD | Direxion Daily AAPL Bear 1X Shares | 1.07% | $27 |
| EDZ | Direxion Daily MSCI Emerging Markets Bear 3X Shares | 1.07% | $24 |
| MSFD | Direxion Daily MSFT Bear 1X Shares | 1.07% | $9 |
| AMZD | Direxion Daily AMZN Bear 1X Shares | 1.07% | $5 |
| SPXS | Direxion Daily S&P 500 Bear 3X Shares | 1.08% | $933 |
| DRV | Direxion Daily Real Estate Bear 3X Shares | 1.08% | $138 |
| YANG | Direxion Daily FTSE China Bear 3X Shares | 1.08% | $132 |
| TECS | Direxion Daily Technology Bear 3X Shares | 1.08% | $120 |
| WEBS | Direxion Daily Dow Jones Internet Bear 3X Shares | 1.08% | $34 |
| ERY | Direxion Daily Energy Bear 2X Shares | 1.08% | $27 |
| FAZ | Direxion Daily Financial Bear 3X Shares | 1.09% | $149 |
| LABD | Direxion Daily S&P Biotech Bear 3X Shares | 1.09% | $105 |
| DRIP | Direxion Daily S&P Oil & Gas Exp. & Prod. Bear 2X Shares | 1.09% | $61 |
| TSLQ | AXS TSLA Bear Daily ETF | 1.15% | $112 |
| NVDS | AXS 1.25X NVDA Bear Daily ETF | 1.15% | $98 |
| GLL | ProShares UltraShort Gold | 1.28% | $17 |
| ZSL | ProShares UltraShort Silver | 1.35% | $21 |
| DGLDF | VelocityShares 3x Inverse Gold ETN Linked to the S&P GSCI Gold Index ER | 1.35% | $4 |
| KOLD | ProShares UltraShort Bloomberg Natural Gas | 1.37% | $141 |
| SVIX | -1x Short VIX Futures ETF | 1.47% | $71 |
| DWSH | AdvisorShares Dorsey Wright Short ETF | 2.77% | $24 |
| HDGE | AdvisorShares Ranger Equity Bear ETF | 4.29% | $123 |
How to Export This Short ETF List to Excel
- Drag Your Mouse Over the Table
- Right Click -> Select Copy
- Open Excel
- Right-click the First Cell A1 -> Click Paste
5 Tips on ETFs That Short The Market?
1. Inverse ETFs Should be Traded on a Daily Basis?
All short or inverse ETFs carry warnings that they should be traded only on a daily basis. Of course, you can hold them for longer than one day, but you will see mismatches in the return of the short ETF vs. the actual index over time.
Inverse ETFs Do Not Match the Index Performance Because:
- The underlying contracts supporting the Inverse ETFs must be rebalanced at the end of the trading day. This causes slippage.
- The volatility of an index will affect compounding, which affects the inverse ETF.
- Related Article: Our Resident ETF Trader Joe’s Leveraged ETF Strategy
2. Inverse ETFs Should Have Good Liquidity & Volume
It is important that, if you purchase an Inverse ETF, you can sell it when you want to, at a price close to your target price. There are 244 Inverse/Leveraged ETFs on the US exchanges, and the average 10-day trading volume is 1.8 million shares per day. You will want to choose ETFs that average at least 500,000 in daily trading volume.
3. Choose ETFs With Higher Assets Under Management
The median amount of Net Assets Under Management (NAUM) for leveraged and inverse ETFs is $50 million. It is wise to use ETFs with more than $100 million in assets under management; this helps with liquidity and the fund’s stability.
4. ETFs Should Have Low Expenses
Any Inverse or Leveraged ETF you trade should have lower expense ratios. Of the 244 ETFs in this study, the average expense ratio is 0.96%, with a range from 1.85% to 0.35%. The largest, most liquid funds have expense ratios between 0.95% and 1.07%, which are acceptable.
5. Use a Commission-Free Broker to Minimize Costs
When purchasing ETFs, you should select a broker that offers $0 commission to buy and sell ETFs. Firstrade has over 2,200 commission-free ETFs, the largest in the industry. Read the Firstrade Review.
More ETF Research
- The Difference Between ETFs and Mutual Funds is Capital Flow
- ETFs vs. Mutual Funds: The Difference Impacts Your Gains
- What is an Index Fund, and How do they Work?
- How to Invest in Index Funds to Maximize Long-term Profits
- ETFs vs. Mutual Funds vs. Index Funds: Explained
- Investing in Index Funds: Everything You Need to Know
- ETFs vs. Stocks. 7 Reasons ETFs Are Better