Our years of performance testing reveal the world’s best-performing stock portfolios are Berkshire Hathaway, CANSLIM, GreenBlatt’s Magic Formula, and the FAANG portfolio.
I share examples and show you how to implement them.
Look no further if you want to be inspired by the best stock portfolio examples and strategies. I have compiled 13 excellent example portfolios that will enable you to choose the right strategy to kick-start your investing journey.

The research, screening, and implementation of the portfolios in this article were performed with Stock Rover, our valued partner and review winner for the best portfolio management tool.
1. Berkshire Hathaway Value Stock Portfolio
Warren Buffett’s Berkshire Hathaway portfolio’s largest stock holdings in 2023 are Bank of America (BAC), Coca-Cola (KO), Kraft Heinz (KHC), Apple (AAPL), Wells Fargo (WFC), American Express (AXP), US Bancorp (USB), Bank of New York Mellon (BK), and Sirius XM (SIRI). You could create a portfolio by placing 10% of your investment in each stock.
One way to think of Berkshire Hathaway (NYSE: BRK.B) is as a giant stock portfolio.
Thus, you can create your Buffett stock portfolio by reading lists of stocks Berkshire Hathaway owns. The thinking behind this portfolio is that its performance could replicate Warren Buffett’s success.
The Berkshire Hathaway Stock Portfolio
- Davita Inc – 40.1% Ownership
- Occidental Petroleum – 20.9% Ownership
- American Express – 20.3% Ownership
- Bank of America Corp – 12.8% Ownership
- Coca-Cola – 9.2% Ownership
- Bank of New York Mellon – 8.3% Ownership
- Apple – 5.6% Ownership
- General Motors – 3.6% Ownership
Get The Berkshire Hathaway Portfolio In Stock Rover Now
Warren Buffett & Berkshire Hathaway own sizable stakes in many companies that are household names. Those companies include General Motors, American Express, and 5.6% of Apple, one of the world’s largest companies. Wells Fargo, Bank of New York Mellon, and 9.2% of Coca-Cola are also significant holdings.
This strategy has risks because it heavily focuses on the traditional economy, heavy industry, energy, finance, real estate, tech, and the US economy. However, Buffett has done well with it. Warren Buffett Berkshire Hathaway is one of the most stable and successful companies ever, having increased by 817% over the last 20 years.

View This Chart & Financials Live on TradingView
2. LST BTM Growth Stocks Portfolio
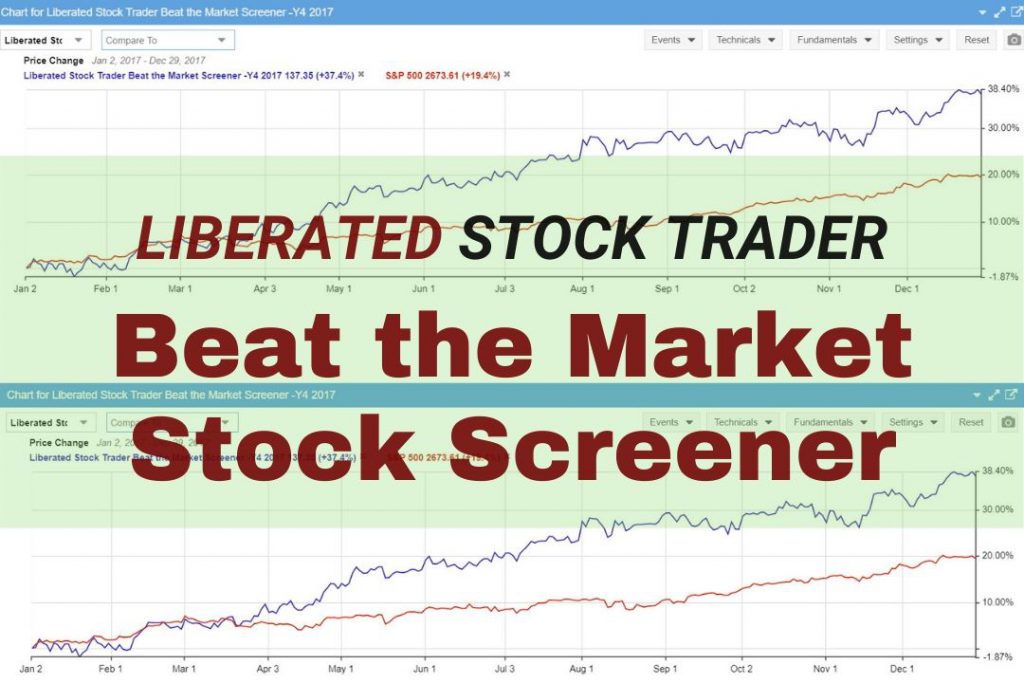
The Liberated Stock Trader Beat the Market Portfolio (BTM) seeks to select stocks with a significant chance of beating the S&P500 returns. The screener uses growth in free cash flow and explosive EPS growth. Combining this with Joel Greenblatt’s ROC and Earnings Yield formulas, “the Magic Formula,” we have a selection of stocks that beat the market 5 in the last seven years.
In this article, I will discuss the criteria and the methodology that goes into the screener and cover the current results and the results of 8 years of backtesting.
This work has been made possible due to the fabulous work done by the team at our partner Stock Rover, who created a stock research and screening platform that won our in-depth Best Stock Screener Review for the last two years.
Why is Stock Rover so special when creating superior stock screeners? Because Stock Rover maintains a clean 10-year historical database of hundreds of vital ratios, calculations, and metrics. This means you can travel back in time to test if your stock selection criteria have worked in the past.
This Liberated Stock Trader Beat the Market Screener (LST BTM) is built into the Stock Rover library and is available to all Stock Rover Premium Plus Subscribers.
Get the Beat the Market Screener Exclusively on Stock Rover
Liberated Stock Trader Beat the Market Portfolio Performance.
| 9 Year Performance | S&P500 % Gain Jan 1st to Dec 31st | LST Beat the Market Growth Strategy % Gain | Result |
| 2013 | 29.8% | 49.4% | Beat |
| 2014 | 11.4% | 16.9% | Beat |
| 2015 | -0.7% | 2.6% | Beat |
| 2016 | 9.5% | 23.2% | Beat |
| 2017 | 19.4% | 37.4% | Beat |
| 2018 | -6.2% | -24.9% | Lost |
| 2019 | 28.9% | 46.8% | Beat |
| 2020 | 18.4% | 51.8% | Beat |
| 2021 | 26.9% | 27.2% | Beat |
| Average Yearly Return | 15.27% | 25.6% | Beat |
9-Year Results Based on $100,000 Invested.
| Year | S&P500 Index Returns | LST Beat the Market Growth Strategy |
| Initial Investment | $100,000 | $100,000 |
| 2013 | $129,800 | $149,400 |
| 2014 | $144,597 | $174,648 |
| 2015 | $134,475 | $179,189 |
| 2016 | $147,250 | $220,761 |
| 2017 | $175,817 | $303,326 |
| 2018 | $164,916 | $227,797 |
| 2019 | $212,577 | $334,407 |
| 2020 | $251,961 | $507,630 |
| 2021 | 319,397 | $645,706 |
| Cumulative 9-Year % Gain | +219% | +546% |
| LST Beat The Market By: | 102% |
As you can see, the S&P500 turned $100,000 into $251,961 over the last eight years. The LST Beat the Market Screener turned $100,000 into $507,630 over the same period. This means the LST Beat the Market Screener outperformed the market by 102%
Beat The Market Example Portfolio Stocks
| Ticker | Company | Industry | Price | Stock Rover Growth Score | 1Y Return vs S&P 500 |
| ADI | Analog Devices | Semiconductors | $184.77 | 99 | 24.60% |
| FISV | Fiserv | Information Technology Services | $111.77 | 97 | 23.80% |
| MELI | MercadoLibre | Internet Retail | $1,191.79 | 99 | 6.90% |
| CDNS | Cadence Design Sys | Software – Application | $205.27 | 97 | 37.10% |
| STM | STMicroelectronics | Semiconductors | $49.21 | 98 | 22.10% |
| WDS | Woodside Energy Group | Oil & Gas E&P | $21.29 | 100 | 6.00% |
| MCHP | Microchip Technology | Semiconductors | $77.55 | 97 | 12.10% |
| IMO | Imperial Oil | Oil & Gas Integrated | $47.39 | 98 | 17.30% |
| FANG | Diamondback Energy | Oil & Gas E&P | $128.55 | 99 | 7.90% |
| IR | Ingersoll Rand | Specialty Industrial Machinery | $55.79 | 98 | 23.60% |
| DECK | Deckers Outdoor | Footwear & Accessories | $448.14 | 98 | 76.50% |
| CSL | Carlisle Companies | Building Products & Equipment | $217.43 | 97 | -0.40% |
| TFII | TFI International | Trucking | $114.41 | 97 | 15.50% |
| WSC | WillScot Mobile Mini | Rental & Leasing Services | $44.86 | 95 | 24.20% |
| PFGC | Performance Food Gr | Food Distribution | $57.85 | 99 | 21.50% |
| GPK | Graphic Packaging Holding | Packaging & Containers | $24.82 | 98 | 37.70% |
| SAIA | Saia | Trucking | $275.80 | 96 | 9.80% |
| SMCI | Super Micro Computer | Computer Hardware | $110.90 | 99 | 171.40% |
| CHRD | Chord Energy | Oil & Gas E&P | $129.02 | 99 | 16.10% |
| FOX | Fox Factory Hldg | Auto Parts | $119.73 | 98 | 32.20% |
| IPAR | Inter Parfums | Household & Personal Products | $140.93 | 97 | 79.80% |
| ACLS | Axcelis Technologies | Semiconductor Equipment & Materials | $129.18 | 99 | 67.00% |
| TKC | Turkcell Iletisim | Telecom Services | $4.43 | 99 | 32.70% |
| LTHM | Livent | Specialty Chemicals | $20.78 | 100 | -8.70% |
| BSM | Black Stone Minerals | Oil & Gas E&P | $15.20 | 97 | 38.70% |
| ERF | Enerplus | Oil & Gas E&P | $14.34 | 98 | 19.20% |
| PR | Permian Resources | Oil & Gas E&P | $9.90 | 100 | 31.90% |
| LRN | Stride | Education & Training Services | $39.53 | 97 | 20.90% |
| MHO | M/I Homes | Residential Construction | $61.08 | 97 | 42.60% |
| VIST | Vista Energy | Oil & Gas E&P | $18.46 | 97 | 115.60% |
| GRBK | Green Brick Partners | Residential Construction | $34.26 | 81 | 72.20% |
| STRL | Sterling Infrastructure | Engineering & Construction | $38.42 | 98 | 48.80% |
| DMLP | Dorchester Minerals | Oil & Gas E&P | $27.86 | 100 | 34.60% |
| RICK | RCI Hospitality Hldgs | Restaurants | $77.11 | 98 | 32.10% |
| NRP | Natural Resources | Thermal Coal | $52.91 | 97 | 45.40% |
| Summary | 98 | 30.70% |
How to Beat the Stock Market With Stock Rover

I love Stock Rover so much that I spent 2 years creating a growth stock investing strategy that has outperformed the S&P 500 by 102% over the last eight years. I used Stock Rover's excellent backtesting, screening, and historical database to achieve this.
This Liberated Stock Trader Beat the Market Strategy (LST BTM) is built exclusively for Stock Rover Premium Plus subscribers.
3. ESG Ethical Investment Portfolio
Over the last five years, or March 2023, Stock Rovers ESG model portfolio has outperformed the S&P500 by 77%. ESG portfolios can be profitable when investing in companies that demonstrate environmental sustainability, social responsibility, and good corporate governance, which is good for investors.
If you care about the environment and the state of the planet, you are probably already taking steps to try and reduce your impact on the world. Perhaps, like me, you have an electric or hybrid car, and you are reducing your use of plastics, recycling, and eating more vegetarian or vegan dishes.
However, you can do more to help promote and encourage more companies to adopt better environmental, social, and governance (ESG) best practices. You can put your money to work in companies with robust ESG policies.
ESG Investing Principles
ESG investing (Environmental, Social & Governance) enables ethical investors to channel their capital to companies that demonstrate environmental sustainability, social responsibility, and good corporate governance. ESG investing can be done by investing in specific companies or some of the new ESG Exchange-Traded Funds.
| Environment | Social | Governance |
| Air Quality | Labor Policy | Executive Pay |
| Green Energy | Community Impact | Ethical Practices |
| Waste Mgt | Equal Employment | Transparency |
| Hazardous Materials | Equal Opportunity | Accounting & Taxes |
ESG Portfolio Performance
Investing in companies doing the right thing ethically is not bad for your investing returns. The table below shows that the portfolio performance for the Top 20 ESG Companies for the previous five years was +85%, compared to a return for the NASDAQ 100 of 70.6% and only 63% for the S&P500.
ESG Portfolio Performance Over 5 Years
| ESG Investment | 2 Year Performance | 5 Year Performance |
| Stock Rover Top 20 ESG Stocks | +40% | +85% |
| S&P500 Index | +28.5% | +63% |
| NASDAQ 100 Index | +36.9% | +70.6% |
Interestingly, some of the best companies in America are pushing hard to improve their ESG profile, so, unsurprisingly, the ESG portfolio performs well. What is surprising is that ESG companies can outperform the market.
Stock Rover Top 20 ESG Stocks
| Ticker | Company | Industry | Price | 1Y Return vs. S&P 500 | 2-Year Return vs. S&P 500 | 5-Year Return vs. S&P 500 |
| NVDA | NVIDIA | Semiconductors | $265.31 | 4.80% | 107.20% | 275.30% |
| AAPL | Apple | Consumer Electronics | $158.15 | 1.90% | 27.90% | 221.10% |
| MSFT | Microsoft | Software – Infrastructure | $276.38 | 2.30% | 16.30% | 149.30% |
| PG | Procter & Gamble | Household & Personal Products | $145.95 | 9.60% | 10.10% | 55.60% |
| NEE | NextEra Energy | Utilities – Regulated Electric | $75.44 | 2.60% | 2.30% | 45.90% |
| MA | Mastercard | Credit Services | $354.62 | 12.60% | -4.80% | 42.70% |
| A | Agilent Technologies | Diagnostics & Research | $133.07 | 8.70% | 5.60% | 39.60% |
| GOOGL | Alphabet | Internet Content & Information | $102.46 | -17.10% | -4.00% | 31.40% |
| V | Visa | Credit Services | $221.81 | 13.40% | 3.30% | 27.10% |
| VRTX | Vertex Pharmaceuticals | Biotechnology | $308.47 | 33.10% | 40.40% | 22.70% |
| HD | Home Depot | Home Improvement Retail | $281.27 | 1.90% | -5.70% | 16.70% |
| EW | Edwards Lifesciences | Medical Devices | $80.92 | -15.60% | -4.40% | 10.10% |
| CRM | Salesforce | Software – Application | $191.26 | -0.10% | -11.70% | -2.20% |
| JNJ | Johnson & Johnson | Drug Manufacturers – General | $153.30 | 0.40% | -5.20% | -25.50% |
| BLK | BlackRock | Asset Management | $648.32 | 0.90% | -11.20% | -26.50% |
| GILD | Gilead Sciences | Drug Manufacturers – General | $79.58 | 50.80% | 30.50% | -34.60% |
| ECL | Ecolab | Specialty Chemicals | $160.21 | 2.70% | -26.30% | -37.50% |
| DIS | Walt Disney | Entertainment | $95.62 | -20.70% | -53.70% | -65.30% |
| INTC | Intel | Semiconductors | $29.18 | -30.40% | -54.30% | -98.80% |
| MMM | 3M | Conglomerates | $101.49 | -18.20% | -48.00% | -108.00% |
| Summary | 5.00% | 19.80% | 77.40% |
Get The ESG Ethical Portfolio In Stock Rover Now
4. The CANSLIM Growth Stock Portfolio
The CANSLIM portfolio is focused on selecting growth stocks with the intention of outperforming the market. CANSLIM is a stock investing strategy designed by William J. O’Neil to produce market-beating profit performance. Using the CAN SLIM criteria in your investing should mean profitable returns. Current Earnings, Annual Earnings, New Products, Supply, Leaders, Institutional Sponsorship, and Market Direction are vital criteria.
CAN SLIM has the following stock selection criteria:
- C – Current Earnings
- A – Annual Earnings
- N – New Products or Management
- S – Supply and Demand
- L – Leaders
- I – Institutional Ownership
- M – Market Direction
CANSLIM Historical Results – CANGX ETF
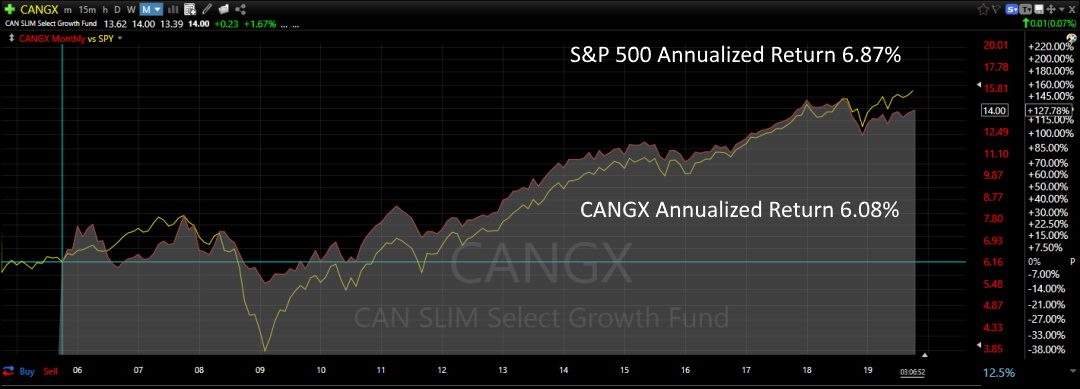
The CAN SLIM Select Growth Fund (Ticker: CANGX) was established in 2005 to implement the CANSLIM Select strategy into an ETF so that investors can buy the ETF rather than implement it themselves. This is a great idea, except that the CANGX fund does not exhibit the expected 0.94% return per month higher than the underlying index. In fact, from my calculations, it has trailed the S&P 500 by 0.79% per year.
These facts do not necessarily invalidate the strategy; they imply that it relies on good portfolio management. The process of rotating the stocks in and out of the portfolio needs to be improved. Also, cash allocation is important; if you only allocate 75% of the cash and the rest is in bonds, you may miss out on the price move. Additionally, moving to cash during the stock market downtrends would be best, as the M in CANSLIM (Market Direction) suggests. If you do not do this on time, you may suffer additional losses.
The Stock Rover CANSLIM Stock Portfolio Example
| Ticker | Company | Industry | Price | Growth Score | 2-Year Return vs. S&P 500 |
| TA | TravelCenters Of America | Specialty Retail | $86.60 | 82 | 218.30% |
| ANET | Arista Networks | Computer Hardware | $167.96 | 99 | 125.20% |
| NSSC | NAPCO Security Techs | Security & Protection Services | $38.34 | 98 | 122.50% |
| CLMB | Climb Global Solutions | Electronics & Computer Distribution | $52.76 | 96 | 114.90% |
| INTT | inTest | Semiconductor Equipment & Materials | $20.40 | 98 | 86.90% |
| PLPC | Preformed Line Products | Electrical Equipment & Parts | $123.95 | 97 | 85.10% |
| GAERF | Central North Airport Gr | Airports & Air Services | $8.25 | 89 | 63.70% |
| FCN | FTI Consulting | Consulting Services | $195.99 | 88 | 37.20% |
| WPM.TO | Wheaton Precious Metals | Gold | $64.17 | 86 | 34.90% |
| AHODF | Koninklijke Ahold Delhaiz | Grocery Stores | $31.96 | 79 | 19.30% |
| DBOEF | Deutsche Boerse | Financial Data & Stock Exchanges | $195.33 | 92 | 18.90% |
| SNYNF | Sanofi | Drug Manufacturers – General | $107.05 | 80 | 13.70% |
| SVKEF | Skandinaviska Enskilda | Banks – Regional | $12.81 | 89 | 10.20% |
| KBH | KB Home | Residential Construction | $40.09 | 67 | -11.60% |
| ATLFF | Atlas Copco | Specialty Industrial Machinery | $10.48 | 83 | -16.10% |
| XVIPF | Xvivo Perfusion | Medical Devices | $22.70 | 95 | -33.80% |
| Summary | 89 | 55.60% |
Get The CANSLIM Portfolio In Stock Rover Now
To summarize, there is plenty of positive testing to prove the system is beneficial to investors’ performance, but how you manage the buying and selling of stocks will be the big differentiator in profits.
- Related Article: Use a CANSLIM Stock Screener Strategy To Beat the Market
5. Greenblatt’s Magic Formula Investing Portfolio
The Magic Formula Investing Portfolio is a market-beating system developed by the investing legend Joel Greenblatt in his best-selling book “The Little Books that Still Beats the Market.”
Greenblatt’s strategy is called the Magic Formula, based on two specific formulas: the Greenblatt ROC and the Greenblatt Earnings Yield.
I have backtested this system personally, and it works very well; it is a little high maintenance, but the lessons contained within the book are vital.
Greenblatt Return on Capital Ratio
Good Companies Make Great Use of Assets!
This variation of Return on Capital takes Earnings before Interest and Taxation (EBIT) as a percent of Net Property, Plant, and Equipment (PPandE) plus Current Assets.
Greenblatt Earnings Yield
This variation of earnings yield compares Earnings Before Interest & Taxation (EBIT) to Enterprise Value. Joel Greenblatt uses it in his bestselling book The Little Book That Beats the Market.
Using the Magic Formula to Find Stocks
You can register with https://www.magicformulainvesting.com/, the website accompanying the book, to get free access to a basic stock screener that implements the magic formula.
The problem is that the site provides no ability to change screener parameters or help you specify your filters for companies. It will also not help you track which companies you want to invest in or show your past performance or any real financial data.
How to Utilize the Magic Formula
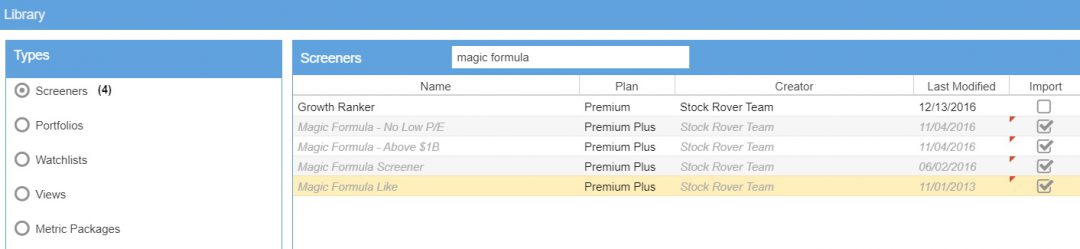
Stock Rover has the Magic Formula Screener built-in and is available for Premium Plus members, which gives you access to all the criteria and the database with a unique 10-year history. It will also allow you to implement all our Warren Buffett screeners, our full list of stock screening strategies, and our Dividend growth and dividend yield strategies.
Importing the Magic Formula Strategy into Stock Rover
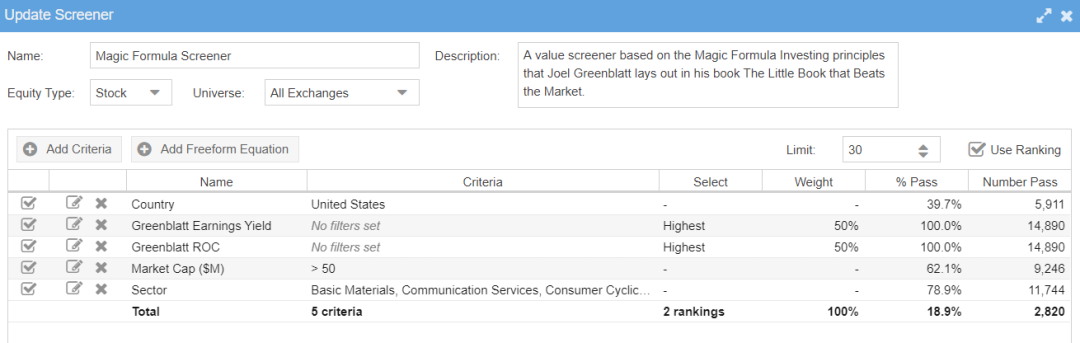
The Magic Formula Criteria
Joel Greenblatt specifically suggests you sell all your “Magic Formula” stocks at the end of the year, re-run the screener, and buy the newly recommended shares on the first trading day of the new year to achieve the market-beating results.
Stock Rover’s Magic Formula Portfolio
| Ticker | Company | Industry | Price | 2-Year Return vs. S&P 500 |
| AMR | Alpha Metallurgical | Coking Coal | $151.79 | 1105.60% |
| HDSN | Hudson Technologies | Specialty Chemicals | $7.97 | 446.50% |
| NRP | Natural Resources | Thermal Coal | $52.91 | 303.60% |
| ARCH | Arch Resources | Thermal Coal | $132.37 | 270.10% |
| SPLP | Steel Partners Holdings | Conglomerates | $43.00 | 202.10% |
| PBF | PBF Energy | Oil & Gas Refining & Marketing | $42.52 | 196.00% |
| ARL | American Realty Investors | Real Estate – Development | $25.31 | 183.80% |
| ERF | Enerplus | Oil & Gas E&P | $14.34 | 183.50% |
| APA | APA | Oil & Gas E&P | $35.38 | 90.30% |
| TCI | Transcontinental Realty | Real Estate Services | $41.91 | 88.70% |
| BLDR | Builders FirstSource | Building Products & Equipment | $85.43 | 80.10% |
| SQM | Sociedad Quimica Y Minera | Specialty Chemicals | $81.07 | 72.30% |
| CF | CF Industries Holdings | Agricultural Inputs | $69.86 | 53.80% |
| EQNR | Equinor | Oil & Gas Integrated | $27.56 | 50.90% |
| ZIM | ZIM Integrated Shipping | Marine Shipping | $22.40 | 50.20% |
| BNTX | BioNTech | Biotechnology | $123.60 | 27.70% |
| BCC | Boise Cascade | Building Materials | $61.70 | 16.40% |
| GSM | Ferroglobe | Other Industrial Metals & Mining | $4.53 | 15.20% |
| INVA | Innoviva | Biotechnology | $11.38 | -7.60% |
| MATX | Matson | Marine Shipping | $60.30 | -11.30% |
| GPRK | GeoPark | Oil & Gas E&P | $10.89 | -29.40% |
| EEX | Emerald Holding | Advertising Agencies | $3.85 | -35.70% |
| FOR | Forestar Group | Real Estate – Development | $14.95 | -38.80% |
| SBGI | Sinclair Broadcast Group | Entertainment | $15.33 | -46.10% |
| MRVI | Maravai LifeSciences | Biotechnology | $13.77 | -61.90% |
| SENS | Senseonics Holdings | Medical Devices | $0.71 | -77.30% |
| CAN | Canaan | Computer Hardware | $2.69 | -87.70% |
| DO | Diamond Offshore Drilling | Oil & Gas Drilling | $11.25 | – |
| GTX | Garrett Motion | Auto Parts | $7.16 | – |
| SDRL | Seadrill | Oil & Gas Drilling | $38.05 | – |
| Summary | 112.60% |
Get The Magic Formula Portfolio In Stock Rover Now
Beat The Market, Avoid Crashes & Lower Your Risks
Nobody wants to see their hard-earned money disappear in a stock market crash.
Over the past century, the US stock market has had 6 major crashes that have caused investors to lose trillions of dollars.

The MOSES Index ETF Investing Strategy will help you minimize the impact of major stock market crashes. MOSES will alert you before the next crash happens so you can protect your portfolio. You will also know when the bear market is over and the new rally begins so you can start investing again.
MOSES Helps You Secure & Grow Your Biggest Investments
★ 3 Index ETF Strategies ★
★ Outperforms the NASDAQ 100, S&P500 & Russell 3000 ★
★ Beats the DAX, CAC40 & EURO STOXX Indices ★
★ Buy & Sell Signals Generated ★
MOSES Helps You Sleep Better At Night Knowing You Are Prepared For Future Disasters
6. The FAANG Growth Stocks Portfolio
The FAANG stock portfolio focuses on the highly profitable tech sector giants. FAANG is an attractive portfolio example because the FAANGs have a high margin of safety because of their huge market capitalizations. Three FAANGS, Apple, Alphabet, and Amazon, had market capitalizations exceeding $1 trillion in 2023. Facebook (META), Amazon (AMZN), Apple (AAPL), Netflix (NFLX), and Alphabet (GOOG), formerly Google, are five of the fastest-growing stocks in history.
People buy FAANGs because they think their money is safe and will grow.
The FAANG Stock Portfolio
| Ticker | Company | Industry | Price | 1Y Return vs S&P 500 | 2-Year Return vs. S&P 500 | 5-Year Return vs. S&P 500 | Cap (USD M) |
| AAPL | Apple | Consumer Electronics | $158.28 | 2.10% | 29.00% | 228.70% | $2,504,297 |
| GOOGL | Alphabet | Internet Content & Information | $102.46 | -16.70% | -1.90% | 37.70% | $1,313,834 |
| AMZN | Amazon.com | Internet Retail | $98.04 | -29.50% | -38.90% | -34.90% | $1,004,641 |
| NVDA | NVIDIA | Semiconductors | $265.31 | 6.90% | 103.90% | 309.30% | $655,315 |
| META | Meta Platforms | Internet Content & Information | $202.84 | 2.40% | -31.40% | -32.60% | $525,890 |
| NFLX | Netflix | Entertainment | $327.66 | -1.40% | -38.60% | -56.90% | $145,922 |
7. The Bill Gates Portfolio
The Bill Gates portfolio contains some interesting stocks. As you can imagine, Microsoft, Apple, and his great friend Warren Buffett’s Berkshire Hathaway stocks are in his portfolio.
I am not saying Bill Gates is an investing genius, but he is a genius nonetheless. I have a huge respect for Mr. Gates; not only is he one of the world’s richest men, but he has given so much back to the world in monetary measure and in his time and effort. The amount of lives he and Melinda have helped save is countless.
But how is the performance of Mr. Gate’s portfolio? Well, according to Stock Rover’s excellent portfolio backtesting and performance comparison charting, Bill has managed to beat the S&P 500 by 54% since 2007, which is impressive.
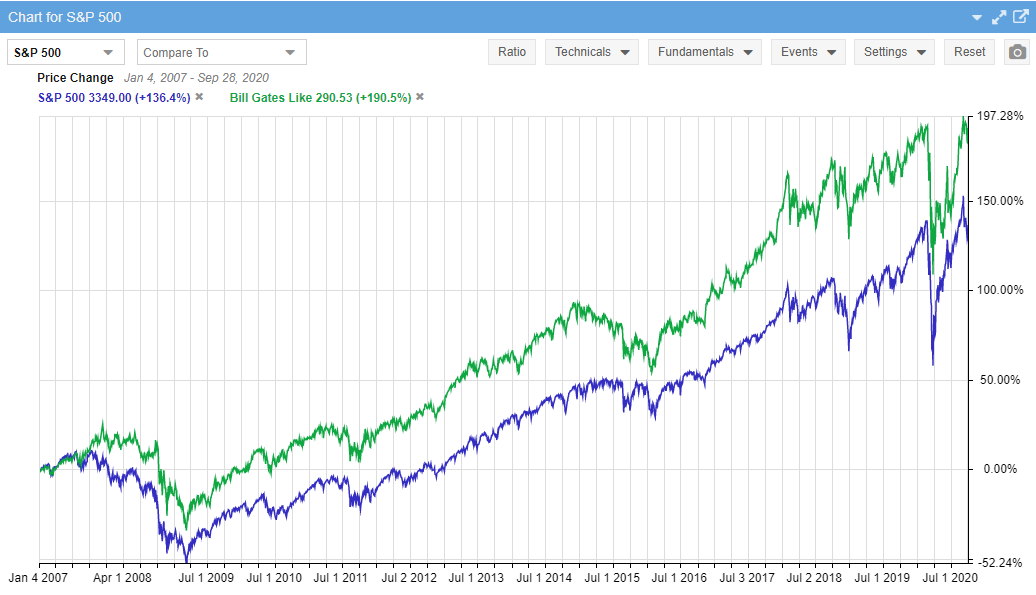
We do not know the origins of Bill Gates’s investing methodology, but we can be sure Warren Buffett and his history have influenced him as a technology mogul. However, as you can see from the most recent performance, the Bill Gates portfolio has not done well, only returning -0.4% versus the S&P 500.
The Bill Gates Stock Portfolio
| Ticker | Company | Industry | 1Y Return vs S&P 500 | 2-Year Return vs. S&P 500 | 5-Year Return vs. S&P 500 |
| AAPL | Apple | Consumer Electronics | 2.10% | 29.00% | 228.70% |
| AMZN | Amazon.com | Internet Retail | -29.50% | -38.90% | -34.90% |
| BRK.B | Berkshire Hathaway | Insurance – Diversified | -4.80% | 14.60% | -11.80% |
| WMT | Walmart | Discount Stores | 13.10% | 7.00% | 17.40% |
| BABA | Alibaba Group Holding | Internet Retail | -12.80% | -65.20% | -118.50% |
| UPS | United Parcel Service | Integrated Freight & Logistics | 1.00% | 14.90% | 47.90% |
| CAT | Caterpillar | Farm & Heavy Construction Machinery | 10.80% | -3.90% | 2.00% |
| CNI | Canadian National Railway | Railroads | -3.30% | -1.60% | 8.20% |
| WM | Waste Management | Waste Management | 10.90% | 19.00% | 35.90% |
| FDX | FedEx | Integrated Freight & Logistics | 10.20% | -22.20% | -64.80% |
| CCI | Crown Castle | REIT – Specialty | -14.30% | -24.20% | -28.80% |
| ECL | Ecolab | Specialty Chemicals | 2.40% | -26.20% | -40.60% |
| KOF | Coca-Cola Femsa | Beverages – Non-Alcoholic | 63.50% | 83.70% | -16.60% |
| LBTYK | Liberty Global | Telecom Services | -15.10% | -27.90% | -103.50% |
| LBTYA | Liberty Global | Telecom Services | -16.80% | -31.50% | -108.10% |
| TV | Grupo Televisa | Telecom Services | -47.10% | -52.20% | -134.70% |
| SDGR | Schrodinger | Health Information Services | -13.40% | -67.30% | – |
| LILA | Liberty Latin America | Telecom Services | -9.60% | -44.50% | -125.70% |
| LILAK | Liberty Latin America | Telecom Services | -9.00% | -45.20% | -125.40% |
| ARCO | Arcos Dorados Holdings | Restaurants | 2.60% | 49.80% | -72.70% |
| Summary | 1.30% | 8.50% | -0.40% |
Get The Bill Gates Portfolio In Stock Rover Now
8. The NAMPOF Growth Stock Portfolio
A great portfolio alternative to the FAANG stock is the NAMPOF portfolio. NAMPO is a basket of tech stocks composed of NVIDIA (NASDAQ: NVDA), Apple (NASDAQ: AAPL), Microsoft (NASDAQ: MSFT), PayPal (NASDAQ: PYPL), Oracle (NYSE: ORCL), and Facebook (NASDAQ: FB).
NVIDIA, Apple, Microsoft, and Oracle are in the NAMPOF Stock Portfolio because those stocks pay dividends. I consider Oracle, Microsoft, PayPal, and NVIDIA value investments because they are relatively cheap and underappreciated by the markets.
The NAMPOF Technology Stock Portfolio 2023
| Ticker | Company | Industry | Price | 1Y Return vs S&P 500 | 2-Year Return vs. S&P 500 | 5-Year Return vs. S&P 500 | Cap (USD M) |
| AAPL | Apple | Consumer Electronics | $158.28 | 2.10% | 29.00% | 228.70% | $2,504,297 |
| MSFT | Microsoft | Software – Infrastructure | $276.38 | 2.90% | 15.90% | 161.50% | $2,057,318 |
| GOOGL | Alphabet | Internet Content & Information | $102.46 | -16.70% | -1.90% | 37.70% | $1,313,834 |
| AMZN | Amazon.com | Internet Retail | $98.04 | -29.50% | -38.90% | -34.90% | $1,004,641 |
| NVDA | NVIDIA | Semiconductors | $265.31 | 6.90% | 103.90% | 309.30% | $655,315 |
| META | Meta Platforms | Internet Content & Information | $202.84 | 2.40% | -31.40% | -32.60% | $525,890 |
| ORCL | Oracle | Software – Infrastructure | $90.14 | 23.20% | 29.40% | 49.90% | $243,360 |
| NFLX | Netflix | Entertainment | $327.66 | -1.40% | -38.60% | -56.90% | $145,922 |
| PYPL | PayPal Holdings | Credit Services | $73.30 | -24.60% | -72.70% | -69.80% | $82,929 |
| Cash | Cash | $1.00 | 0.00% | 0.00% | 0.00% | $0 | |
| Summary | -5.00% | 12.50% | 92.60% | $943,502 |
9. High Growth Dividend Stocks Portfolio
Do you want to find companies that are continually raising their dividends? It is a wise move, as businesses that have significant dividend growth are usually growing sales and market dominance.
What if you could find companies that have experienced dividend growth over the last ten years and are on sale at bargain-basement prices by the stock market? Welcome to the Dividend Growth + High Margin of Safety strategy.
10-Year Dividend Growth Strategy
The Dividend Kings or Dividend Aristocrats strategy essentially means investing in companies with a long history of continually paying and increasing dividends.
For this, you will need a stock screener with a significantly sizeable historical database (at least ten years) of earnings and dividend payments, such as Stock Rover.
The criteria shown here is the calculation for ten years.
10-Year Dividend Growth Screening Criteria
- Dividend Yield > 1.5%. This is a simple filter designed to ensure only companies paying a dividend above 1.5% are listed—anything less than 1.5% will not even payout in line with inflation.
- Dividend 1 Year Change > 8%. We want to see only companies that have increased dividends in the last fiscal year by over 8%.
- Dividend 3-Year Change > 8%. Next, we filter down to companies with at least an average increase of 8% over the last three years.
- Dividend 5-Year Change > 8%. Again, only those companies increasing dividends by more than 8% over the last five years.
- Dividend 10-Year Change > 8%. You get the idea. :)
- Payout Ratio >10 < 40. The payout ratio ensures the company makes enough profits to continue paying the dividends and sustain the increases. You can reduce the “<10” to see more stocks in the scan. We do not want companies paying more than 40% of their profits in dividends; they must retain cash flow for future growth and capital investments.
- Sales 5-Year Average (%) > 4%. This filter is designed to ensure that the company is increasing sales, at least on average, to pay for the above growth in dividends.
- Margin of Safety > 0. (Exclusive to Stock Rover) For me, the most important criterion is the Margin of Safety, using Warren Buffett’s calculation, the forward discounted cash flow (see our article on Intrinsic Value). Essentially, the higher the margin of safety, the more of a discount you are buying a stock for.

Dividend Growth Screener – Criteria Implemented Into Stock Rover
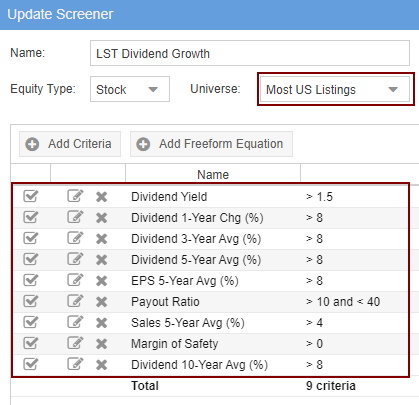
These criteria would typically return a list of only 5% of the NYSE or NASDAQ listed stocks.
Stocks in a High-Dividend Yield Portfolio
| Ticker | Company | 5Y Return vs. S&P 500 | Dividend Yield | Dividend Per Share | Earnings Yield | Return on Equity |
| AGM | Federal Agricultural | 93.40% | 4.80% | $3.20 | 11.80% | 10.30% |
| GRP.U | Granite REIT | 70.30% | 3.90% | $2.20 | 8.10% | 10.10% |
| AGM.A | Federal Agricultural | 65.10% | 5.50% | $3.20 | 13.40% | 10.30% |
| AQN | Algonquin Power | 62.50% | 4.30% | $0.62 | 6.80% | 12.40% |
| NRG | NRG Energy | 20.60% | 4.00% | $1.20 | 55.00% | 239.40% |
| STLD | Steel Dynamics | 4.90% | 3.40% | $1.00 | 8.40% | 12.90% |
| JPM | JPMorgan Chase | -13.00% | 3.80% | $3.60 | 7.80% | 8.90% |
| OGS | ONE Gas | -14.50% | 3.10% | $2.16 | 5.10% | 8.50% |
| CSCO | Cisco Systems | -15.90% | 3.70% | $1.44 | 6.80% | 29.60% |
Build Your High Dividend Yield Portfolio In Stock Rover Now
10. Warren Buffett’s 90/10 Portfolio
In his 2013 Letter to Shareholders, Buffett proposed a simple hybrid portfolio for ordinary people.
Buffett’s model portfolio comprises 90% S&P 500 stocks and 10% short-term government bonds. Buffett designed this defensive portfolio for the average investor he thinks needs asset protection more than growth.
Buffett recommends investors buy a low-cost S&P 500 Index fund for the stocks, but you could use the same strategy for value stocks. The danger with the 90/10 Portfolio is that it relies on American stocks.
In today’s world, a 90/10 portfolio with 30% US stocks, 30% European Stocks, 30% Chinese stocks, and 10% bonds could be a good idea. Global diversification could be a smart strategy because the coronavirus demonstrated how vulnerable national and regional economies are to outside threats.
11. Bernstein’s No Brainer Stock Portfolio
Bernstein recommends this simple strategy in his book The Intelligent Asset Allocator. Bernstein bases his plan on academic research and historical performance. He designed the No Brainer Portfolio for long-term performance.
The No Brainer Portfolio comprises 25% Bonds, 25% European stocks, 25% US small-cap stocks, and 25% S&P 500 stocks. Simplicity is this strategy’s advantage.
The No Brainer Portfolio’s disadvantage is high exposure to the risks of Europe and the US small-cap market.
Today, a person could modify the No Brainer by replacing the US small-cap stocks or the European stocks with 25% Chinese stocks.
Another strategy could be replacing European or US small-cap stocks with emerging markets.
12. Diversified Stock Portfolio Example
Paul Merriman thinks investors must diversify among asset classes to protect their assets. To that end, Merriman offers a simple formula for buying stocks by asset class. Merriman proposes dividing the portfolio by ten and making 10% of investments in different kinds of stock.
Here’s Merriman’s proposal:
- 10% S&P 500
- 10% US Large-Cap Value
- 10% US Small-Cap Blend
- 10% U.S. Small Cap Value
- 10% US REITs
- 10% International Large Cap Blend
- 10% International Large Cap Value
- 10% International Small Cap Blend
- 10% International Small Cap Value
- 10% Emerging Markets
The advantage of this model is that it is simple and provides a high level of diversification. Diversification protects assets and limits exposure to many risks.
The disadvantage of Merriman’s proposal is that it will only generate small gains. An investor could miss big share value growth in the S&P 500 or the Nasdaq 100. This portfolio could also lock in risks from small caps or REITs.
13. The Ivy League Stock Portfolio
America’s famous Ivy League Universities are among the world’s largest and most successful private investors. Forbes writer Simon Moore thinks ordinary people can make money by copying the Harvard, Yale, and Stanford portfolios.
The three universities’ portfolios include 35% US Stocks, 28% bonds, 15% foreign stocks, 11% commodities, and 11% real estate. The advantage of this portfolio is that it puts most of the money into the highest growth in US stocks.
The disadvantage to the Ivy League Portfolio is that you must invest in more complex investments, including commodities. Thus, an Ivy League portfolio is a good choice for high-income individuals.
An investor could modify the Ivy League Portfolio by eliminating real estate and commodities. The investor could replace the real estate with REITs and the commodities with stock in commodities-producing businesses such as oil companies or Exchange Traded Funds (ETFs).
Stock Rover 4.7/5⭐ : My Top Pick for Smart Investors
Investing In Stocks Can Be Complicated. Stock Rover Makes It Easy.
★
Growth Investing - with industry-leading
Research Reports ★
★ Value Investing - using Warren Buffett's Fair Value and Margin-of-Safety ★
★ Income Investing - rank by yield, growth, quality, and safety using 650 metrics ★

"I have been researching and investing in stocks for 20 years! I now manage all my long-term investments using Stock Rover." — Barry D. Moore, Founder: LiberatedStockTrader.com
Final Thoughts
The team and I sincerely hope you find inspiration from these examples of winning stock portfolios. What inspiration did you get from this article? Share your thoughts in the comments below.
- Related Article: 13 Legendary Strategies to Beat the Market That [Really] Work
You want to be a successful stock investor but don't know where to start.
Learning stock market investing on your own can be overwhelming. There's so much information out there, and it's hard to know what's true and what's not.

Liberated Stock Trader Pro Investing Course
Our pro investing classes are the perfect way to learn stock investing. You will learn everything you need to know about financial analysis, charts, stock screening, and portfolio building so you can start building wealth today.
★ 16 Hours of Video Lessons + eBook ★
★ Complete Financial Analysis Lessons ★
★ 6 Proven Investing Strategies ★
★ Professional Grade Stock Chart Analysis Classes ★
I like your style and thinking Rajeev.
Barry
The Dividend Growth portfolio does appeal to me. After that, I would prefer Ivy League Stock Portfolio because of it’s inclusion of commodities which can shine at times of inflation such as today.
Loved reading this article – the insights are amazing and validates some of the investments I have made.