Bull ETFs are a popular choice among investors looking to capitalize on a bullish market trend. These ETFs are designed to track the performance of an underlying index or sector expected to grow and deliver positive returns.
Leveraged bull ETFs should only be held for the short term, perhaps only a day, because the effects of overnight correction will erode returns over time.
Bull ETFs, also known as “long” ETFs, are designed to appreciate in value when the underlying market or sector rises. This is achieved through the use of financial instruments such as futures contracts, options, and swaps. By investing in a bull ETF, investors can gain exposure to a basket of stocks without having to purchase individual securities.
Please Note: This site is provided to you for informational purposes only and should not be construed as an offer to buy or sell a particular security or a solicitation of offers to buy or sell a particular security. The authors & contributors are not registered financial advisors and do not give any personalized portfolio or stock advice.What Are Leveraged ETFs?
Leveraged or Bull ETFs are exchange-traded funds that enable you to bet on the upward direction of a market, sector, or index. Leveraged ETFs enable you to magnify your profits or losses using leverage without the complexity of Options contracts.
Leveraged ETFs usually have built-in leverage of 2x or 3x leverage. If you buy a 3x Leveraged ETF on any market day, and the index moves up 2%, you can expect a 6% profit. Conversely, if the market moved down 2% on that day, the 3x leveraged ETF would ensure you incur a loss of 6%.
- If you are looking to bet against the market (short), take a look at our Best Inverse ETFs list.
The Best Leveraged Bull ETFs
While there is no single “Best Leveraged ETF,” good Bull ETFs all share the following traits: They should have significant assets under management, a large enough trading volume to ensure liquidity and low management fees.
This is why our list of the best Leveraged ETFs includes the 10-day average trading volumes, the net assets under management, and the expense ratio.
How to Trade Leveraged ETFs?
1. Understand Leveraged ETF Decay
All Leveraged ETFs have warnings that they should only be traded on a daily basis. Of course, you can hold them for longer than one day, but you will see mismatches in the return of the short ETF vs. the actual index over time. This is known as leveraged ETF decay.
Leveraged ETFs Do Not Match the Index Performance Because:
- The underlying contracts supporting the leveraged ETFs need to be rebalanced at the end of the trading day; this causes slippage.
- The volatility of an index will affect compounding, which in turn affects the inverse ETF.
- Related Article: Our Resident ETF Trader Joe’s Leveraged ETF Strategy
2. Leveraged ETFs Should Have Good Liquidity & Volume
It is important that if you purchase a Leveraged/Bull ETF, you can actually sell it when you want to, for a price that is close to your target price. There are 124 Leveraged ETFs on the US exchanges, and the average 10-day trading volume is 1 million shares per day. You will want to choose ETFs that average at least 500,000 traded per day.
3. Choose ETFs With Higher Assets Under Management
The median amount of Net Assets under management for leveraged and inverse ETFs is $50 million. It is wise to only utilize ETFs with more than $100 million in assets managed; this helps with liquidity and the fund’s stability.
4. ETFs Should Have Low Expenses
Any Inverse or Leveraged ETF you choose to trade should have lower expense ratios. Of the 244 ETFs in this study, the average expense ratio is 0.96%, but the range of expenses spanned from 1.65% to 0.3%. The largest, most liquid funds have an expense ratio between 0.95% and 1.08%, which is acceptable.
5. Use a Commission Free Broker to Minimize Costs
When purchasing ETFs, you should select a broker that enables you to buy and sell ETFs with $0 zero commissions. Firstrade has over 2,200 commission-free ETFs, the largest in the industry. Read the Firstrade Review or visit Firstrade.
Leveraged S&P 500 ETFs
| Leveraged S&P 500 ETFs | Ticker | Expense Ratio | Leverage |
| ProShares Ultra S&P500 | SSO | 0.91% | 2x |
| ProShares UltraPro S&P500 | UPRO | 0.93% | 3x |
| Direxion Daily S&P500 Bull 3X Shares | SPXL | 1.01% | 3x |
| Direxion Daily S&P Biotech Bull 3X Shares | LABU | 1.04% | 3x |
| Direxion Daily S&P Oil & Gas Exp. & Prod. Bull 2X Shares | GUSH | 1.04% | 2x |
| Direxion Daily S&P 500 High Beta Bull 3X Shares | HIBL | 0.98% | 3x |
| Direxion Daily S&P 500 Bull 2X Shares | SPUU | 0.64% | 2x |
| UBS ETRACS Monthly Pay 2xLeveraged S&P Dividend ETN | SDYL | 0.30% | 2x |
Research Powered By Stock Rover Our Recommended Stock & ETF Research Platform. Read the Stock Rover Review.
📈Live Charts: Leveraged S&P 500 ETFs
ProShares Ultra S&P500 (SSO)
ProShares UltraPro S&P500 (UPRO)
Direxion Daily S&P500 Bull 3X Shares (SPXL)
Direxion Daily S&P Biotech Bull 3X Shares (LABU)
Leveraged NASDAQ ETFs
| Leveraged NASDAQ ETFs | Ticker | Expense Ratio | Leverage |
| Invesco QQQ Trust | QQQ | 0.20% | 1x |
| ProShares UltraPro QQQ | TQQQ | 0.95% | 3x |
| ProShares Ultra QQQ | QLD | 0.95% | 2x |
| ProShares Ultra Nasdaq Biotechnology | BIB | 0.95% | 2x |
Research Powered By Stock Rover Our Recommended Stock & ETF Research Platform. Read the Stock Rover Review.
📈Live Charts: Leveraged NASDAQ ETFs
Invesco QQQ Trust (QQQ)
ProShares UltraPro QQQ (TQQQ)
ProShares Ultra QQQ (QLD)
ProShares Ultra Nasdaq Biotechnology (BIB)
TradingView 4.8/5⭐ : The Best Trading Platform I’ve Tested in 20+ Years
With lightning-fast charts, powerful pattern recognition, smart screening, backtesting, and a global community of 20+ million traders — it’s a powerful edge in today’s markets.

If you want one platform that gives you an edge, this is it.
Leveraged Dow ETFs
| Leveraged Dow ETFs | Ticker | Expense Ratio | Leverage |
| ProShares UltraPro Dow30 | UDOW | 0.95% | 3x |
| ProShares Ultra Dow30 | DDM | 0.95% | 2x |
| Direxion Daily Dow Jones Internet Bull 3X Shares | WEBL | 0.98% | 3x |
Research Powered By Stock Rover Our Recommended Stock & ETF Research Platform. Read the Stock Rover Review.
📈Live Charts: Leveraged Dow ETFs
ProShares UltraPro Dow30 (UDOW)
ProShares Ultra Dow30 (DDM)
Direxion Daily Dow Jones Internet Bull 3X Shares (WEBL)
Leveraged Russell Mid Cap ETFs
| Leveraged Russell Mid Cap ETFs | Ticker | Expense Ratio | Leverage |
| ProShares UltraPro Russell 2000 | URTY | 0.95% | 3x |
| ProShares Ultra Russell 2000 | UWM | 0.95% | 2x |
Research Powered By Stock Rover Our Recommended Stock & ETF Research Platform. Read the Stock Rover Review.
📈Live Charts: Leveraged Russell Mid Cap ETFs
ProShares UltraPro Russell 2000 (URTY)
ProShares Ultra Russell 2000 (UWM)
Leveraged Oil ETFs
| Leveraged Oil ETFs | Ticker | Expense Ratio | Leverage |
| ProShares Ultra Bloomberg Crude Oil | UCO | 0.95% | 2x |
| Direxion Daily S&P Oil & Gas Exp. & Prod. Bull 2X Shares | GUSH | 1.04% | 2x |
| MicroSectors U.S. Big Oil Index 3X Leveraged ETNs | NRGU | 0.95% | 3x |
| ProShares Ultra Oil & Gas | DIG | 0.95% | 2x |
| MicroSectors U.S. Big Oil Index 2X Leveraged ETNs | NRGO | 0.95% | 3x |
Research Powered By Stock Rover Our Recommended Stock & ETF Research Platform.
📈Live Charts: Leveraged Oil ETFs
ProShares Ultra Bloomberg Crude Oil (UCO)
ProShares Ultra Oil & Gas (DIG)
Leveraged Gold ETFs
| Leveraged Gold ETFs | Ticker | Expense Ratio | Leverage |
| Direxion Daily Gold Miners Index Bull 2X Shares | NUGT | 1.17% | 3X |
| Direxion Daily Junior Gold Miners Index Bull 2X Shares | JNUG | 1.12% | 2X |
| ProShares Ultra Gold | UGL | 0.95% | 3X |
| DB Gold Double Long ETN | DGP | 0.75% | 2X |
Research Powered By Stock Rover Our Recommended Stock & ETF Research Platform.
📈Live Charts: Leveraged Gold ETFs
Direxion Daily Gold Miners Index Bull 2X Shares (NUGT)
Direxion Daily Junior Gold Miners Index Bull 2X Shares (JNUG)
ProShares Ultra Gold (UGL)
DB Gold Double Long ETN (DGP)
Leveraged Emerging Markets/International ETFs
| Leveraged Emerging Markets International ETFs | Ticker | Expense Ratio | Leverage |
| Direxion Daily MSCI Brazil Bull 2X Shares | BRZU | 1.29% | 2x |
| Direxion Daily MSCI Emerging Markets Bull 3X Shares | EDC | 1.33% | 3x |
| Direxion Daily MSCI India Bull 3x Shares | INDL | 1.33% | 3x |
| Direxion Daily MSCI Real Estate Bull 3X Shares | DRN | 0.99% | 3x |
| ProShares Ultra MSCI Emerging Markets | EET | 0.95% | 2x |
| Direxion Daily MSCI Developed Markets Bull 3X Shares | DZK | 1.16% | 3x |
| Direxion Daily MSCI Mexico Bull 3X Shares Direxion Daily MSCI Mexico Bull 3 | MEXX | 1.21% | 3x |
| ProShares Ultra MSCI EAFE | EFO | 0.95% | 2x |
| ProShares Ultra MSCI Brazil Capped | UBR | 0.95% | 2x |
| ProShares Ultra MSCI Japan | EZJ | 0.95% | 2x |
Research Powered By Stock Rover Our Recommended Stock & ETF Research Platform.
3X Leveraged ETFs List
| 3X Leveraged ETFs List | Ticker | Expense Ratio | Leverage |
| ProShares UltraPro QQQ | TQQQ | 0.95% | 3x |
| ProShares UltraPro S&P500 | UPRO | 0.93% | 3x |
| Direxion Daily S&P500 Bull 3X Shares | SPXL | 1.01% | 3x |
| ProShares UltraPro Dow30 | UDOW | 0.95% | 3x |
| Direxion Daily S&P Biotech Bull 3X Shares | LABU | 1.04% | 3x |
| ProShares UltraPro Russell2000 | URTY | 0.95% | 3x |
| Direxion Daily MSCI Emerging Markets Bull 3X Shares | EDC | 1.33% | 3x |
| MicroSectors U.S. Big Oil Index 3X Leveraged ETNs | NRGU | 0.95% | 3x |
| Direxion Daily MSCI India Bull 3x Shares | INDL | 1.33% | 3x |
| Direxion Daily MSCI Real Estate Bull 3X Shares | DRN | 0.99% | 3x |
| Direxion Daily Dow Jones Internet Bull 3X Shares | WEBL | 0.98% | 3x |
| Direxion Daily S&P 500 High Beta Bull 3X Shares | HIBL | 0.98% | 3x |
| Direxion Daily MSCI Developed Markets Bull 3X Shares | DZK | 1.16% | 3x |
| Direxion Daily MSCI Mexico Bull 3X Shares Direxion Daily MSCI Mexico Bull 3 | MEXX | 1.21% | 3x |
| MicroSectors U.S. Big Oil Index 2X Leveraged ETNs | NRGO | 0.95% | 3x |
Research Powered By Stock Rover Our Recommended Stock & ETF Research Platform.
Leveraged ETF Performance vs. The S&P 500
The long-term performance of leveraged ETFs does not match the performance of the underlying index. In this example, you can see a 1-year chart of the S&P 500 versus the ProShares Ultra 2X leveraged ETF.
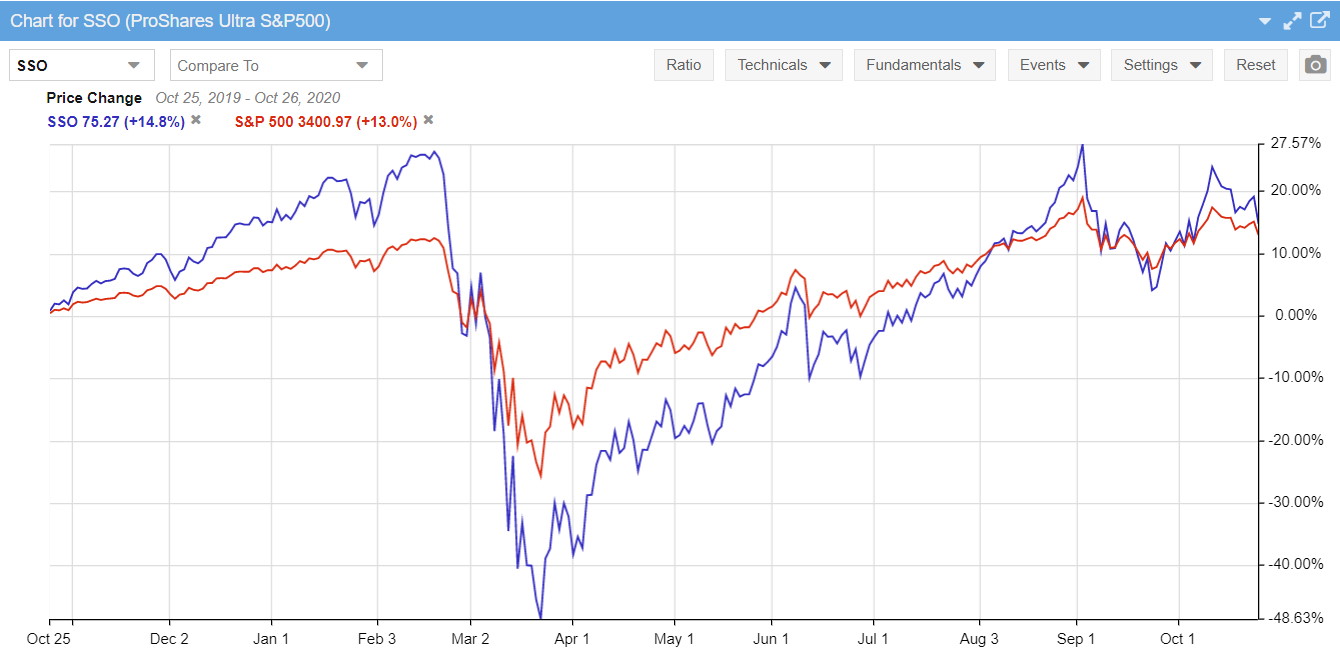
1 Year 2X Leveraged ETF vs. S&P 500 Performance.
- The S&P 500 Index gained 13%
- The ProShares Ultra 2X gained 14.8%
From October 25, 2019, to October 25, 2020, the 2X leveraged ETF made a 14.8% gain, only 1.8% more than the S&P 500, which made 13%. If you had expected to make twice the gain of the S&P 500, you would be mistaken. As mentioned before, this disparity is down to leveraged ETF decay through compounding and rebalancing.
Bear Market Leveraged ETF Performance
1 Month 2X Leveraged ETF vs. S&P 500 Performance.
- The S&P 500 Index lost 32%
- The ProShares Ultra 2X lost 51%
From peak to the bottom of the Corona Crash (February 20, 2020, to March 20, 2020), the 2X Long/Bull ETF made a loss of 51% versus the loss in the S&P 500 of 32%. The losses were, of course, magnified due to the 2x leverage, but as you can see, the losses were about 1.8x.
Bull Market Leveraged ETF Performance
1 Month 2X Leveraged ETF vs. S&P 500 Performance.
- The S&P 500 Index gained 55%
- The ProShares Ultra 2X gained 201%
From March 23, 2020, to September 2, 2020, the Covid Crash Recovery Bull market, the 2X Long/Bull ETF, made a huge gain of 201% versus the S&P 500 of 55%. The gains were magnified from the expected 2x leverage to 4x. This was due to the near-constant uptrend in the market for 5 months.
Summary
Timing is crucial when trading Leveraged ETFs. The chart above shows that, in the long term, you cannot expect 2X or 3X leverage to hold. But in the short term, leveraged ETFs are a great way to magnify your profits and diversify without using stock options.