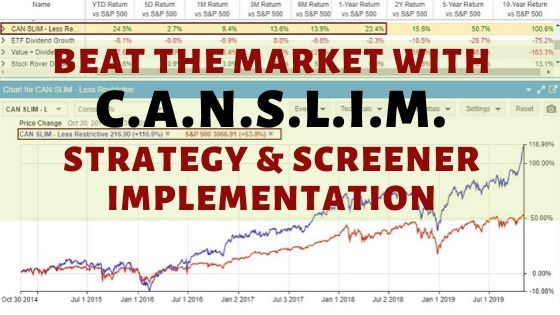
CANSLIM is an active investment strategy that utilizes specific screening criteria such as earnings, market leadership, product innovation, institutional ownership, and stock price trends.
These key criteria play a vital role in the process of stock selection.
According to IBD, the CANSLIM strategy works, claiming a 20.7% average annual return, but no documented track record exists.
We will explain the CANSLIM (also known as CAN SLIM) methodology and test its performance track record so you can decide whether or not to use this strategy.
What is CANSLIM?
CANSLIM is a stock investing strategy designed by William J. O’Neil to attempt to produce market-beating profit performance. Using the CANSLIM criteria in your investing should mean profitable returns. Current Earnings, Annual Earnings, New Products, Supply, Leaders, Institutional Sponsorship, and Market Direction are important screening criteria in the CANSLIM system.
It combines fundamental analysis and technical analysis into a cohesive strategy.
Does CANSLIM Work?
According to IBD, the CANSLIM strategy works, claiming a 20.7% average annual return. IBD provides no audited evidence to back up this assertion. The only CANSLIM strategy I found to work is the Stock Rover “CAN SLIM (Less Restrictive)” screener.
The CANGX and Innovator IDB 50 ETF based on CANSLIM have underperformed in the market. The AAII CANSLIM portfolios and the “OPBM II” academic research are outdated and no longer valid.
What is the CANSLIM Methodology?
The CANSLIM method combines business fundamentals like market leadership, product innovation, and management team effectiveness with business and stock market fundamentals like earnings and stock price growth, institutional ownership, and overall market direction.
The CANSLIM Criteria
- C – Current Earnings
- A – Annual Earnings
- N – New Products or Management
- S – Supply and Demand
- L – Leaders
- I – Institutional Ownership
- M – Market Direction
Below, we will summarize the key elements of the strategy:
C – Current Earnings
In the CANSLIM abbreviation, the C represents Current Earnings. Has the company made a strong recent earnings announcement, considerably more than the earnings one year previously?
From his research, O’Neill discovered that most companies that experienced strong stock price growth had quarterly earnings growth of over 70% before the price growth started.
However, that might be the case for a small handful of hugely successful companies. To build a portfolio of stocks, or at least have a choice of more companies, he recommends a most recent quarterly (MRQ) earnings per share (EPS) increase of at least 18-20%. He also suggests an accompanying sales growth of at least 25%.
The sales growth check is essential because, without consistent sales growth, it is impossible to maintain earnings growth.
Has the company made a strong recent earnings announcement, which is considerably more than the earnings one year previously?
A – Annual Earnings.
The “A” in the CANSLIM abbreviations stands for Annual Earnings. Is there a strong track record of earnings growth in previous years? As O’Neill recommends, seeking an annual growth rate in earnings of at least 25% is advisable. Additionally, a return on equity (ROE) exceeding 17% should be examined, as it indicates efficient capital utilization by the company.
Most stock screeners allow you to filter on 1-, 3-, and 5-year annual earnings growth rates. Select a 5-year annual earnings growth rate. This will help you filter out companies experiencing short-term growth or manipulating accounts to show higher earnings for a particular quarter. You can play with the timescale you use, but this seems like a reasonable criterion.
N – New Products, Management, or Price Highs.
In CANSLIM, N refers to New: new production, new leadership, or new stock price highs. Has the company innovated its product base or injected new management to seek higher performance? Here, we essentially move to a business question.
Suppose a company has a history of innovation or developing products superior to the competition in price, quality, or both. In that case, this is an excellent signal for future stock price growth.
According to O’Neill, management or board changes were also a positive indicator. Injecting new blood into an organization’s leadership structure drives growth; New People = New Ideas.
I tend to disagree here; continually injecting or hiring externally to find that magic growth formula rarely works out positively.
Look at the history of Hewlett Packard (Ticker: HPQ); since the founders left, the company has constantly been injecting new management, merging, and spinning off, to the dismay of its shareholders and employees.
Finally, the suggestion is that new stock price highs might encourage further demand for the stock and push prices even higher.
S – Supply and Demand.
The S in CANSLIM is a technical criterion referring to stock demand increases. Does the stock have increasing demand? Is trading volume increasing with the price?
Here, we get to a core principle: the only reason stock prices go up or down. Stock prices decrease if the sellers (supply) outnumber the buyers (demand). If demand outstrips supply, prices go up.
A stock price may go up or down on any single day, which is mostly irrelevant. However, you know demand is higher than supply if you see volume growth and stock price increases over weeks and months.
O’Neill recommends that the daily trading volume be higher than the average volume for the stock in the previous three months.
L – Leaders
The L in CANSLIM asks, “Is the company a leader in its market?” This is another crucial business question about competitive advantage.
A company that is a leader in its industry must have some critical competitive advantages in product, service quality, or pricing. However, finding these companies by sifting through every firm’s product listing and doing a competitive market analysis is impossible. So, O’Neill suggests looking for companies with stock price strength higher than their competitors, even above 80% of the stock market.
Essentially, any company near, at, or breaking through its stock price 52-week high is a candidate. Add to this any company outperforming the major market indices regarding price growth. So, to beat the market, you need to select companies that are already beating the market. Does that seem reasonable?
I – Institutional Ownership.
In CANSLIM, the I refers to Institutional ownership. Does the stock have a substantial level of institutional ownership? More than 70% of all shares are owned by institutions, mostly on behalf of their investors.
The point here is that you would want to see at least 30% institutional ownership to know that the company is at least on the radar of institutional buyers.
As investment companies have the most buying power, they are in the position to make the most significant impact on stock prices. If the company is not attractive to investment firms, then the chances of the stock price moving significantly higher or negligible.
Finally, if institutional ownership is over 90%, how much room is there for the stock price to increase? Not much.
M – Market Direction.
In CANSLIM, M refers to market direction. This criterion is designed to ensure an investor only invests with the market’s direction, thus increasing the chance of profitability. Understanding the overall market direction is essential to time your stock purchase effectively.
The market moves in three directions: uptrend, downtrend, or consolidation (sideways). If you buy stocks during a multi-year bear market, then the chances of you making any money are small. During periods of market fear, most company stock prices drop.
According to O’Neill, three out of four stocks move in the same direction as the market.
The actual reality is that it takes 3 out of 4 stocks to move upwards to move the market upward, as the market is only a reflection of all the stock prices. The key takeaway here is that if you buy stocks in a Bull market, you have a much higher chance of making a profit, and that is a fact.
CANSLIM Strategy
The CANSLIM model is a flexible investing style that relies on the positive momentum generated by fast-growing, profitable companies with leading products and services in a growing market.
Flexibility
With CANSLIM, a stock has no defined holding period. You may hold the stock for two days or two years. It could be seen as a swing trading strategy or a medium-term buy-and-hold strategy. One thing it is not is a value investing strategy.
The entry point into a stock is suggested when the stock price breaks into a new 52-week high. The strategy also indicates that you should cut your losses and sell if the stock falls 7 or 8%. For any given stock, this could happen within a week or over a few years.
Momentum
CANSLIM is a momentum strategy. The rules are to buy when the stock is at a new 52-week high, experiencing increased trading volume, and when the overall market is in an uptrend. This is the definition of momentum trading and market timing.
Profitable Growth
The CANSLIM strategy also requires a company to grow earnings strongly at its core. Current quarterly and annual earnings and sales must increase aggressively. So, you are looking for profitable, fast-growing companies.
Great Products
Of course, the L in CANSLIM refers to companies leading their industry in product and services, innovation, or stock price growth. This makes sense. Would you want to buy shares in a company falling behind its competitors? Leading could also mean ethical leadership and good ESG policies.
Growing Markets
Finally, the M in CANSLIM refers to growing markets. The market that the company operates in needs to be growing; for example:
- The widespread rapid adoption of the internet helped Google’s explosive growth.
- Over the last eight years, Nvidia’s growth has been driven by the cryptocurrency craze; their graphics card chips are used in Crypto mining operations.
The CANSLIM strategy is to:
Buy stocks in profitable companies, with great products, in growing markets at the right time.
CANSLIM Performance
Investors Business Daily claims good results for the CANSLIM system, but independent sources provide mixed results. We will examine one academic study, the history of two CANSLIM ETFs, and three AAII model portfolios.
Let us look at how the CANSLIM strategy performed in the past.
CANSLIM Performance – Academic Research
A 2013 academic paper entitled “OPBM II: An Interpretation of the CAN SLIM Investment Strategy” found the following results:
“The simplified CANSLIM trading strategy outperformed the NASDAQ 100 Index by .94% per month from 1999 through 2013 and achieved a greater reward per unit of risk.”

Source & Copyright: Matthew Lutey (University of New Orleans) and Michael Crum and David Rayome (Northern Michigan University)
In academic research, the CANSLIM methodology performed well.
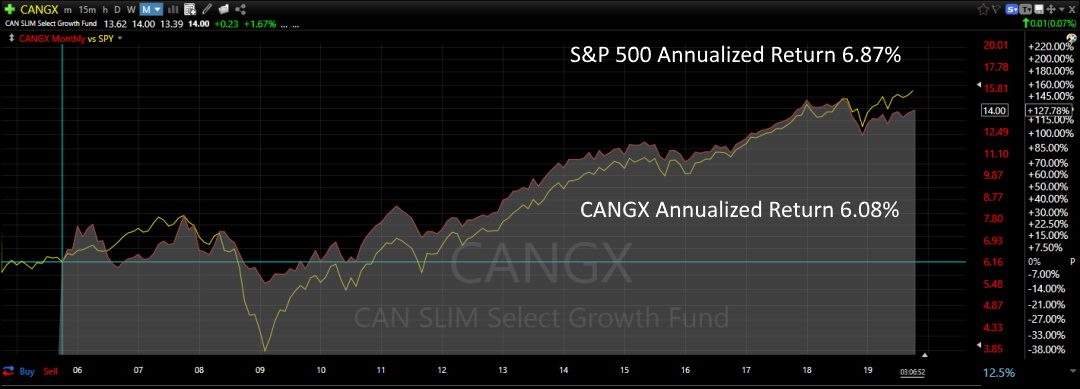
CANSLIM ETF (CANGX) Performance Results
The CAN SLIM Select Growth Fund (Ticker: CANGX) was established in 2005 to implement the CANSLIM Select strategy into an ETF. Investors can buy the ETF rather than implement the strategy themselves.
This is a great idea, except that the CANGX fund did not exhibit the expected 0.94% monthly return higher than the underlying index. In fact, from my calculations, it has trailed the S&P 500 by 0.79% per year.
CANSLIM Tactical Growth Fund ETF
The CANGX CANSLIM Tactical Growth Fund ETF stopped trading in July 2021 and was liquidated due to insufficient investors buying into the fund, probably because of a lack of performance.
“NorthCoast Asset Management LLC, the Adviser to the CAN SLIM® Tactical Growth Fund (the “Fund”), has recommended, and the Board of Trustees (the “Board”) of Professionally Managed Portfolios has approved, the liquidation and termination of the fund. The Adviser’s recommendation was primarily based on the fact that the fund is not economically viable at its present size, and the Adviser did not anticipate that the fund would experience meaningful growth in the foreseeable future. The liquidation is expected to occur after the close of business on August 31, 2021.” Source
CANSLIM ETF Performance
The CANSLIM Innovator IBD 50 ETF (Ticker: FFTY) has underperformed the market since its inception in 2015. From 2015 to 2023, the CANSLIM ETF returned -6.87%, vs. the S&P 500 (112% and the Nasdaq 100 247%.
This CANSLIM ETF is still running, but the performance is poor. The stock chart below shows the CANSLIM ETF performance from April 2015 to the present.
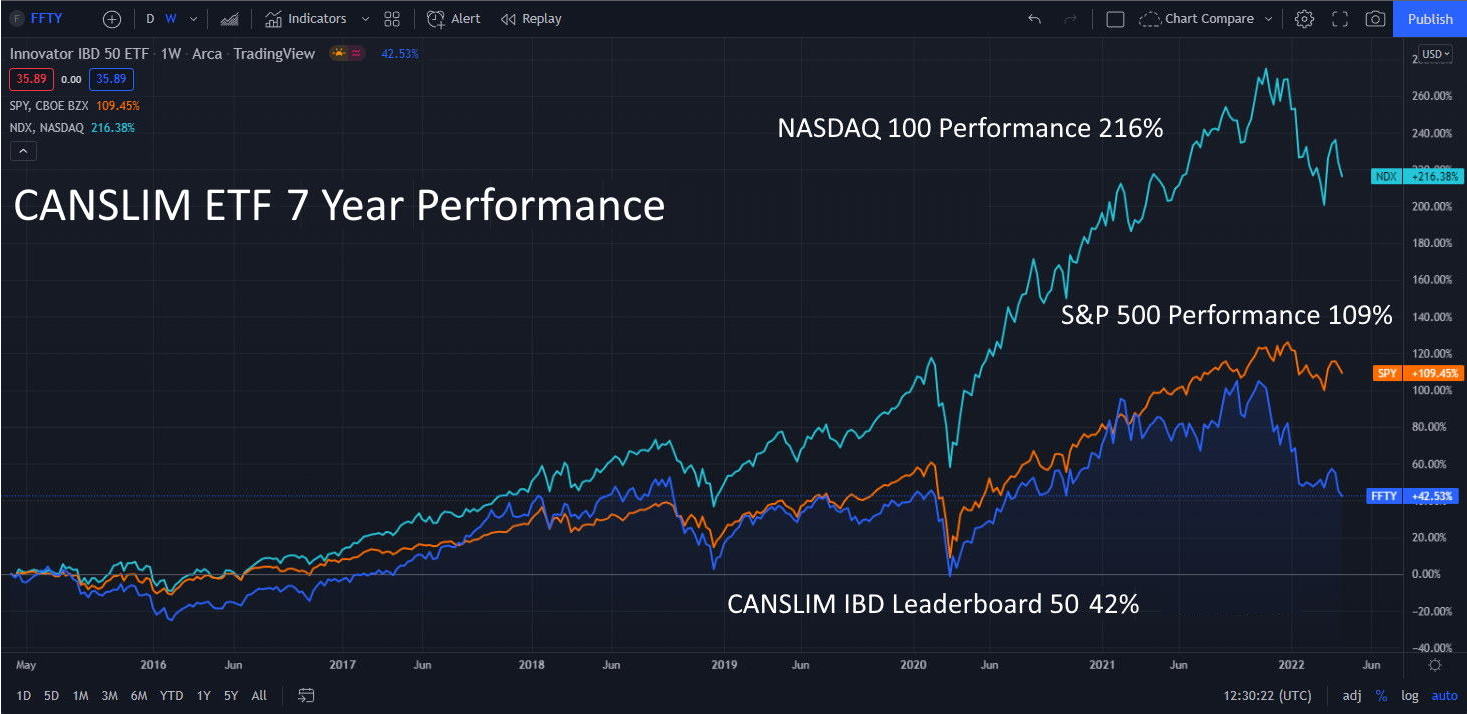
See the IBD 50 Fund Performance Live on TradingView
The IBD 500 ETF returned 42% over seven years to 2022. The S&P 500 ETF returned 109%, and the Nasdaq 100 made 216%.
So again, we can see that professional fund managers cannot make the CANSLIM methodology and strategy successful. The chart shows that over the last seven years, the IDB 50 ETF was rarely ahead of the S&P 500 in terms of performance.
Backtesting the CANSLIM Method
To test the CANSLIM method, we can use the AAII, which maintains an audited track record of three interpretations of a CANSLIM portfolio starting from February 1999. The backtested performances range from 13.9% to 20.2% average returns for the period, which is ahead of the S&P 500.
These portfolios look promising until you look inside the holdings of each portfolio.
AAII CANSLIM Portfolio Performance
The performance of the three AAII CANSLIM model portfolios lost an average of 25% in 2022. These portfolios are also unreliable because each contains three or fewer stocks.
This means the CANSLIM methodology is too stringent for today’s stock market, and insufficient stocks meet the CANSLIM criteria. Alternatively, it could mean that the AAII interpretation of CANSLIM is too restrictive.
When I dug into the AAII CAN SLIM portfolios, I discovered that the “O’Neil’s CAN SLIM Revised 3rd Edition Screen” portfolio contains only one stock, the “O’Neil’s CAN SLIM No Float Screen” portfolio contains only three stocks, and the “O’Neil’s CAN SLIM Screen” portfolio has only three stocks.
We cannot rely on the AAII CANSLIM portfolios for an accurate performance backtest of the investing system.
You want to be a successful stock investor but don't know where to start.
Learning stock market investing on your own can be overwhelming. There's so much information out there, and it's hard to know what's true and what's not.

Liberated Stock Trader Pro Investing Course
Our pro investing classes are the perfect way to learn stock investing. You will learn everything you need to know about financial analysis, charts, stock screening, and portfolio building so you can start building wealth today.
★ 16 Hours of Video Lessons + eBook ★
★ Complete Financial Analysis Lessons ★
★ 6 Proven Investing Strategies ★
★ Professional Grade Stock Chart Analysis Classes ★
How To Create a CANSLIM Stock Screener
To execute an improved CANSLIM strategy, it is imperative to employ a stock screener to systematically scan the entire stock market and identify stocks that meet the required criteria.
CANSLIM Stock Screener
A CANSLIM stock screener must scan for Current and Annual Earnings with a 5-year history. Next, the screener must filter on 52-week stock price highs, the Number of Shares Available, and the share price Relative Strength vs. Competitors. The Institutional Ownership criteria are also critical.
To implement a CANSLIM strategy, you must use a stock screener to automatically scan the entire stock market to find stocks that meet the right criteria.
The best stock screeners on the market today are Stock Rover for USA and Canada exchanges and TradingView for international exchanges. If you intend to implement this system on US and Canadian stocks, we strongly recommend Stock Rover; it won our Top 10 Best Stock Screener Review and is also great value for money.
The Stock Rover CANSLIM Screener
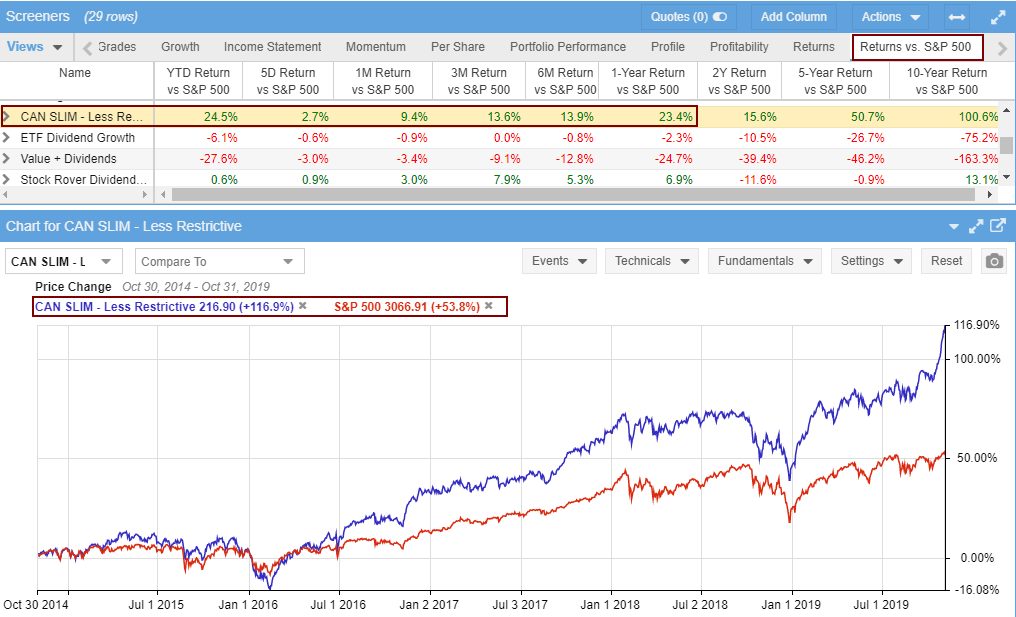
The CANSLIM strategy results using the Stock Rover screener are impressive, beating the S&P 500 on all timescales from 5 days to 10 years; look at the screenshot below.
Get the CANSLIM Method Screener on Stock Rover
Stock Rover CANSLIM Portfolio Performance
Using the inbuilt CANSLIM strategy screener in Stock Rover produces much-improved performance, with a 1-year profit of 48.1% vs. the S&P 500’s 10.5% and 5-year performance of 176% vs. 68.3%.
You can see that the CANSLIM scan in Stock Rover has beaten the S&P 500 solidly over the past five years.
| CANSLIM vs. S&P 500 | Stock Rover CANSLIM | S&P 500 |
| 1-Year | +48.1% | +10.5% |
| 5-Year | +176% | +68.3% |
- So, try Stock Rover if you want to use the CANSLIM growth strategy in your investing.
5 Steps to Implement CANSLIM in Stock Rover
Here are the 5 Steps to implement the Stock Rover CANSLIM stock screening strategy.
1 – Register with Stock Rover
You will need a Premium Plus Membership, which gives you access to all the criteria and the database with a unique 10-year history. It will also allow you to implement all our Warren Buffett screeners, our full list of stock screening strategies, and our dividend growth and dividend yield strategies.
Stock Rover 4.7/5⭐ : My Top Pick for Smart Investors
Investing In Stocks Can Be Complicated. Stock Rover Makes It Easy.
★
Growth Investing - with industry-leading
Research Reports ★
★ Value Investing - using Warren Buffett's Fair Value and Margin-of-Safety ★
★ Income Investing - rank by yield, growth, quality, and safety using 650 metrics ★

"I have been researching and investing in stocks for 20 years! I now manage all my long-term investments using Stock Rover." — Barry D. Moore, Founder: LiberatedStockTrader.com
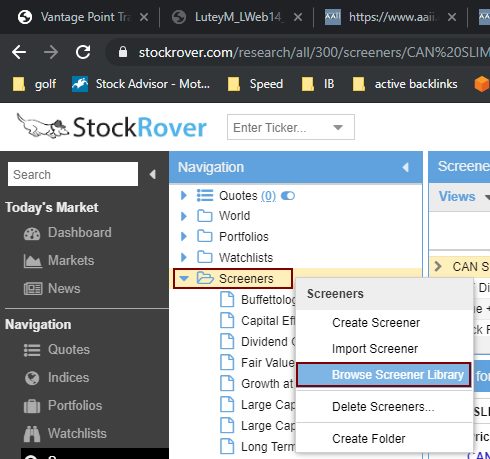
2 – Browse Screener Library
Launch Stock Rover and select:
- Screeners (Down Arrow)
- Browse Screener Library

Importing the CANSLIM Screener in Stock Rover
This takes you to the following screen.
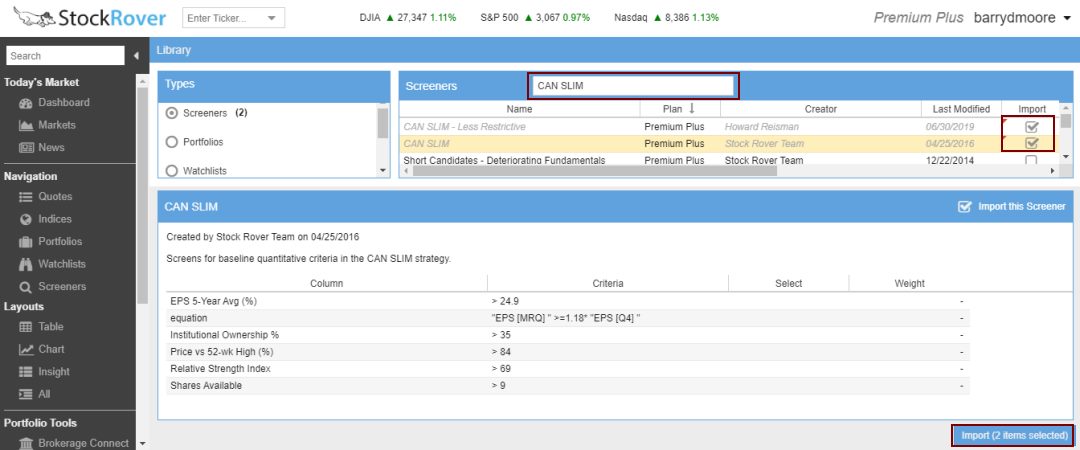
3 – Import CANSLIM Screeners
Stock Rover has an outstanding performance record and a built-in screener for CANSLIM called “CAN SLIM—Less Restrictive.”
- In the Screeners search box, type “CAN SLIM.”
- Select the CANSLIM (Less Restrictive) screener.
- Click the “Import” Button.
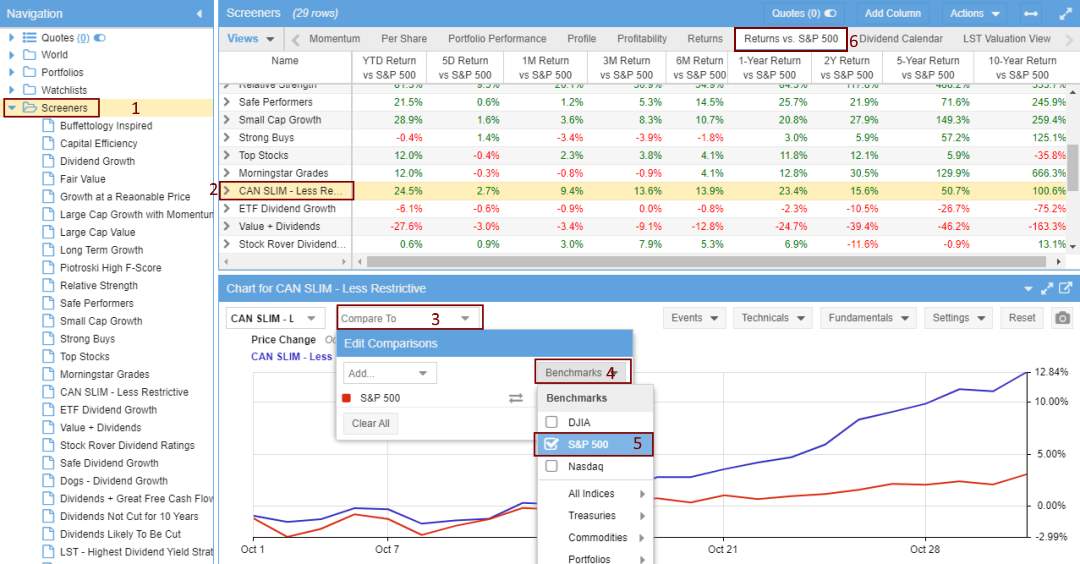
4 – View the Portfolio Performance
Now that you have imported the screener, here is how to set up the excellent comparison view vs. the S&P 500
- Select Screeners
- Select the CAN SLIM – Less Restrictive Screener
- In the Chart Below, Select “Compare To.”
- Select Benchmarks
- Select S&P 500 or NASDAQ
- Select Return Vs. S&P 500 Column Views
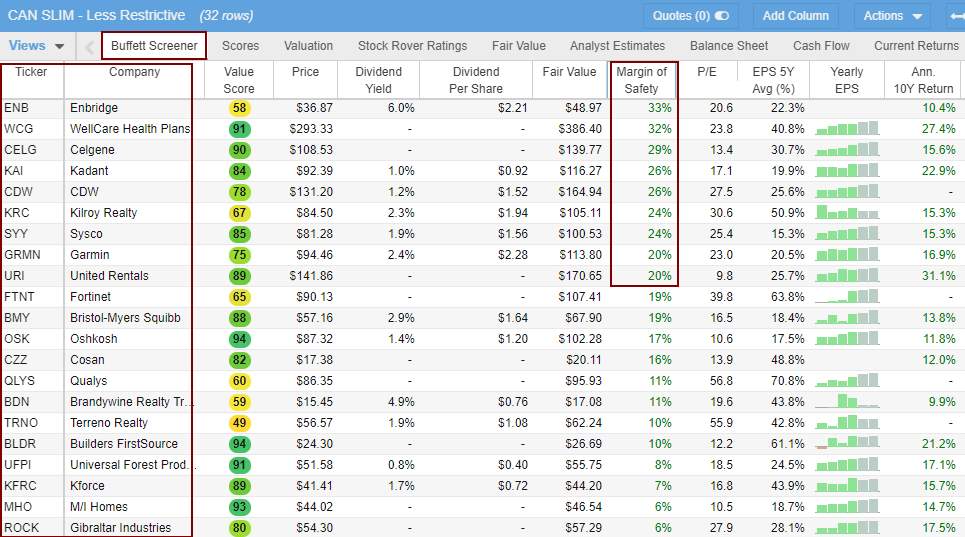
5 – Select Your CANSLIM Stocks
The scan produces a list of 32 stocks from the stock exchange listing over 12,000 companies. Even though this list is small, 32 may still be too many to hold at any one time. So, you must carefully select the right companies to invest in.
I suggest combining the CANSLIM strategy with Warren Buffett’s margin of safety concept in value investing. The margin of safety measures how undervalued a stock is compared to its intrinsic value. The more undervalued a stock is, the safer the investment.
So, you could narrow down your stock selection using, for example, the top 10 stocks with the highest margin of safety. See the image below.
Get the CANSLIM Method Screener on Stock Rover
FAQ
What is the best software for CANSLIM?
Stock Rover is the best software for creating a CANSLIM portfolio. It offers an integrated CANSLIM strategy, comprehensive analytics, portfolio tracking, and robust research capabilities. IBD also offers a screening service for CANSLIM.
What is CANSLIM investing?
CANSLIM is an acronym for a growth investing strategy. It stands for C – Current Quarterly Earnings, A – Annual Earnings Increases, N – New Products or Services, S – Supply and Demand, L – Leader or Laggard in Industry Group, I – Institutional Sponsorship, M – Market Direction.
How does CANSLIM work?
CANSLIM's strategy prioritizes stocks with robust fundamentals, including positive earnings, steady growth, and institutional sponsorship. It aims to identify companies exhibiting indicators of exceptional performance.
What are the advantages of CANSLIM investing?
The CANSLIM strategy aims to pinpoint high-growth stocks and maximize returns by capitalizing on bullish trends. This approach offers a systematic and effective method for investors looking to make smart investment decisions.
How effective is the CANSLIM investing strategy?
Our research shows that ETFs designed around the CANSLIM strategy have proven ineffective and have underperformed the market over the last 10 to 15 years. However, our testing shows using less restrictive criteria in a custom CANSLIM stock screening strategy produced very good results.
What type of stocks does CANSLIM focus on?
CANSLIM investors typically target companies that exhibit EPS growth of over 20%. They actively seek out high-growth stocks, especially those with innovative products or services and robust institutional backing.
Does CANSLIM work in bear markets?
CANSLIM is not as effective in bear markets compared to bull markets. Primarily designed as a strategy for identifying winners during bullish periods, its performance may be less consistent in bearish conditions due to its heavy reliance on growth indicators.
How can I implement the CANSLIM investing strategy?
To implement CANSLIM, you need to analyze companies based on the seven factors outlined in the strategy. Alternatively, try the CANSLIM (Less Restrictive) pre-built stock screener from Stock Rover; it has shown good 1-year and 5-year performance according to our testing.
Thank you for this useful strategy.